Executive Summary
When financial planners run retirement projections for clients, the most common assumption is to assume some type of constant inflation adjusted earnings growth (i.e., annual cost-of-living adjustments [COLAs]). This may seem reasonable enough, as future earnings are highly variable, and many employers do try and offer cost-of-living adjustments to their employees. So why not just assume that will continue throughout one’s career, at least as a baseline?
However, as it turns out, income growth typically follows some predictable paths that don’t necessarily just align with steady (inflation-adjusted) earnings growth; instead, these paths vary significantly based on the general income profile of an individual. For most, income growth throughout their career will actually exceed mere cost-of-living adjustments, which can add up to a lot of additional income (and savings capabilities) over a multi-decade working career! Further, while real income growth is often experienced, real earnings typically peak at least a decade prior to retirement, which is then followed by a subsequent decline in real earnings for the last 10-20 years of one’s career. Which can actually have a substantial impact on the trajectory of retirement savings itself.
In this guest post, Derek Tharp – our new Research Associate at Kitces.com, and a Ph.D. candidate in the financial planning program at Kansas State University – analyzes safe savings rates assuming more realistic earnings growth throughout one’s career, finding that traditional assumptions tend to overstate safe savings rates for low earners and understate safe savings rates for higher earners.
For instance, once we account for more realistic “earnings curves” of workers, it becomes clear that the decline in real earnings over the last 10-20 years of one’s career may actually reduce the retirement need – at least if we assume individuals prefer a smooth transition from pre-retirement to post-retirement spending. As a result, conventional assumptions may actually overstate the required savings rates for all but the top 20% of income earners, while understating the need for top earners (who advisors are most likely to be working with!). Additionally, given that most real earnings growth happens in the first decade or two of one’s career, conventional methods may overstate savings need even further for clients in their 40s or 50s (whose lifestyles aren’t likely actually rising at that point).
Another interesting finding is that once Social Security is incorporated with respect to different earnings curves, it’s possible that low savings rates for many Americans may not be as irrational as is often assumed. In fact, for individuals at the 20th percentile and below (i.e., 1-in-5 Americans), historical safe savings rates may have been as low as 0.3%! And even the median earner would actually “only” need a savings rate of about 6.1%, and earners as high as the 80th percentile would still have a safe savings rate below 10%! Highlighting not only the importance of Social Security to many Americans, but challenging the notion that low savings rates are an indicator of impending retirement doom for many Americans. In other words, this safe savings rate analysis suggests that, when real-world earnings growth is considered, most retirees really will be on track with relatively “modest” savings rates of 10% or less, when supplementing Social Security benefits.
The bottom line is that it’s crucial to recognize that for most workers, simply assuming steady inflation-adjusted earnings growth throughout the working years is not an accurate reflection of reality for most. And earnings curves do matter, because it impacts both the ability to save, when people can afford to save, and the likely level of their pre-retirement lifestyle costs (which in turn will likely impact the cost of the retirement lifestyle they wish to maintain) Of course, there are a lot of contingencies and unknowns when trying to predict earnings curves for any individual, but the fact remains that assuming constant real inflation-adjusted earnings is actually a very problematic default assumption for accumulators saving towards retirement!
Income Growth Assumptions For Retirement Savers
When advisors run a financial plan for clients, most software will default to assuming constant inflation-adjusted earnings growth (i.e., constant real earnings). At first glance, this may seem realistic enough. After all, future earnings are highly variable and many employers have historically tried to offer cost-of-living raises to employees, so why not assume someone will continue to earn what they earn now on an inflation adjusted basis?
A recent study conducted by Guvenen, Karahan, Ozkan, & Song (2016) examined the earnings of millions of U.S. workers based on the data from the Social Security Administration’s Master Earnings File (MEF). From Guvenen et al.’s analysis, we can observe several important characteristics of typical earnings curves that don’t align with traditional financial planning assumptions.
First, the researchers found that earnings growth throughout most workers’ careers will actually be greater than just receiving inflation adjustments each year. This is particularly true in the early stages of one’s career when it is more common to receive promotions and “climb the job ladder” in a manner that provides substantial increases in income.
Second, for most individuals, earnings actually increase at a decreasing rate for much of their careers. As a result, the bulk of earnings growth typically occurs between ages 25 and 35. After age 35, earnings growth typically slows significantly, and real earnings growth will typically end altogether somewhere between ages 40 and 55 (ending at higher ages for higher earners). Beyond that point, most workers actually begin to experience a real earnings decline (though their income may still be increasing on a nominal basis, with small raises that increase wages but not enough to even keep pace with inflation).
Based on their full data set of qualifying individuals (men age 25-28 in 1981, still alive in 2013, and with annual earnings above a minimum threshold for at least 15 years), Guvenen et al. (2016) develop the following life-cycle profile of average real (inflation-adjusted) earnings:
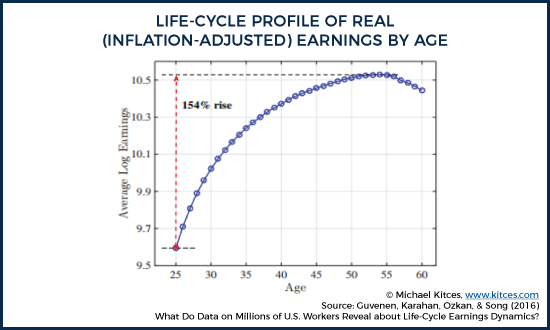
As you can see, on average, real income rose 154% between age 25 and 55 and declined from age 55 to 60. So, for example, an individual earning $40,000 in today’s dollars would be expected to be earning $101,600 at age 55 (also in today’s inflation-adjusted dollars), based on “average” earnings growth. As we can see, this is a significant deviation from the assumption of that they would simply get annual cost-of-living adjustments, which would mean, on an inflation-adjusted basis, they’d still be earning $40,000 at age 55 (in today’s dollars)!
Of course, the caveat here is that average real wage growth is just that – an average, and not necessarily representative of any particular worker. And in fact, the data reveals that there is an incredibly wide dispersion of earnings growth profiles, with those at the upper end of the spectrum experiencing a significantly larger growth rate in real lifetime earnings.
Yet, it is important to note a distinction here between the average and median worker. While the average worker experienced growth of nearly 154%, the median worker only saw their real earnings rise about 60% between ages 25 and 55. In fact, it was only among workers with lifetime earnings above the 80th percentile that actually saw 154% real growth or higher. Further, individuals at the 95th percentile of lifetime earnings saw earnings growth of 380%, while individuals at the 99th percentile experienced a growth rate of 2,600% – indicating some huge discrepancies in typical earnings growth across the lifetime income spectrum. In other words, the upside of earnings growth is not evenly distributed!
It is also important to note that these growth rates are after-the-fact observations based on lifetime earnings. As a result, it’s not necessarily the case that someone who is at the 99th percentile at age 25 should expect 2,600% income growth, but should they expect to end up around the 99th percentile based on earnings throughout their career, then this may serve as a very rough approximation of the kind of earnings growth they may experience in order to get there.
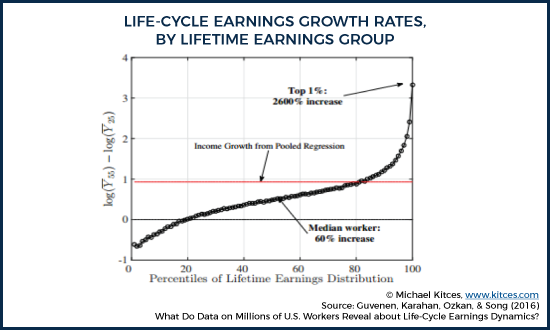
Of course, aggregate analyses like these are smoothing out a lot of noise. Few people actually experience earnings growth as smooth as what is shown in the “average” earnings growth chart referenced earlier.
Nonetheless, the charts above are helpful for examining general trends among large numbers of people. If you are interested in more of the details, the authors do go on to examine the earnings data in much greater depth (examining factors such as earnings variance, skewness, and kurtosis), but a key takeaway from a financial planning perspective is to acknowledge that constant real earnings growth (i.e., annual cost-of-living adjustments) throughout the working career is not a particularly realistic assumption for most people. To oversimplify a bit, a more realistic generalization is that individuals sequentially go through three real earnings phases of their career: high growth, low/no growth, and decline.
Lifetime Earnings Growth By Percentiles
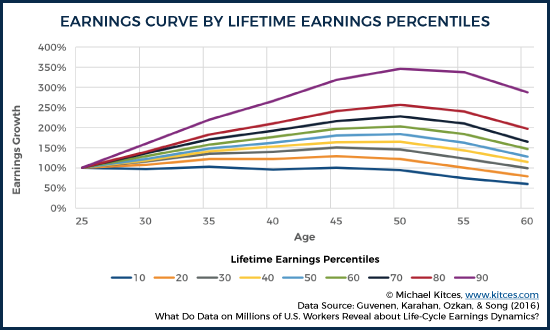
As noted earlier, the trajectory of one's earnings growth throughout the working years varies by income level, with high earners experiencing higher levels of earnings growth and low earners not only experiencing lower levels of earnings growth but also tending to experience an earnings decline earlier in their careers. The chart below shows earnings trajectories over time, segmented by lifetime earnings percentiles:
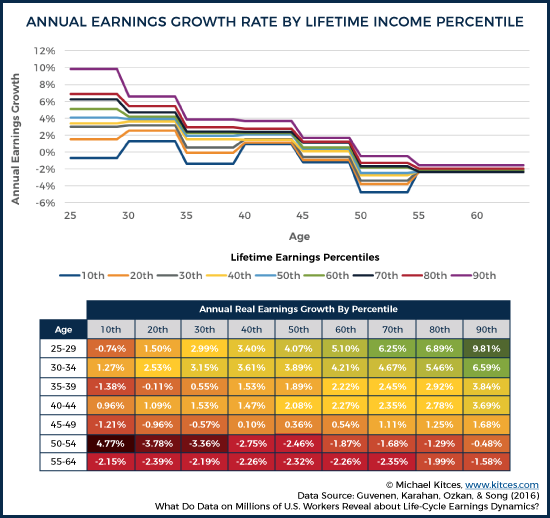
Viewed another way, the chart below shows how earnings growth rates tend to vary in 5-year intervals throughout the working career. Notably, virtually all earners experience slowing earnings growth throughout their careers, though high-earners tend to maintain above-average earnings growth throughout, while the lower end of the earnings spectrum is most likely to spend extended periods of time with not just slower, but negative real earnings growth.
As the chart reveals, as lifetime earnings percentiles increase, earnings curves get steeper. Of course, the numbers above are all in percentage terms and someone in the 90th percentile of lifetime earnings is likely starting off earning more than someone in the 10th percentile, but nonetheless, there are clearly meaningful deviations from the typical assumption of constant real earnings growth across most income profiles. Further, the fact that deviations from constant real earnings growth are largest for people at or above the 90th percentile is particularly relevant for financial advisors, given that this segment of the population is the segment targeted and serviced by many advisors who work with clients outside of a purely transactional basis.
Safe Savings Rates With Real-World Wage Earnings Growth
One of the key issues to recognize given that wages have different growth profiles at different career stages is that the typical advice to save a certain percentage of your income for retirement may be substantially impacted by that career stage. Those who are still early in their careers – and who face substantial income increases in the future – may have to save even more than they realize, just to keep up with their rising standard of living as the raises and promotions come. On the other hand, those who start saving later in their career may actually find it relatively easier to save and make up for their late start, because, if wages aren’t increasing as much in their later career stages, then their lifestyle and the standard of living that must be replaced by retirement assets won’t be growing as much either.
In order to evaluate the material impact of assuming more realistic earnings curves instead of “constant inflation-adjusted earnings growth, this article utilizes a modified version of the model used by Wade Pfau in his 2011 article, Safe Savings Rates: A New Approach to Retirement Planning over the Life Cycle.
The safe savings rate approach developed by Pfau aims to assess the percentage of pre-retirement income that a prospective retiree must save in order to accumulate enough retirement assets to sustain their pre-retirement lifestyle in retirement. Unlike the “traditional” approach of simply targeting the necessary savings rate to achieve a certain target retirement nest egg, Pfau’s approach analyzes the sustainability of the savings rate over the entire pre-retirement and retirement phase, recognizing that evaluating both in sequence actually produces more stable safe savings rate results (as bull markets leading up to retirement increase the likelihood of bear markets early in retirement, and vice versa).
To give an example of this, assume John earns $100,000 per year and was aiming for an accumulation target of 12.5 times his annual earnings (to produce half his retirement income at a 4% safe withdrawal rate, with the other half funded by Social Security). Further, assume that John has currently saved $1,000,000 for retirement. If the market goes up 25% over the next 12-months, the accumulation target method of determining retirement preparedness would indicate that John’s $1,250,000 is sufficient for reaching his 12.5x accumulation target. However, if the final 12-months of John’s career experienced a 25% decline instead, John’s then-$750,000 portfolio would only be 60% of what he needed in order to retire.
This drastic swing is illustrative of the “Starting Point Paradox”, but does John’s true retirement preparedness really fluctuate from 60%-100% based on short-term volatility? Of course, retirement date risk and sequence of return risk are real and do have some impact, but as Pfau’s analysis illustrated, the swing in preparedness isn’t truly as dramatic as short-term volatility would suggest. The key reason being that historically the worst periods leading up to retirement have been followed by some strong periods at the beginning of retirement, and vice versa. In other words, the big pre-retirement run-up means a greater risk that markets become overvalued and lead to a poor early sequence (necessitating higher savings), while the pre-retirement decline means an increased likelihood of favorable returns in early retirement (reducing required savings). Thus, focusing on both accumulation and the subsequent decumulation over rolling time periods reduces some of the dramatic swings in preparedness implied by simply looking at accumulation targets alone.
For the purposes of this analysis, rolling time periods as long as 70-years are utilized to examine safe savings rates needed to fund retirement (40-years of saving and 30-years in retirement). Additionally, a portfolio of 60% stocks and 40% short-term fixed income is assumed to be rebalanced annually, taxes are ignored, and an individual is assumed to maintain a steady standard of living by withdrawing an inflation-adjusted 100% their pre-retirement spending (pre-retirement income minus pre-retirement savings).
Based on these assumptions, the safe savings rate required in order to successfully fund retirement going back through 1871 is 15.36% if earnings are simply assumed to increase annually with inflation. This number is much higher than the 8.77% 40-year safe savings rate found by Pfau (2011), but the difference is primarily due to the fact that Pfau only assumed the retiree needs a 50% replacement ratio (with Social Security covering the other half), rather than the 100% replacement ratio assumed here.
Safe Savings Rates With Differing Earnings Curves
In order to isolate the effect of assuming a different growth rate on earnings, the next set of analyses utilized the same assumptions as above, with the exception of examining different safe savings rates based on earnings curves ranging from the 10th to 90th percentile of lifetime earnings.
Based on the findings of Guvenen et al., (which were reported as earnings growth over 5-year periods, which is annualized for the purposes of this analysis) annual real earnings changes were determined by lifetime earnings percentiles. Because Guvenen et al., (2016) only included earnings changes through age 60, in order to reflect the decline in earnings at the end of one’s career yet not overstate that decline in earnings (as that could understate retirement spending need), the decline seen from 55 to 60 was stretched out over 55 to 65 instead.
Based on these different earnings growth profiles, the chart below indicates the differences in safe savings rates across various earnings percentiles compared to a “baseline” of constant real earnings growth (i.e., an annual cost of living adjustment):

As the results show, the Safe Savings Rate for the baseline scenario is 15.4%, representing the required savings rate over the first 40 years of the 70-year accumulation-plus-decumulation time horizon, in the worst possible market sequence. By contrast, the most favorable return sequence would have allowed a savings rate as low as 10.6%, and 50% of the time retirement would have “worked” with a 13.1% savings rate.
By contrast, once safe savings rates are assessed across the entire range of earnings growth profiles, a different outcome emerges. In fact, for an individual with a 40-year savings horizon, the assumption of constant real earnings growth overstates the safe savings rate (SSR) that would have been needed to sustain oneself for all but the top 20% of earners! Additionally, the historical SSRs at the lower end of the spectrum are overstated even further here, given that a pre-retirement spending replacement rate of 100% was assumed, but realistically most workers – especially those below the 50th earnings growth percentile – will likely rely on Social Security for a substantial portion of their retirement income (and thus not need to save nearly as much in the first place, as discussed further below).
On the other hand, using an assumption of constant real earnings growth understates the SSR for individuals at the 80th percentile and above. This is particularly notable for financial advisors, given that individuals above the 80th percentile likely make up the vast majority of clients working with financial advisors outside of purely transactional business models. At the 90th income percentile, the safe savings rate rises from 15.4% to 18.4%, due primarily to the fact that the earner must save more of their income to keep up with the “lifestyle creep” that occurs as their big early raises lift the cost of the lifestyle that must be replaced later in retirement. In other words, if your income is going to rise more than 150% above inflation in the next 30-40 years, you need to save a lot of income throughout in order to keep up with the rising standard of living those raises entail.
It’s also worth noting that these scenarios actually vary significantly with regards to the amount of retirement spending they provide. For instance, if we assume an individual began their career in 1940 and saved a constant 15% of their income over a 40-year career, an individual who experienced a 50th percentile earnings curve would have actually begun retirement with 28% higher retirement income and a portfolio that was 40% larger than an individual who was assumed to have received only inflation-adjustments to their earnings growth. In other words, each individual in this analysis is assumed the save the percentage they need to replace their income given their income growth, but the levels of spending in retirement may be very different based on the actual income growth experienced.
Or, to look at this another way, at the final age analyzed in the Guvenen et al. analysis (age 60), individuals at their respective lifetime earnings percentiles were earning the following amounts (which, after adjusting for savings, represents the assumed retirement lifestyle that the worker was saving towards as well):
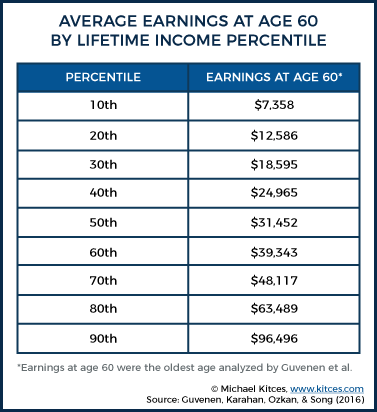
(Note: These numbers aren’t indicative of the actual spending levels under any particular scenario analyzed, given that actual inflation experienced—which varies in both magnitude and sequence across different scenarios—will result in different terminal levels of nominal spending in future dollars. It is also important to note that these are earnings levels for individuals at various lifetime earning percentiles, which is different than earnings percentiles in any given year. In other words, the level of earnings for someone earning at the 90th percentile over their lifetime is not the same as what the 90th percentile earner makes in a given year.)
Safe Savings Rates For Those Who Start Saving “Late”
Of course, these assumptions all assume that an individual begins saving at age 25 and saves consistently throughout their career. Unfortunately, that’s simply not what many people actually do. So, if we keep all of the prior assumptions consistent but assume an individual will start saving at age 35 and 45 respectively, the safe savings rates results are as follows (assuming age-based earnings growth based on the actual later starting age):
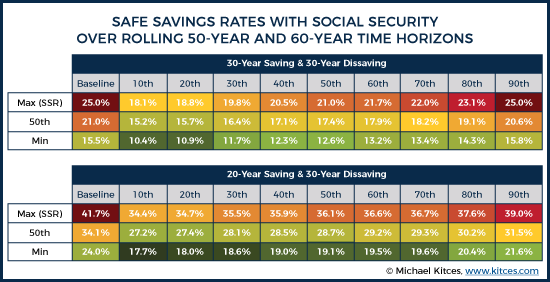
Not surprisingly, starting to save later requires prospective retirees to save more. While the baseline safe savings rate was only 15.4% when starting at age 25 (with a 40-year time horizon to work and save), it’s 25.0% when starting at age 35, and a whopping 41.7% when starting at age 45. The good news about starting later is that earnings rise more slowly, which means lifestyle rises more slowly and reduces the amount of money needed to retire. The bad news is that it’s harder to come up with those savings when earnings aren’t growing as much (or at all).
Nonetheless, it’s notable that the typical assumption of constant inflation-adjusted earnings growth still actually overstates the safe savings rate for all retirees who start by age 35 or later. The reason, again, is that because the bulk of income increases come in the first decade of work, those who don’t start saving until ages 35 or 45 (and thus face smaller income increases in the future), actually aren’t as likely to have their lifestyles escalate further. In other words, constant inflation-adjusted earnings growth actually overstates the typical earnings growth of those who start saving by their mid-30s and later, especially since the later working years (when real earnings actually decline) are now a larger percentage of the remaining savings years.
In addition, while the safe savings rates are much higher for those who start at age 35 or 45, it’s important to recognize how much their income (and their implied spending) would have already increased in the preceding years. While the 35-year-old’s safe savings rate lifts from 15.4% to 25.0%, their income (in real, inflation-adjusted terms) itself would have risen by 47% at the 50th percentile (and by as much as 120% at the 90th percentile). Which means if the 35-year-old had simply managed to not allow their lifestyle to creep up by as much as their wages increased, the 25.0% savings rate might actually be quite achievable! Similarly, the 45-year-old may need to save as much as almost 40% of income, but their income would have already risen by 80% from age 25 to 45 at the 50th percentile (and 223% at the 90th percentile!).
In essence, because earnings curves are steepest in the early years, the consequences of assuming constant real earnings versus more realistic earnings curves are not constant at all ages. The farther one is into their career (and thus the higher they’ve already climbed on their earnings curve), the more likely it is that an assumption of constant real earnings growth is actually overstating the historical SSR, as we saw in the scenarios above.
However, generally speaking, we can say that SSRs generated based on assumptions of constant real earnings growth are most concerning for younger individuals who have more earnings growth left to experience. It’s these individuals who would be most likely to have their SSR understated by traditional assumptions. For older clients, where the general trend may actually be declining earning, which drives down retirement spending needs as well, the risk is that traditional assumptions will suggest saving too much. While saving too much can be a problem as well, it is arguably far less problematic than not saving enough, and the “bad news” for a client who successfully saves too much may simply be that they can retire earlier than they thought!
Safe Savings Rates With Social Security Income
The safe savings rates above all assume the prospective retiree will have no Social Security income. However, for most Americans, we know that Social Security plays a crucial role in funding retirement.
To explore the impact that future Social Security benefits would have on safe savings rates, we can calculate Primary Insurance Amounts (PIAs) based on hypothetical earnings throughout one’s career (using the age-60 income and earnings curves at various percentiles noted earlier). Using historical earnings curves (based on the Guvener et. al. study), and the Social Security bend points to calculate PIAs, we can then re-calculate the necessary retirement savings to sustain the saver’s lifestyle in retirement after accounting for how much of that income will have already been replaced by Social Security benefits.
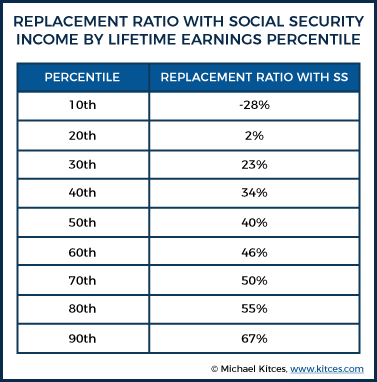
As shown in the chart above, Social Security benefits play an important role at all levels of income evaluated here, but the effects at the lower end of the income spectrum are particularly large. In fact, given that earnings at the lower end of the spectrum tend to peak early and decline in the later years of retirement, Social Security benefits would actually provide more than enough to sustain the individual’s entire lifestyle in retirement (as his/her earnings and therefore lifestyle at the retirement transition would already be well below his/her average inflation-adjusted earnings during the working years). Notably, this means that at the bottom end of the income spectrum, Social Security is sufficient to eliminate any need to actually save for retirement at all (at least for those maintaining a lifestyle at those income levels)! And even by the 70th percentile, Social Security benefits are still enough to cut the requisite replacement rate (and therefore the required amount of retirement savings) by half!
Accordingly, if we re-evaluate safe savings rates while considering the reduced replacement rates needed after accounting for Social Security benefits, we find the following safe savings rates based on the historical returns:

Without accounting for Social Security benefits, SSRs for those in the 10th to 50th percentiles ranged from 10.4% to 13.9%. However, given the disproportionate role that Social Security plays for lower income earners, these SSRs drop to 0.0% to 6.1% once accounting for the impact of Social Security given hypothetical replacement rates customized based on lifetime earnings percentiles. And even for those up to the 80th earnings percentile, the requisite safe savings rate is still less than 10%, owing again to a combination of the positive impact of Social Security benefits, and the fact that earnings (and lifestyle) would already be facing a decline in the final years leading up to retirement (which means it takes less saving to sustain that lifestyle).
While it is important to caution that replacement rates here are based on particular assumptions which may not represent any given individual or household’s situation, these findings have some interesting implications for the so-called “irrationally” low savings rates of many Americans. Notably, the drop in the 90th percentile SSR was not as large (18.4% to 13.1%) and there are likely many Americans who truly aren’t saving enough across all income levels, but it may also be the case that personal savings rates of 5% or lower are not as irrational as is often assumed. As the chart shows, a personal savings rate of 10% or less may have been historically sufficient for a whopping 80% of households!
Not surprisingly, Social Security again has a significant impact on SSRs towards the bottom end of the income spectrum among those who start saving for retirement later – slashing 20-year SSRs from 36.1% at the 50th percentile of lifetime earnings to only 18.5%, while also reaffirming the finding of “safe” near-zero savings rates for many low-income earners.
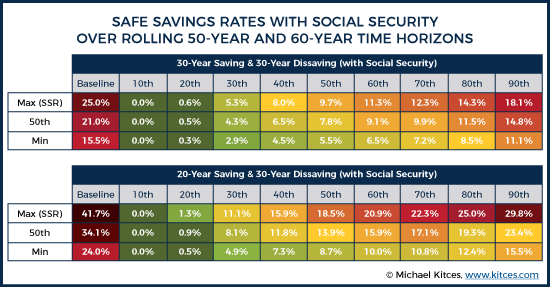
Notably, under the 30-year saving scenario, it is only those above the 50th percentile which experience SSRs that exceed 10%. In other words, based on the assumptions used in this analysis, saving 10% of income from ages 35 to 65 would still have been sufficient for those below the 50th percentile of earners.
Under a 20-year saving time period, SSRs do increase significantly, though notably, they are actually in realistic ranges (i.e., not 30% and greater) at almost all income levels, suggesting that individuals who find themselves in a situation where they don’t begin saving until their mid-40s don’t need to feel that prudently saving for retirement is an unattainable goal. Especially given the potential to free up a substantial amount of spending to begin saving in the empty nest phase, once the financial obligations to raise children and send them to college have passed.
Further Considerations On Safe Savings Rates And Earnings Growth
There are many adjustments to this model which could be made for the purposes of making this analysis even more realistic. For instance, savings rates themselves could be permitted to differ in a manner that would more realistically smooth consumption. For instance, it certainly makes sense that savings rates may increase as earnings increase. Further, lifestyle factors, such as the cost of raising children, create additional expenses which may impair savings ability at different stages of life. Additionally, asset allocations could be varied across the life cycle, more realistic declining spending paths in retirement could be utilized, and life expectancies could be adjusted based on income percentiles. In fact, Blanchett, Finke & Pfau (2017) presented an interesting simulation model in the March edition of the Journal of Financial Planning that evaluates many of these factors.
Yet, it’s also important to note that these more “realistic” methods of conducting analyses are rarely used by advisors today. Instead, rather than even projecting some type of earnings growth, advisors more commonly project some level of savings (typically in dollars) and assume that this dollar amount of savings either remains constant or is adjusted with inflation. For instance, a prospective retiree may be assumed to save $5,000/year in their 401(k) plan every year with an annual adjustment for inflation. And while this assumption may seem relatively innocent, the reality is, for many individuals advisors typically work with, this assumption will likely understate the savings rates needed for younger clients (whose income growth may far outpace their steady retirement dollar savings) and possibly overstate savings rates needed for older clients (whose income and lifestyle may no longer be rising at all).
Even worse, for advisors who aren’t pegging savings rates to some overall level of income, the natural arc of earnings curves may be exacerbating the understatement or overstatement based on the assumption of constant real earnings growth. For instance, suppose an advisor recommends that a client making $45,000 in their 20’s contribute the maximum of $5,500 to their IRA. Perhaps that rate is initially appropriate given the client’s goals, but if their IRA maximum is only increasing by inflation while their real earnings growth is much higher, this client’s savings rate may have roughly halved by the time their income grows to $100,000 with future promotions (above and beyond just annual COLA increases). Which means, not only would an initial projection have undershot the true savings needed in the first place, but failing to monitor the earnings curve on an ongoing basis is moving the plan further off course. Given how easy it is for most people to experience lifestyle inflation that eats up income growth, a client may find themselves 5- or 10-years down the road significantly off track from their goal, and feeling like the only options they have to get back on track are to make some very painful cuts to their lifestyle.
Conversely, an older client who continues to maximize their 401(k) contribution even though their real income is falling may be saving excessively. And while “over saving” may seem like a trivial problem, these clients may be foregoing important life goals because they think they have to work and save at their current level, which may not be the case.
Ultimately, there is an inherent trade-off between more accurate and more practical planning. The marginal benefit of providing more “realistic” plans will not always exceed the marginal cost, but if advisors (or the software they use!) choose to use simplifying assumptions, it’s important to understand how those assumptions influence the actual recommendations generated. Especially given that the assumption of constant real earnings growth can so drastically misstate the earnings trajectory of both younger workers and those nearing retirement!
So what do you think? Is it time to stop simply assuming that earnings increase with inflation, and instead, account for more real-world earnings growth trajectories over time? How else would you adjust your planning recommendations for clients? Please share your thoughts in the comments below!


Great work on the data. You also have good observations in that high growth earners may under save, some older clients may continue to save when they do not need too, and some high growth earners become “hooked” on consumption and believe they have done their savings job if they max out what the government allows.
Job one, from my perspective, is getting clients to save and truly enjoy rational spending. I do not have extensive financial planning experience, but I have significant years in the battle as a tax CPA. The money from the early high income growth years is often consumed for housing, children and family priorities. Establishing any meaningful savings for education and retirement during this time is success. The practical problem I see with late starters in retirement accumulation is that they have a lifetime consumption habit to overcome and these clients are often fall short saving to goal.
Helping clients stay on or get on the higher earnings curves is where we can add real alpha, and produce a win-win for everyone. However, like athletic or academic performance, we cannot put in what nature left out …
I agree with the practical problems you see with late starters — particularly given that they may be experiencing negative real earnings growth. Unless they have some expenses falling off that don’t truly impact their lifestyle (e.g., education expenses for children), trying to save on top of existing downward pressure on real consumption may be quite a challenge. I do believe having a savings policy (e.g., save X% of every raise…similar to what’s outlined here: https://www.kitces.com/blog/retirement-savings-needs-big-savers-avoid-lifestyle-creep-to-retire-early/) can be helpful as long as someone is experiencing at least nominal income growth, but increasing savings is particularly difficult when both nominal and real earnings are declining.