Executive Summary
Many investors are familiar with private equity as an alternative asset class, which is popular with certain high-net-worth and institutional investors as a vehicle for diversification and a source of potentially higher risk-adjusted returns than what is available on the public market. However, less well-known is the related but distinct asset class of private debt, which, like private equity, focuses on opportunities outside of what is traded on the public market but deploys its capital in the form of credit rather than taking equity stakes in companies. And in the midst of a rough market for publicly traded debt, high-net-worth individuals (and their advisors) who might be seeking alternatives for the fixed-income portions of their portfolio may be curious about what private debt might have to offer.
While public market and private equity asset classes are much more thoroughly researched, research on private debt providing reliable data on returns, volatility, fees, and other characteristics has been relatively scarce. However, a recent paper by Pascal Böni and Sophie Manigart in the Financial Analysts Journal sheds new light on how private debt has performed over time and provides insight into what factors advisors and their clients should focus on when considering private debt for their portfolios.
One of the paper’s key takeaways is that although private debt as an asset class has delivered higher risk-adjusted returns compared to traditional fixed-income investments, there is a wide range of outcomes between individual private debt funds, with a relatively small cluster of top-performing funds delivering much of the asset class’s overall outperformance. And while the maxim “past performance does not indicate future results” holds true for traditional asset classes, the reverse has proven at least somewhat true for private debt: Among private debt funds and the General Partner who manages them, prior performance was a significant indicator of future performance, with funds having a good performance history being the most likely to outperform in the future. Funds with GPs who had no history of prior private debt fund management had some of the worst performance, suggesting that not only do past returns but also the skills and experience of General Partners have much to do with which private debt funds are likely to have the best returns.
For advisors, examining the management and culture of a private debt fund can be an important way to provide value to clients through a thorough due diligence process. This can include assessing the experience and performance history of the fund’s GP and how the fund has achieved its returns (e.g., by making concentrated bets or through a more diversified approach). And while the choice of a fund may be the most significant decision regarding private debt, advisors can add value in other ways as well, such as by incorporating private debt into a client’s existing asset allocation strategy, optimizing the asset location of a private debt fund, and analyzing the fund’s fee structure.
Ultimately, what’s most important is that clients have a solid understanding of the risks involved with investing in private debt versus remaining in the public markets. Namely, the illiquidity of private funds (which can keep clients’ funds locked up for 10 years or more) makes them most appropriate for clients with a long-term investing horizon and with other liquid funds for short-term and unexpected needs. Advisors who can help their clients navigate these important considerations, and keep the client’s focus on the long term, can be an invaluable aid in ensuring those clients can realize the potential advantages that private debt can make possible!
Private debt funds have been playing an increasingly important role in providing capital to businesses, as the Great Recession triggered the tightening of banking regulations. That made loans to small to middle market companies unattractive for banks, shutting out most of them from the bank lending market (and they were too small to access the public bond market). In addition, the 2010 enactment of the Dodd-Frank Act made it increasingly expensive for small banks to operate, cutting off their supply of loans to small and mid-size companies. Spurred by demand from yield-seeking institutional investors challenged by the low-yield environment in traditional credit markets created by the Federal Reserve’s easy monetary policy, private debt funds stepped in to fill the gap.
Despite its large and increasing size in the U.S. and Europe, there is relatively little research on the private debt market. Preqin, the foremost provider of data for the alternative asset community, estimated that at the end of 2021, private credit had about $850 billion in assets, behind the $4.4 trillion invested in private equity.
To help fill that gap, Pascal Böni and Sophie Manigart, authors of the study Private Debt Fund Returns, Persistence, and Market Conditions published in the Financial Analysts Journal, examined net-of-fees returns of closed-end private-debt funds (investors cannot withdraw funds until the fund is liquidated, typically 8 to 10 years after inception), performance persistence across private debt funds managed by the same General Partner (GP), and a GP’s ability to time the private debt market.
The Role Of General Partners In Private Debt Funds
General Partners (GPs) of private debt funds select attractive credit opportunities, negotiate lending contracts, manage their execution, actively monitor investments (sometimes combined with the execution of advisory roles at the management or board level of the borrower) and the renegotiation of lending agreements in case of covenant breaches, and manage the execution of credit workouts and the realization of secondary market transactions.
For its services, the GP receives a management fee, typically in the range of 1.5% to 2%, and usually also a success fee in the amount of 15% to 20%, the latter paid at the end of the lifetime of a fund and calculated on a return exceeding a preferred return to the passive Limited Partners (LPs) – typically around 6% to 8% per annum. In a January 2022 fee survey of investment management services for middle market corporate lending covering 49 of the largest direct lending firms managing $541 billion in direct lending assets, Cliffwater found that total fees for private partnerships averaged 3.14%.
Example: You-Need-We-Lend (YNWL) is a private debt fund that charges a 1.5% annual management fee coupled with a 20% performance fee above a preferred return of 8% per year.
YNWL ultimately collects and invests $1 billion of private investor assets into private debt offerings, on which it receives its 1.5% per year management fee. Each year the fund’s performance is measured against the preferred return.
If, in year 1, the fund turns in a strong performance of 11.0% after its management fee, the YNWL would be entitled to its performance fee of 20% × 11% = 2.2%, leaving investors with a return of 11% − 2.2% = 8.8%.
If, in year 2, the fund earns 9% after its management expense, the fund would be entitled to a performance fee. However, because 20% × 9% = 1.8%, and a 1.8% performance fee would reduce the investor return to below the preferred return of 8% (i.e., 9.0% − 1.8% = 7.2%), YNWL will only receive a performance fee of 1% for a total expense to investors that year of 2.5%.
In any year YNWL earns less than the preferred return, YNWL will only receive its management fee.
Note that this is just an example. However, with most private partnership incentive fee structures, the preferred return is a running-since-inception calculation. The result is that, technically, funds can still pay incentive fees if a calendar year return is below the preferred return as long as the since-inception return to the limited partners is above the preferred return. With that being said, there are many exceptions and funds with terms that are more favorable to investors.
Alternatively, if YNWL generated a return of only 6% per year net of its fees, its GP payment would simply be its ongoing management fee of 1.5% per year, as the fund did not exceed its preferred return target of 8% to provide any additional success-fee payments to its GP.
Böni and Manigart collected data on 448 Private Debt (PD) funds managed by 94 GPs, with vintage years 1996 to 2018 and with cash flow data through 2020, and calculated PD funds’ net-of-fees Internal Rates of Return (IRR) and net multiples. They also calculated the excess return of the funds compared to public benchmarks using the Public Market Equivalent (PME) method (the present value of distributions scaled by the present value of contributions, with the discount rate being the realized market return given by the benchmark index). A fund with a PME greater than 1 outperformed the benchmark index over its lifetime, with the PME adjusted for risks spanned by the benchmark return.
Before reviewing their findings, it is important to understand that the typical private fund that relies on capital calls has to report its returns since inception as an Internal Rate of Return (IRR), as the reality is that not all of its capital is fully invested on day 1 (instead, capital calls to investors to contribute are made when the fund has a private debt offering ready to make an investment into). IRRs are dollar-weighted returns and are accepted as an appropriate way of calculating returns that are subject to variable cash flows that are controlled by the GP.
However, the simple IRR calculation assumes that distributed capital is reinvested at the IRR that equalizes the capital outlays with the present value of future cash flows. As Cliffwater's research highlights, a more appropriate measure for most individual investors is the Modified IRR (MIRR), which does not assume that distributed capital is reinvested at the constant IRR discount rate. Instead, it uses both a cost of capital and reinvestment rate to calculate a blended or Modified IRR, accounting for the rate of return that the private debt fund is generating and also for the rate of return of the capital that sits uncalled or distributed.
This is more methodologically correct and representative of a drawdown fund’s ‘true’ IRR. It also better highlights funds that get their capital deployed faster (and the impact of fees when charged on committed capital instead of just invested capital).
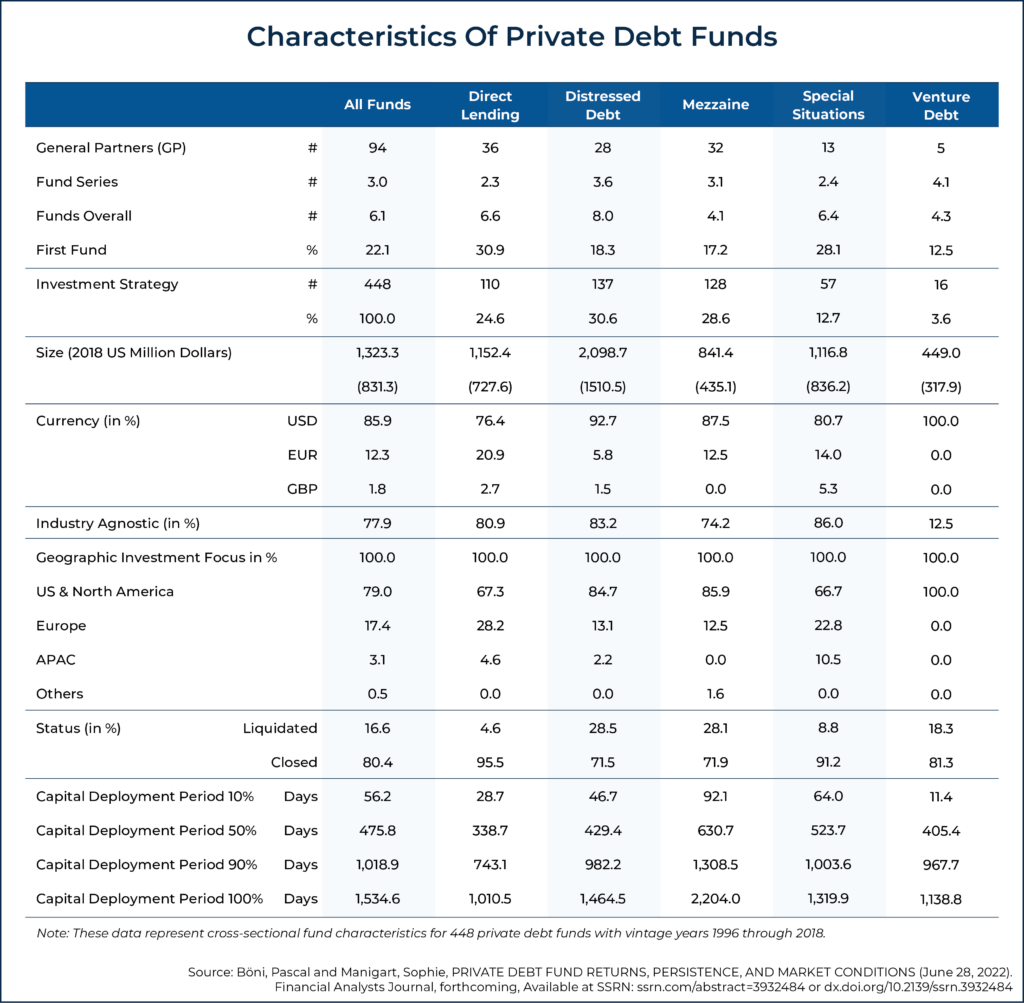
The table below provides a summary of the characteristics of the Private Debt (PD) funds in the Böni and Manigart research sample. Take note of capital drawdown periods in particular (how many days – often amounting to several years – it takes to fully deploy the investor’s capital into private debt in the first place).
Following is a summary of Böni and Manigart’s findings:
- The mean size of a PD fund (in 2018 U.S. dollars) was $1.3 billion.
- The most prevalent investment strategies were investing in direct lending (24.6%), distressed debt (30.6%), and mezzanine debt (28.6%), followed by special situations (12.7%) and venture debt (3.6%).
- The average PD fund needed 56 days to deploy 10% of its capital, 476 days to deploy 50%, 1,019 days to deploy 90%, and 1,535 days (or slightly more than 4 years) to be fully invested. Across funds, mezzanine PD funds were the slowest to invest, and direct lending PD funds were the fastest.
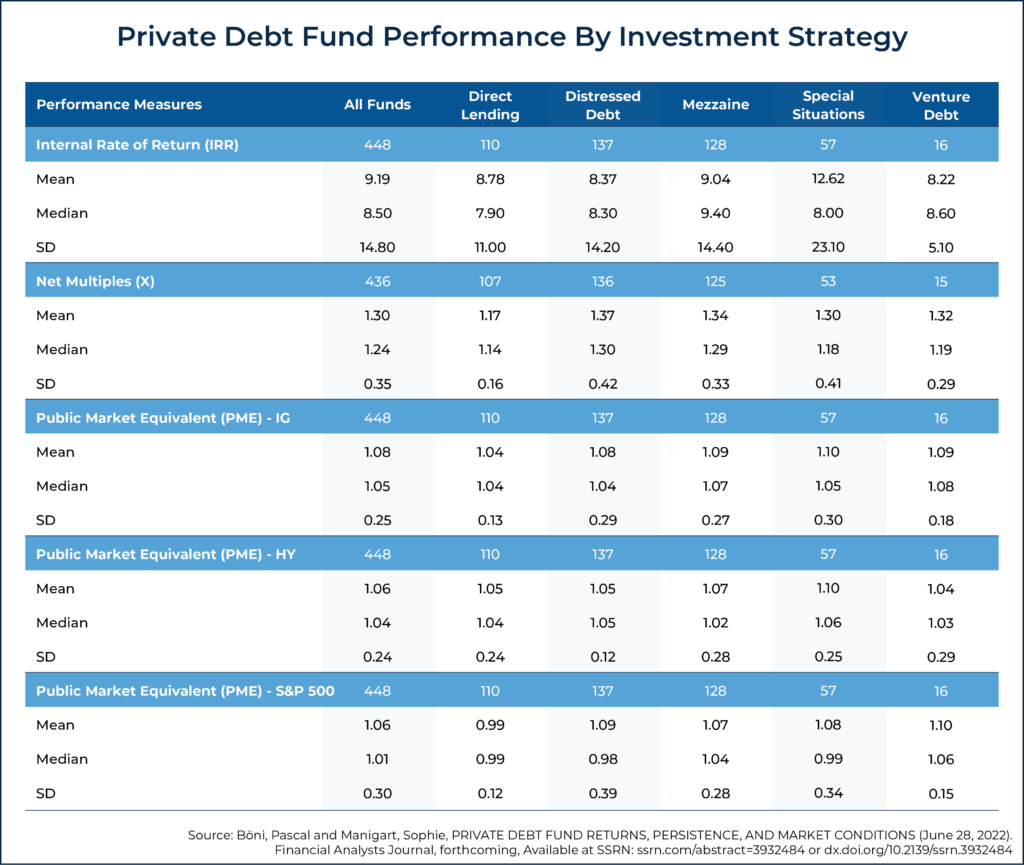
- The average PD fund returned 9.19% net-of-fees IRR to LPs. However, there was a large dispersion between top quartile funds (with an IRR of 23.3%) as compared to the bottom quartile funds (with an IRR of -3.6%). Similarly, on a net-investment-multiple basis, PD funds achieved a net investment multiple of 1.3 in the cross-section, again with large performance dispersion between top quartile funds (1.76×) and bottom quartile funds (0.98×).
- PD funds outperformed the Investment Grade (IG) bond market benchmark (PME of 1.08), the High Yield (HY) bond market benchmark (PME of 1.06), and even the S&P 500 equity market benchmark (PME of 1.06). Though, once again, the dispersion was broad; against these same benchmarks, top quartile funds achieved market outperformance of 38%, 33%, and 42%, respectively, while bottom quartile funds underperformed the market by -18%, -19%, and -21%.
- The mean IRR was highest for special situations (12.6%) and lowest for venture debt (8.2%). However, the returns to special situations were highly skewed, with a few funds providing very high returns. Distressed debt had the highest performance in terms of net multiples (mean of 1.37), and direct lending had the lowest (mean of 1.17). However, the dispersion of the direct lending fund PMEs, as measured by standard deviation, was lowest for all benchmarks, potentially compensating the risk-averse investor for the lower PME against some of the other strategies.
- For mature PD funds, the GP’s prior fund performance was a significant (at the 1% confidence level) and economically important predictor of its future fund performance: A 1 standard deviation increase in IRR (net multiple, PME IG, PME HY, PME S&P 500) of the previous fund increased the performance of the current fund by 3.42% (0.11×, 5.10%, 4.88%, 8.73%). Excluding PDs with only one fund (i.e., excluding GPs who typically did not have prior experience managing a PD fund) would have improved returns overall.
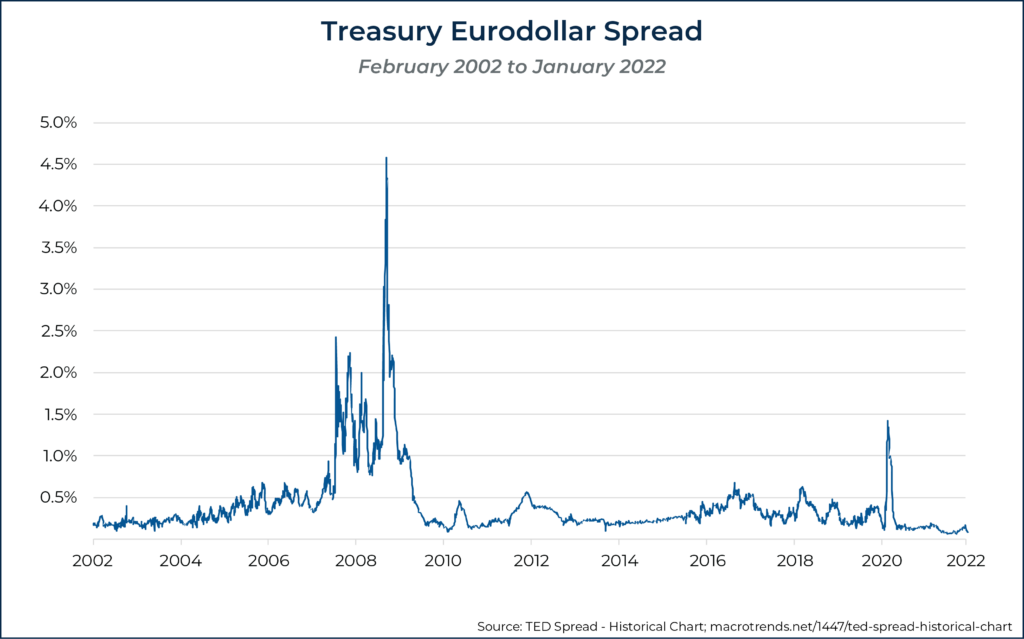
- A higher forecasted level of funding illiquidity, as proxied by the level of the Treasury-EuroDollar (TED) rate spread (the difference between the U.S. dollar 3-month LIBOR and the 3-month Treasury bill), significantly and negatively affected the outperformance of a PD fund against the IG and HY benchmarks. The TED spread widens in periods of economic crisis – the default risk widens as the higher the liquidity or solvency risk posed by one or more banks, the higher the rate lenders or investors will require on their loans to other banks compared to loans to the government. It is considered a measure of global systemic risk. And wider ex-ante TED spreads have tended to negatively impact PD fund performance, similar to how other segments of the corporate bond market are also adversely impacted when risk spreads widen during times of economic distress. On the contrary, a higher ex-ante level of credit-risk spreads and equity-market volatility was positively related to PD fund multiples and their outperformance against the IG or HY benchmark – wider credit spreads at the time of initial funding tended to enhance the performance of PD funds, as once risk was already priced into the market (in the form of higher credit spreads), PD funds tended to perform better than the default risk implied in those spreads.
In terms of finding evidence of timing skills, Böni and Manigart found mixed evidence:
On the one hand, PD funds that are initiated in periods with ex-post improvements in funding illiquidity (or a TED spread contraction) perform better. On the other hand, improvements in credit spreads affect fund performance negatively. Ex-post-changing equity-market volatility, as proxied by the VIX, does not impact PD fund returns or outperformance. The effect size of changes in ex-ante-funding illiquidity is approximately more than twice as large as that of performance persistence, while the effect of a change in ex-post funding illiquidity is about as important as past performance.
The implications of their findings are that liquidity conditions at the time of initial investment, as proxied by the TED spread, play an important role in future PD performance, with improving liquidity conditions tending to lead to enhanced PD performance. On the other hand, narrowing (widening) credit spreads negatively (positively) impact their performance as risk premiums decline (increase), and private debt funds have to invest their capital at successively lower interest rates. And these dynamics of funding illiquidity when the investment is made, and how they change during the lifetime of the fund, are as important predictors of returns as past performance.
The following chart shows the TED spread over the period from early February 2002 through early January 2022, when the publication of the TED spread was no longer published – with LIBOR being replaced by the Secured Overnight Funding Rate (SOFR). It suggests that the COVID crisis led to illiquidity risk spiking (a poor environment for PD funds), and liquidity conditions then dramatically improved (a favorable event for PD funds) and have remained relatively strong since then.
The following table shows the performance of PD funds in the data sample by investment strategy:
Summarizing their findings, Böni and Manigart found that PD performance was highest when credit spreads were wide, but TED spreads were contracting as funding liquidity improved; simply put, it has historically been beneficial to lend when markets are still fearful of lending after a major economic or illiquidity event.
Overall, however, private debt funds still had a strong average IRR of more than 9% and, on a risk-adjusted basis, tended to outperform corporate and high-yield bonds even after accounting for the private debt funds’ internal fees. Within the private debt category, ‘special situations’ funds had the highest returns but also the highest levels of risk, while venture debt tended to have the lowest return (and also lower risk), with the remaining (direct lending, distressed debt, and mezzanine debt) falling in between.
At the individual private debt fund level, Böni and Manigart did find evidence of skill, where the lagging performance of a GP’s existing funds significantly predicted current performance in all specifications at the 1% confidence level. For example, they found that funds in the top quartile had at least a 35% probability of remaining in those quartiles, while funds in the lowest quartile had at least a 39% probability of remaining in the lowest quartile.
Which suggests that the GPs of PD funds “have specific skills, allowing them to provide consistent performance over consecutive funds, and that outperformance is not solely due to luck.” In turn, this also means that investors should be especially cautious about investing in first-time funds where there is little prior experience to determine whether a skilled manager is at the helm.
Thanks to Cliffwater, an alternative investment advisor and fund manager, we have further evidence on the performance of private debt, including historical credit loss experience.
Historical Credit Loss Evidence
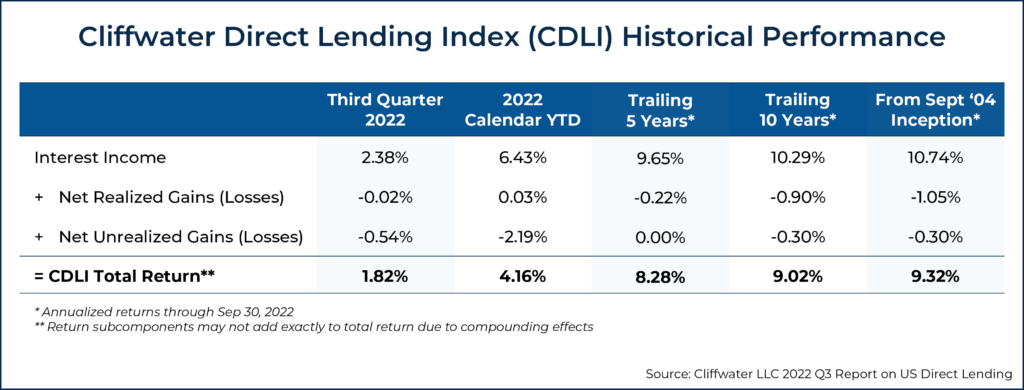
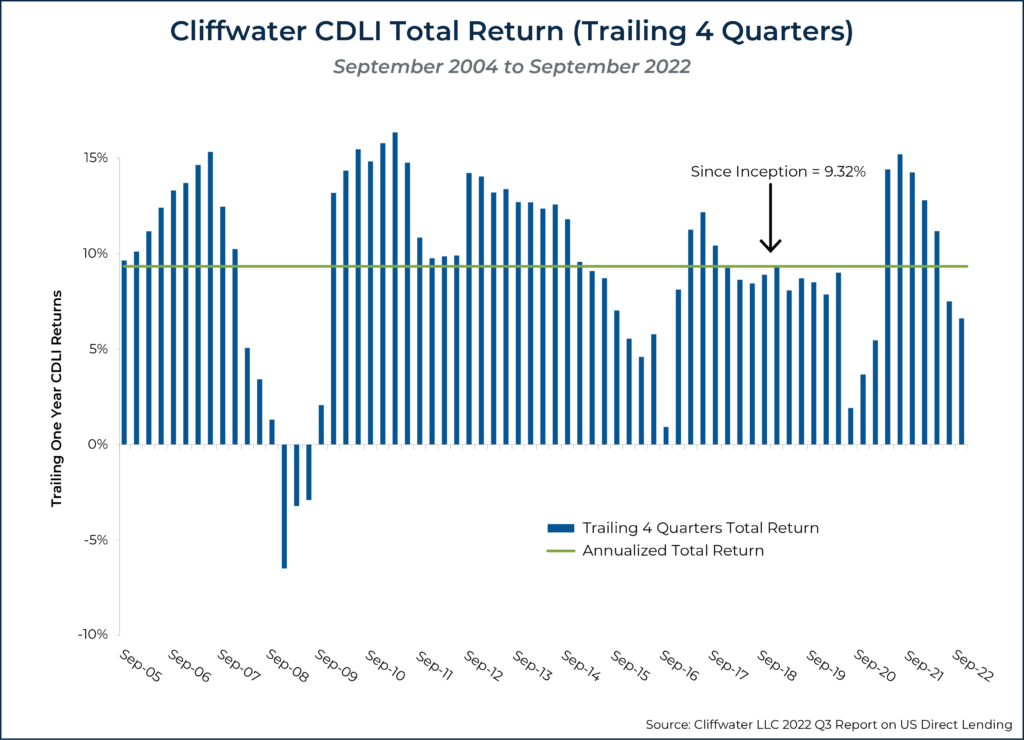
The Cliffwater Direct Lending Index (CDLI) is an asset-weighted index of more than 12,000 directly originated middle market loans totaling $260 billion as of September 2022. Using their data, we can further review the historical performance of private direct lending:
The following chart shows the returns over trailing 4 quarters since inception:
By way of comparison, over the period from September 2004 to September 2022, the CDLI returned 9.32%, the Bloomberg U.S. Aggregate Bond Index returned 2.93%, and the Bloomberg U.S. High-Yield Bond Index returned 5.20%. Note that these are all index returns and do not include fund implementation costs (just as with equity indices).
As reflected in the earlier research from Böni and Manigart, the Cliffwater data similarly shows that returns are highest in the immediate aftermath of adverse economic events (e.g., shortly after the financial crisis and the initial wave of the pandemic) when yields remain high but actual risk is declining; results are worst heading into such economically calamitous events when there is not only a risk in the fear of defaults but also an outright increase in actual defaults that result in credit losses.
Credit Losses In Private Debt Funds
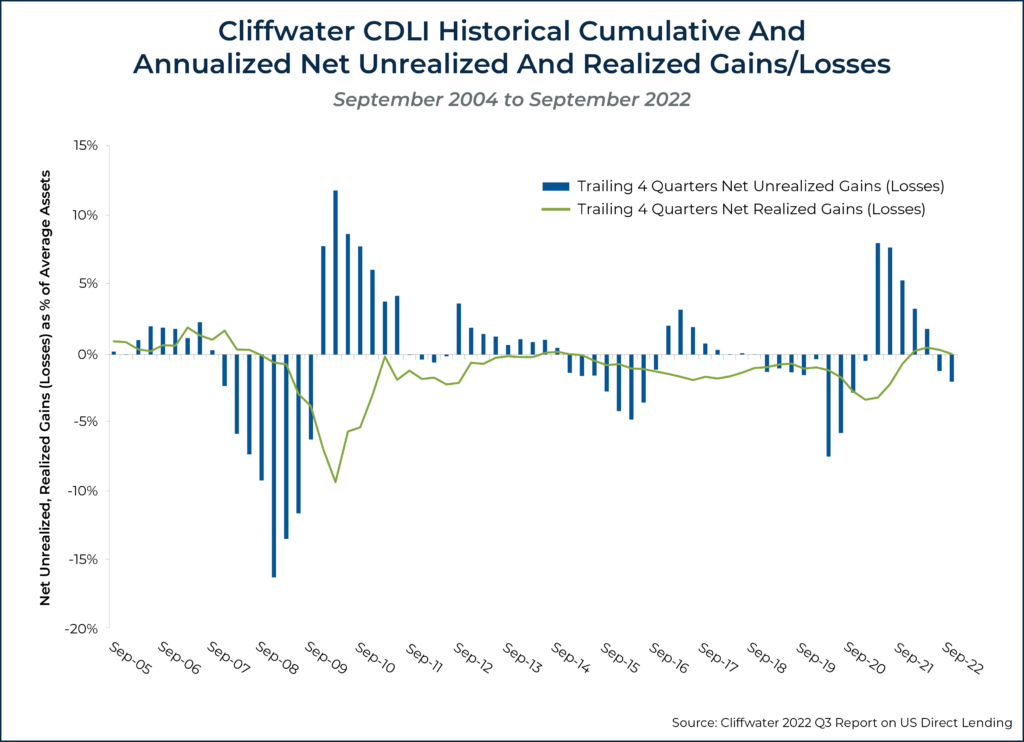
The following chart shows the historical cumulative and annualized net unrealized gains and losses for the Cliffwater CDLI since its inception in September 2004. An important observation related to unrealized losses and loan valuation is that unrealized loan write-downs in times of severe stress, like 2008 and 2020, have exceeded subsequent realized losses by more than twofold.
In other words, the mark-to-markets (unrealized but anticipated losses) turned out to be too conservative, and the full amount of the unrealized losses was never actually realized as subsequent default losses. In other words, if unrealized losses reflect expected future realized loan losses, then valuations had been conservative (high unrealized losses) relative to subsequently realized loan impairments.
That is exactly what is seen here. Note the pattern that (1) unrealized losses preceded (predicted) realized losses; (2) when those realized losses materialized, the prior unrealized losses were subsequently reversed by unrealized gains; and (3) unrealized losses overshot subsequent realized losses by between 25% and 50% for the periods represented by the GFC, oil crisis, and COVID:
We now turn to examine the performance of the CDLI-S, which includes only senior secured loans.
CDLI-S Performance
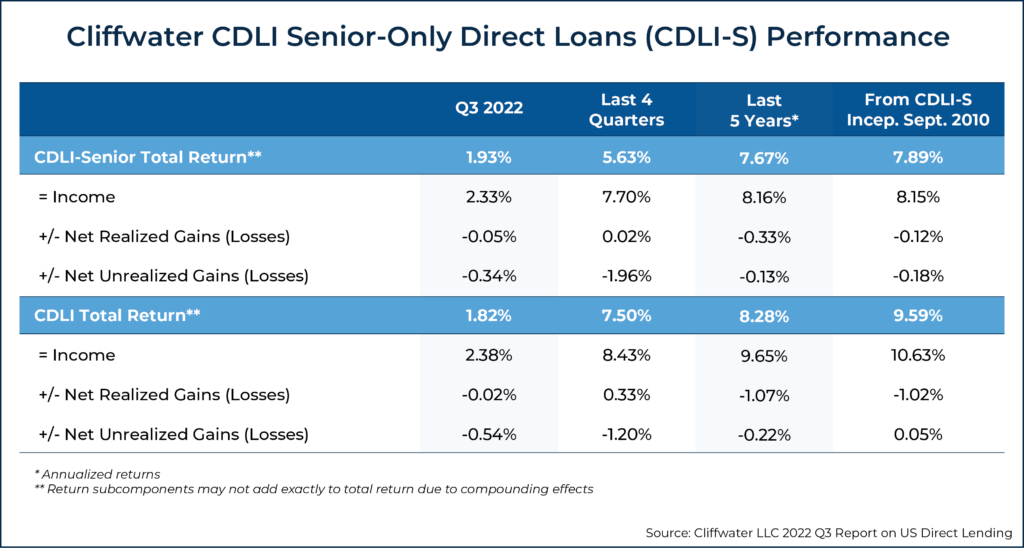
The inception date for Cliffwater’s CDLI-S was September 30, 2010 (compared to September 30, 2004, for CDLI), which is attributable to the post-2008 introduction of most senior-only direct lending business development company strategies.
The following tables compare the returns of the CDLI-S from inception through September 2022 to those of the broader CDLI. The lower returns were accompanied by lower volatility, as the standard deviation of returns for the CDLI‑S was 2.4 versus 3.0 for the broader CDLI. CDLI-S also incurred lower realized and unrealized losses. As one would expect, more senior debt proved to be a lower-risk/lower-return investment proposition.
Notably, over the same period from September 2010 to September 2022, while the CDLI-S returned 7.89% and the CDLI returned 9.59%, the Bloomberg U.S. Aggregate Bond Index returned just 1.60% and the Bloomberg U.S. High-Yield Bond Index B returned just 4.77%. The CDLI and CDLI-S indices produced significantly higher returns than the 2 credit indices and did so with lower levels of risk. As the volatility of CDLI and CDLI-S was just 2.9% and 2.4%, respectively, versus 3.7% and 7.3% for the 2 credit indices.
In other words, consistent with the Böni and Manigart research, these private debt offerings were both much more efficient in delivering risk-adjusted returns, producing higher Sharpe ratios (when measured on a no-cost index basis with Cliffwater data or on an after-fees basis via Böni and Manigart).
Advisor Takeaways For Private Debt Investing
Private debt can be an attractive asset class that provides current high-yield and inflation protection, and research and actual private-debt results show a strong risk/return profile relative to other more traditional forms of fixed-income investments like corporate investment-grade and high-yield bonds.
However, there are, as we have discussed, wide dispersions in outcomes, just as there are with actively managed equity funds. Thus, substantial due diligence is required into not only the historical performance but, most importantly, the culture of the fund’s management – with respect to its overall persistency and whether it has been persistently conservative or if it stretches for yield, and whether a fund with good results did well by making concentrated bets or by maintaining highly diversified portfolios (across not only companies but industries as well).
This domain of private-debt-fund due diligence is an area where a good advisor can add significant value.
Given the current attractive yields relative to public securities (for example, as of December 13, 2022, Cliffwater’s Corporate Lending Fund, CCLFX, which is an interval fund, was currently yielding about 9.5%, with an average maturity of about 2 months, while Vanguard’s High-Yield Corporate Fund, VWEAX, was yielding 7.6% with an average maturity of almost 6 years), those with the ability to invest at least some portion of the portfolio in illiquid investments (and a very large percentage of investors have that ability for at least some allocation of their portfolio, especially higher net worth investors) can take advantage of the large illiquidity premium available, without taking virtually any duration risk (thereby reducing term/inflation risk).
Private Debt In Asset Allocation
In terms of asset allocation, PD funds are bond funds, and thus the allocation should generally be taken from the bond side. However, if they are used as substitutes for riskless (from a credit perspective) bonds such as Treasuries or FDIC-insured CDs, then the investor needs to be aware that they are taking some incremental economic-cycle risk that correlates to equity risk (though the volatility is much lower than with equities). This incremental credit risk should be considered in the asset allocation decision-making process (perhaps by slightly reducing the equity allocation).
The most straightforward use case for private debt funds, though, is simply to insert them into the portfolio as an alternative to investment-grade or high-yield corporate debt given their similar risk profile to corporate default risk but alternative return profile (tending towards lower duration and higher credit quality but also greater illiquidity).
Asset Location For Private Debt
Because PD funds are tax inefficient (generating their returns as bond interest taxed as ordinary income and producing a high yield that results in a high amount of such taxable income), they are best held, at least for those in high tax brackets, in tax-advantaged (i.e., retirement) accounts.
Arguably, retirement accounts are also a good fit for private debt funds because such accounts are where illiquidity is not a significant issue for most investors, at least for those not in retirement yet, or those taking less than their Required Minimum Distributions (RMDs). For example, even at age 90, the RMD is not even 10%, and CCLFX, as a private-debt interval fund, is required to provide a quarterly distribution ability of a minimum of 5%; it also pays out interest.
Expenses For Private Debt Funds
As always, fees are important. And it is important to understand how they are charged.
The starting point is simply to understand the private debt fund’s management fee (i.e., what it charges). The greater complication, though, is how the fund’s management fee is calculated. For example, most PD funds use some leverage to enhance returns. Some of them will charge their expense ratio on the gross assets under management, including the leveraged assets.
On the other hand, funds like CCLFX charge their fee only on the net assets. To show the difference, CCLFX has a management fee of about 1.63%, including operating expenses. Assuming it uses 30% leverage, that means the fund can hold about $143 of assets for every $100 of investor capital. Thus, investors are paying $1.64 in fees on $143 of assets that are earning a return.
The result is that the expense ratio is about 1.15%. (Note that the return on leveraged assets is lower due to the cost of the borrowed funds.) For private debt funds that are structured for private investors, who may contribute over time (in the form of capital calls), it’s also important to understand whether the management fee will be calculated on committed capital or only on the actual invested capital.
In addition, as noted earlier, some funds charge a performance or success fee as well (though others do not.) When a success fee is involved, it’s important for advisors to understand both the amount of the success fee, the fund’s preferred return target that must be reached or exceeded for the manager to earn the success fee, and how exactly the fee is calculated.
Another important point is that when success fees are involved, fund managers have an additional incentive to take on more concentration or leverage risk (to amplify potential returns, increasing their likelihood of exceeding their success-fee threshold). As a result, due diligence for funds that charge success fees should include not only how the success fee itself is determined but also how the fund manages its concentration, leverage, and other risks in light of its compensation incentive and the associated conflict of interest.
Investment Choices For Private Debt Funds
For those advisors interested in considering an allocation to private debt, choices are available in both mutual fund or ETF format (e.g., as ‘liquid alts’) and in the form of private funds (structured as more typical private alternative investments). Interval fund options include the Blackrock Credit Strategies Fund (CREDX) and the aforementioned Cliffwater Corporate Lending Fund (CCLFX), while the largest ETF choice is Virtus Private Credit Strategy ETF (VPC).
For those advisors who prefer the use of private alternative fund vehicles, among the most respected providers that could be considered for performing due diligence (and their associated assets under management) are Ares Capital ($68B), Blue Owl ($57B), Twin Brook ($13B), Blackstone Private Credit Fund (BCRED), ($50B), Antares Capital ($45B) and Golub Capital ($42B).
For informational and educational purposes only and should not be construed as specific investment, accounting, legal, or tax advice. Certain information is based upon third-party data, which may become outdated or otherwise superseded at any time without notice. Indices are not available for direct investment. Their performance does not reflect the expenses associated with the management of an actual portfolio, nor do indices represent results of actual trading. Information from sources deemed reliable, but its accuracy cannot be guaranteed. Performance is historical and does not guarantee future results. Third-party information is deemed to be reliable, but its accuracy and completeness cannot be guaranteed. By clicking on any of the links above, you acknowledge that they are solely for your convenience and do not necessarily imply any affiliations, sponsorships, endorsements, or representations whatsoever by us regarding third-party websites. We are not responsible for the content, availability, or privacy policies of these sites and shall not be responsible or liable for any information, opinions, advice, products, or services available on or through them. The opinions expressed by featured authors are their own and may not accurately reflect those of Buckingham Strategic Wealth® or Buckingham Strategic Partners®, collectively Buckingham Wealth Partners. Neither the Securities and Exchange Commission (SEC) nor any other federal or state agency has approved, determined the accuracy, or confirmed the adequacy of this article. LSR-22-414




Leave a Reply