Executive Summary
In the early days of investing, stocks were often evaluated in a vacuum: Investors assessed the plusses and minuses of each company’s stock based on its own merits, with little consideration of the relationship between one stock’s performance and that of the market as a whole. Then, in the 1960s, with the advent of the Capital Asset Pricing Model (CAPM), investors began to look at stocks (and by extension, pooled investments like mutual funds as well as entire portfolios) through the lens of a stock’s risk compared to the entire market (and concurrently, the expected return that investors demanded to compensate for that risk). A stock’s ‘beta’ – generally speaking, its riskiness compared to the overall market – was considered a key driver of its future performance.
In the early 1990s, however, the release of a landmark study by Eugene Fama and Kenneth French introduced the concept of “factors” beyond beta that could influence a stock’s performance. Though Fama and French’s study focused on 2 factors (size and value), investment research in the subsequent 30 years has identified hundreds of additional factors that investors can use to adjust their return opportunities and expectations in constructing diversified portfolios.
Although the rise of factor-based investing has created many possibilities for advisors to add value by optimizing the risk and return profiles of their clients’ portfolios, the explosion in the number of potential factors creates its own new challenge for investors, from determining how to evaluate the factors themselves to deciding which ones are really useful in making investment decisions. As it turns out, when filtering the “zoo of factors” down to only those that have had explanatory power to predict above-market returns (as well as that meet a series of tests for persistence, pervasiveness, robustness, investability, and the logic of how they operate), there are really only a handful of factors that are truly worthy of investment (including size, value, momentum, quality, profitability, and quality for equity; as well as term and credit quality for fixed income), which make it much more manageable for investors to implement a factor-investing strategy.
Furthermore, focusing on just the most salient factors can allow investors to avoid some of the criticisms of factor investing raised over the years, including that factors are overly risky compared to the market, that factor investing is prone to failing at inopportune times, and that factors have become irrelevant (or perhaps too well-known and ‘overcrowded’ to produce excess return) for investors going forward. In reality, the body of evidence that supports factor-based investing has only grown larger with time – as long as one focuses on just the factors that have actually proven to be effective.
The key point is that while investment risk is impossible to eliminate, factor-based investment strategies have been shown by a wide body of data to create excess returns without adding to a portfolio’s overall risk. While factor investing isn’t a panacea and can itself be prone to long periods of underperformance, the evidence has shown that it can reward investors who are willing to stick with it. Ultimately, factor investing can be almost as much about behavioral factors as economic ones: The fact that so many investors aren’t willing to endure the risk of underperformance creates potential rewards for the ones who are!
At its most basic level, factor-based investing is about systematically following a set of rules that builds a diversified portfolio of stocks sharing certain well-defined traits/characteristics that are associated with the drivers of investment returns, and avoids (or even sells short) a diversified portfolio with the opposite characteristics. Yet, despite being around for several decades and backed by an enormous body of literature, it is still surrounded by much confusion and debate. The goal of this article is to help advisors and investors by separating fact from fiction when it comes to factor investing.
Factor-based investing got its start in the early 1960s with the introduction of the first formal Capital Asset Pricing Model, the CAPM, which provided the first precise investment definition of how risk drives expected returns. The CAPM looks at risk and return through a ‘1-factor’ lens: The risk and the return of a portfolio are determined (only) by its exposure to market beta. This specific market beta is the measure of the sensitivity of the equity risk of a stock, mutual fund, or portfolio relative to the risk of the overall market. Thus, accordingly to this 1-factor model, higher-risk, higher-beta investments would be expected to go up more than the market when the market is up, and down more when the market is down (while lower-beta investments experience smaller up-and-down swings).
The ‘tipping point’, which led to a dramatic increase in the interest in factor-based strategies, came with the publication of Eugene Fama and Kenneth French’s 1992 study, The Cross-Section of Expected Stock Returns. They proposed that exposure to the factors of size and value, in addition to the market beta factor, further explains the differences in returns of diversified portfolios. The result is that investors could further adjust their return opportunities and expectations by adjusting their portfolio exposure to size (large versus small) and value (as opposed to growth) stocks.
Since then, there has been an explosion in research attempting to identify other factors. For example, in their 2014 paper, Long-Term Capital Budgeting, authors Yaron Levi and Ivo Welch examined 600 factors from both the academic and practitioner literature. The huge number of factors identified led John Cochrane to coin the term “zoo of factors”.
Factors Worth Considering In The Zoo Of Factors
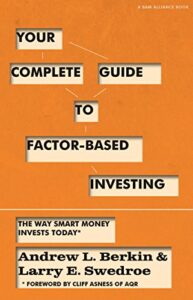 To help investors determine which exhibits in the factor zoo are worthy of investment, in our book Your Complete Guide to Factor-Based Investing, Andrew Berkin and I recommended that for a factor to be considered, it must meet all of the tests discussed below.
To start, it must provide explanatory power to portfolio returns and have delivered a premium (higher returns).
Additionally, the factor must be:
- Persistent: It holds across long periods of time and different economic regimes
- Pervasive: It holds across countries, regions, sectors, and even asset classes
- Robust: It holds for various definitions (for example, there is a value premium whether it is measured by price-to-book, earnings, cash flow, or sales)
- Investable: It holds up not just on paper but also after considering actual implementation issues, such as trading costs
- Intuitive: There are logical risk-based or behavioral-based explanations for its premium and why it should continue to exist
Imposing those criteria reduced the zoo of equity factors to just a basic handful (beta, size, value, momentum, profitability, and its ‘kissing cousin’, quality) and 2 bond factors (term and credit). The 2 leading equity asset pricing models, the Fama-French 5-factor (beta, size, value, profitability, and investment), and 6-factor (adding momentum) models, as well as the q-theory model (beta, size, profitability, and investment), recognize that only a small number of factors are needed to explain most of the differences in returns of diversified portfolios. Thus, at least as far as the academic community is concerned, there isn’t really a zoo of factors.
Noting that there is still much confusion and debate surrounding factor investing, Michele Aghassi, Cliff Asness, Charles Fattouche, and Tobias Moskowitz attempted to bring clarity to the subject in their paper Fact, Fiction, and Factor Investing, published in The Journal of Portfolio Management, Quantitative Special Issue 2023. They focused on the main factors that pervade the academic literature and practice: value, momentum, carry, and defensive/quality investing – factors that dominate the empirical models used in academic finance. They then proceeded to tackle 10 facts and fictions associated with factor investing.
Fiction: Factor Investing Is Data-mined With No Good Economic Story
Your Complete Guide to Factor-Based Investing provided an in-depth review of the academic literature, providing both risk- and behavioral-based explanations for each of the factors we recommended investors should consider demonstrating that they met all the established criteria, including out-of-sample persistence, pervasiveness, and robustness.
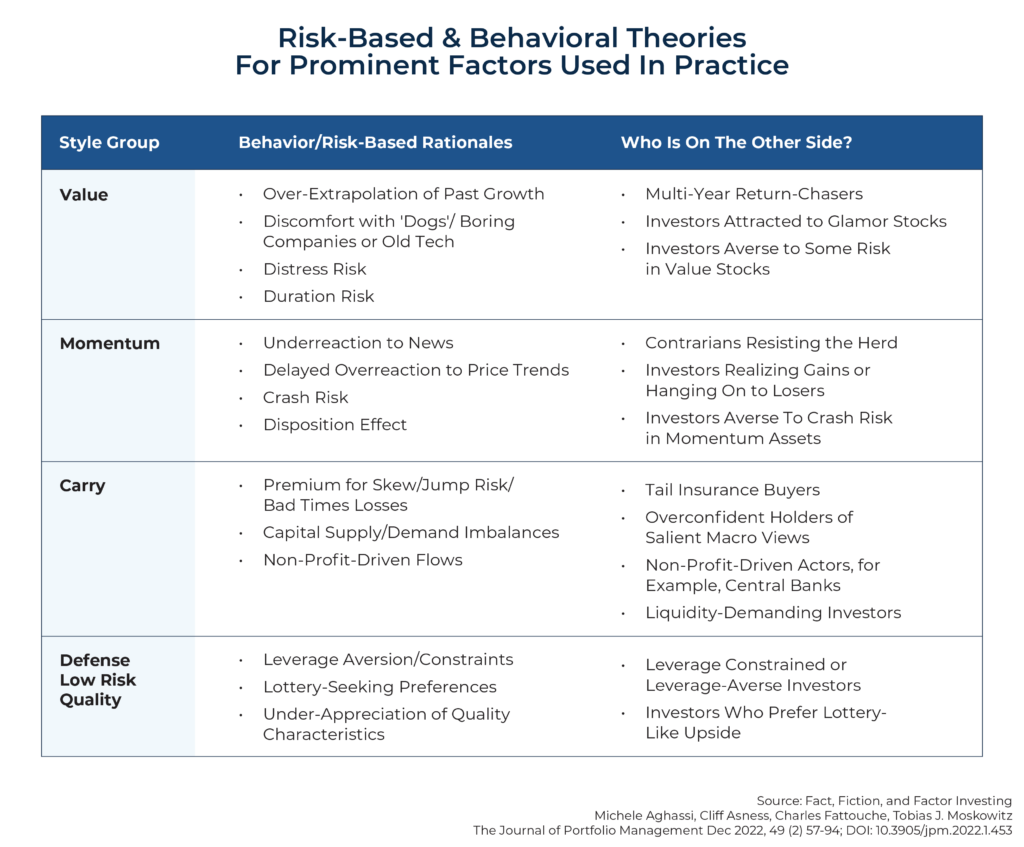
In the exhibit below, Aghassi et al. provided a brief summary of some of the risk-based and behavioral theories offered for the most prominent factors from the literature that are used in practice. They also noted that the risk- and behavioral-based explanations are not mutually exclusive, as a premium associated with a factor can be driven by both forces.
The theories also offered an explanation of who is on the other side of each factor, presented in the last column of the exhibit. They noted that “Certain factors deliver positive returns beyond market risk either because they offer compensation for an additional risk exposure in efficient markets that some investors care about or because they exploit or take the other side of different preferences or beliefs some investors have.”
This is important because, as the authors note, “any deviation from the market, such as investing in factors, must be met with someone’s willingness to take the other side.” Again, a sustainable factor for investing must have a valid (often behavior-based) reason as to why other investors would be making it available in the marketplace to begin with.
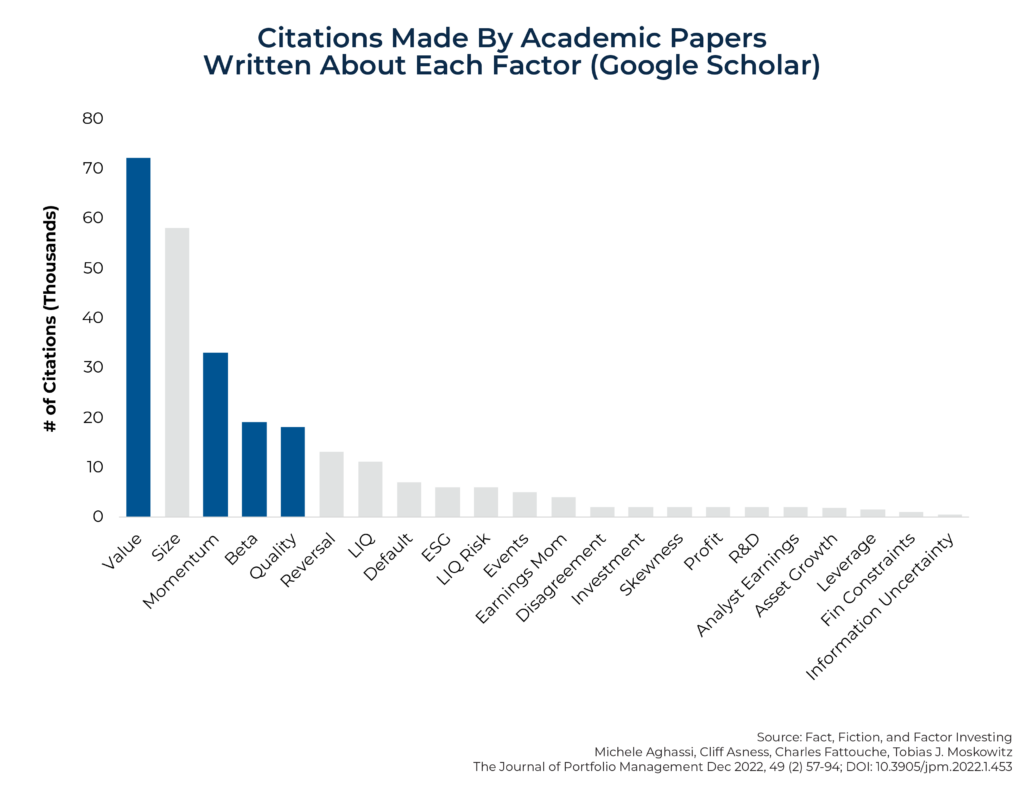
To demonstrate that there is consensus in the academic community around which factors meet reliable criteria, the authors used Google Scholar to document the number of academic citations pertaining to papers written about each factor (see chart below):
If one thinks of citations as the currency of the academic market, “academic market prices” of these factor discoveries are perfectly aligned with their veracity and reliability. In other words, the (academic) market understands what a reliable factor is and, conversely, what it is not. In this sense, the idea that there is a replication crisis in finance or that our field has not learned anything about what drives expected returns is way (waaaaay!) overblown. The reality is that most of the work in academia focuses on factors for which there is consensus.
Fact: Factors Are Risky
Factor investment strategies are not arbitrage opportunities. They provide long-term positive expected returns but also, on occasion, may suffer from severe short-term poor performance, bad medium-term disappointment, or even what seems like long-term futility. Such periods help explain who is on the other side – investors who cannot stomach the short-term downswings in these strategies (and deal with the negative tracking variance) may be willing to forgo the added long-term expected return premium associated with the strategies in order to avoid these risks. Simply put, if the factors always worked all of the time, they would not entail any risk. Thus, investors wouldn’t generate higher investment returns over time – they would be owned by all investors and simply be the market return.
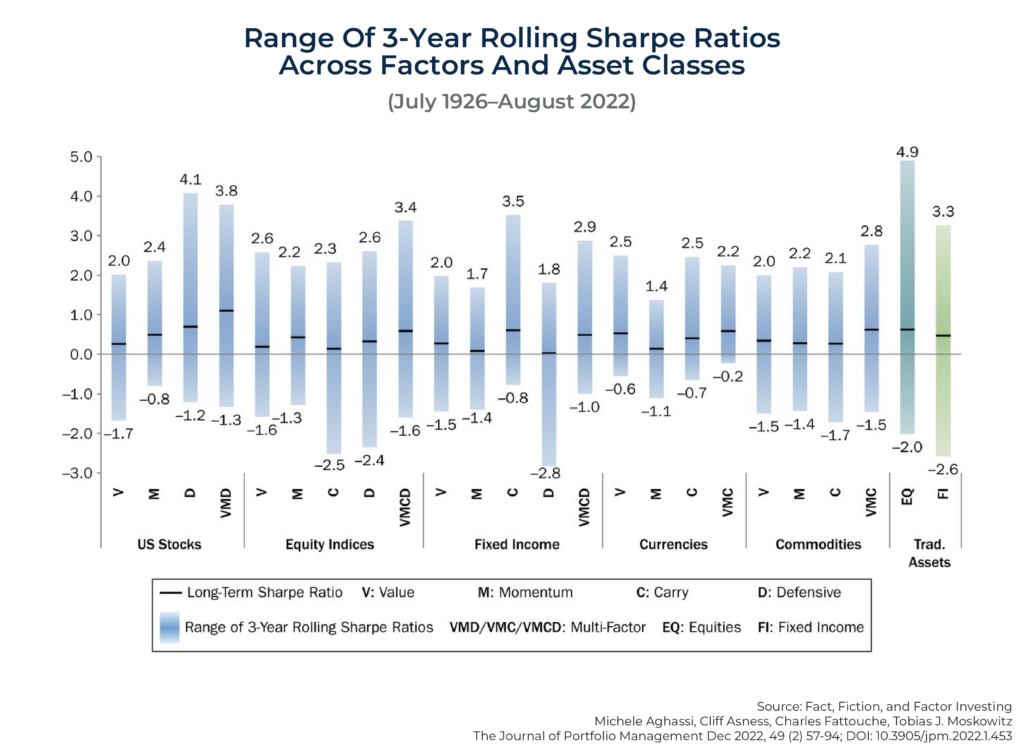
To demonstrate these points, Aghassi and her co-authors examined the range and average of the rolling 3-year realized Sharpe ratio of 4 factors (value, momentum, defensive, and carry) and multifactor portfolios of those 4 factors applied to 5 different asset classes (stocks and industries, equity indices, fixed income, currencies, and commodities) over the last century.
The chart below shows the range of 3-year rolling Sharpe ratios across factors and asset classes over the period July 1926–August 2022. It demonstrates that each of these factors and multifactor portfolios, regardless of the asset class to which they were applied, experienced a meaningfully negative Sharpe ratio over some 3-year period. Most importantly, these downside properties and long-term Sharpe ratios are not unique to factors, as their distributions are comparable with those of traditional markets, namely equities and fixed income (bonds), shown in the far right of the graphic.
Fiction: Factor Diversification Often Fails When You Need It The Most
Aghassi et al. began by noting that there are 2 different versions of this claim: “One version focuses on situations in which the factors ‘fail to diversify’ each other, amidst terrible performance by one. The other version of this fiction is about times when factor investing ‘fails to diversify’ bad market performance.” They explained that there are 2 problems that underlie both versions of this fiction: an excessive focus on the short term, and mistaking diversification for a hedge (which is an offsetting bet against risk that usually does not get rewarded long term and often costs something).
In contrast, diversification merely requires that the correlations of return streams are reasonably less than 1. This diversification can be very beneficial over time, but it does not make the diversifying asset a consistent hedge.
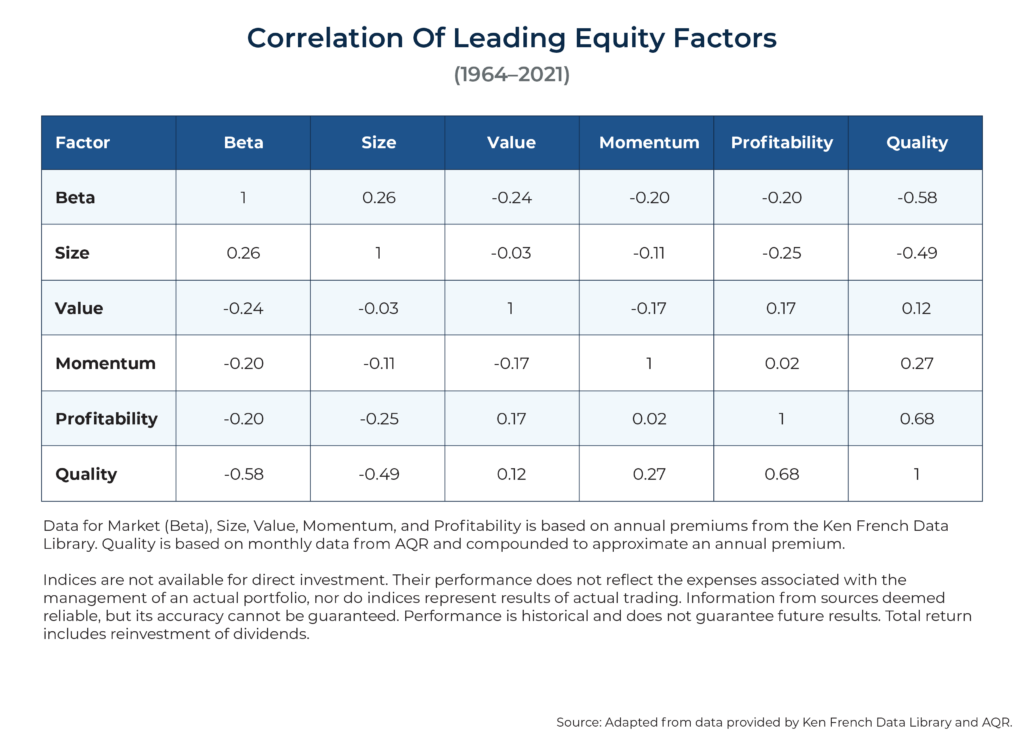
One reason is that correlations are not consistent; they are time varying (there will be periods when correlations increase and others when they turn negative or become even more negative). The following table shows the correlation of the leading equity factors over the period 1964–2021 and demonstrates that while factor investing does not hedge the market, it can provide valuable diversification over the long term (the horizon that should matter to investors).
Aghassi et al. demonstrated the key points that not only are correlations time varying but also that there are many periods in which a single factor, although not always the same one, can dominate performance.
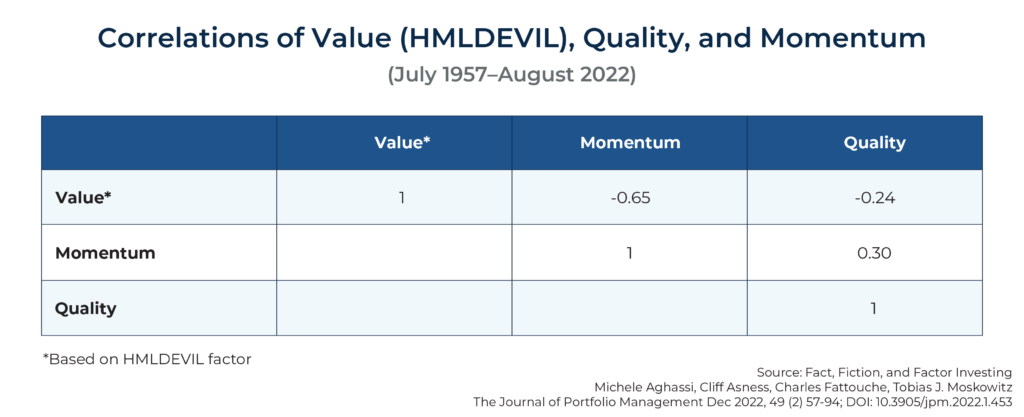
The following table shows the correlations of 3 factors – value (based on HMLDEVIL), momentum, and quality – over the period July 1957–August 2022:
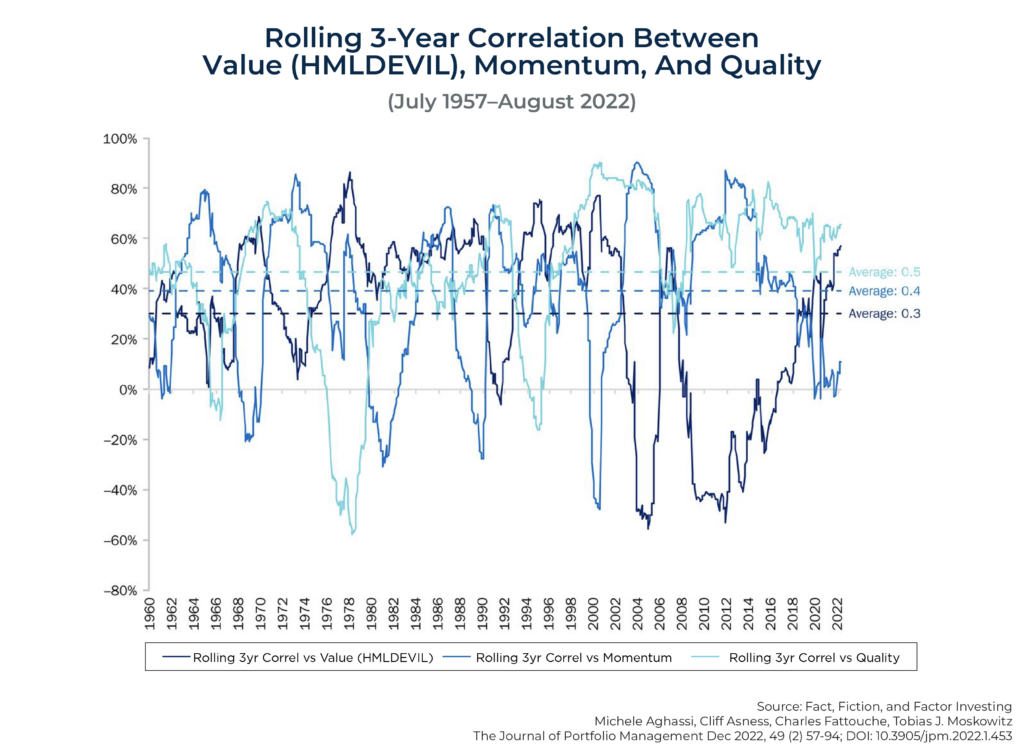
The authors then graphed the rolling 3-year correlation (over the same July 1957–August 2022 period) between the 3 factors and the multifactor strategy that combined them. The authors noted: “Not only are there short-lived periods in which the portfolio becomes highly correlated with each of the factors individually, but there are also subperiods in which some of these univariate correlations become negative.” In other words, correlations among factors change through time to the extent that sometimes they’re almost hedge-like (with negative correlations), and other times there is almost no short-term diversification benefit at all (as correlations occasionally spike over 80%).
The authors added: “Such is the nature of having diversified sources of return”, and then concluded: “The bottom line is that while individual factors can dominate over the short term, longer-term performance tends to be driven by more balanced gains across all of the factors.”
Fact: Factors Work Across Many Markets And Conditions
The academic literature demonstrates that the factors considered have evidence of a premium that has been persistent across long periods and various economic regimes, and pervasive across various asset classes (stocks, bonds, commodities, and currencies), countries, and regions, as well as industries/sectors. Your Complete Guide to Factor-Based Investing presented the evidence for each factor. In addition, Aghassi et al. similarly noted, “While the magnitude of the return premia can vary among subsets of stocks, typically being bigger for smaller and higher volatility securities, their existence is robust across all of these segments.”
They also noted, though, that “While factor premia remain long-term robust phenomena across markets, however, we also know they can experience significant variation in performance. The empirical finance literature provides substantial evidence of time variation in factor risk-adjusted returns.” That is why a strong belief system is needed in order to stay disciplined during periods of poor performance. Importantly, this is true not only of factor investing in particular but of traditional equity investments as well.
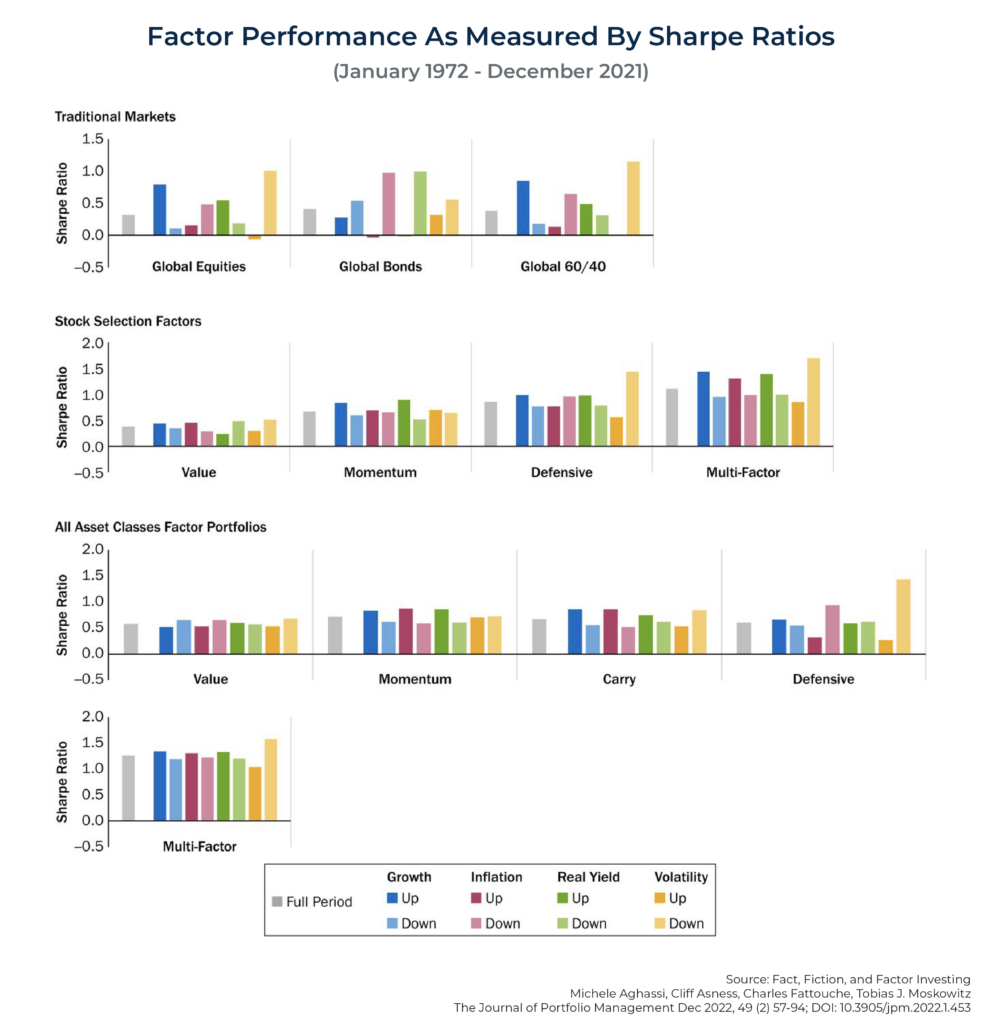
The following table from the paper shows the performance (as measured by Sharpe ratios) of the factors across growth and inflation environments over the period January 1972–December 2021, segmented into whether market growth was up or down, inflation was up or down, real yields were up or down, and whether volatility was rising or falling:
The authors explained (and the exhibit demonstrates) the following:
There is little evidence that time variation in factor premia is related to macroeconomic environments, with Sharpe ratios of the factors being largely stable across different economic regimes (growth vs. decline, high or low rates, high or low volatility, etc.). This does not mean factors perform ex post well in every environment, just that they do so on average. There is no reliable significance in factors’ exposure to the macroeconomy, with the possible exception of the defensive factor being sensitive to inflation and volatility.
In fact, further observation of the charts reveals that Sharpe ratios were most consistently high across all the different environments, helping a diversified multifactor portfolio (bottom panel of graphic above). Accordingly, the authors added: “At the multifactor portfolio level, which diversifies across the factors, the impact of economic regimes is even more muted, suggesting some of the variation in factor returns is diversifiable.” In other words, not only do factors tend to be more diversified than markets in general, but diversification across factors also appears to be particularly effective in managing varying economic and market conditions.
Fiction: Factors Do Not Work Anymore In The New Economy
When the nature of our economy itself begins to change – as it does every few decades, in the evolution from our agricultural roots to the industrialization of countries around the world, the rise of knowledge workers and the computer age, and now perhaps on the cusp of a new ChatGPT-driven AI era, not to mention shifting corporate tax and political environments and narrowing and rising income inequality – investors often raise questions about whether the “new economy” will reshape the nature of investing itself, and what factors may (or may not) be relevant in the future.
Yet, as Aghassi et al. note in their research paper:
There have been many extraordinarily transformative changes over the last couple of centuries: railroads, steamships, the Industrial Revolution, the Great Depression, World War II, the Cold War, space exploration, stagflation, Reaganomics, personal computing, the internet, and social media, to name just a few. And yet we have seen factors continue to work, despite these ongoing changes—even the ones occurring in the last few decades. This persistent long-term success should come as no surprise, given the risk-based and behavioral explanations for the factors are invariant to old versus new economy conditions. As the world has progressed, compensation for risk did not become unnecessary and investors have not magically become perfectly rational.
In other words, the factors of factor investing persist both because some have risk-based explanations and because some are not actually tied to the economy itself; they persist because of their very human roots in investor preferences and behaviors. And while the nature of the economy and the broader environment may shift, humans remain human, which means the investment opportunities that arise from human investment behaviors remain, too.
Fact: Factors Were Not And Are Not Too Crowded Despite Being Well Known
One of the more common fears around those considering factor investing is whether it is now ‘too well known’ – to the point that the opportunities that may have been present in the past will no longer be available today, now that ‘everyone’ knows about them and (over)crowds into the factor.
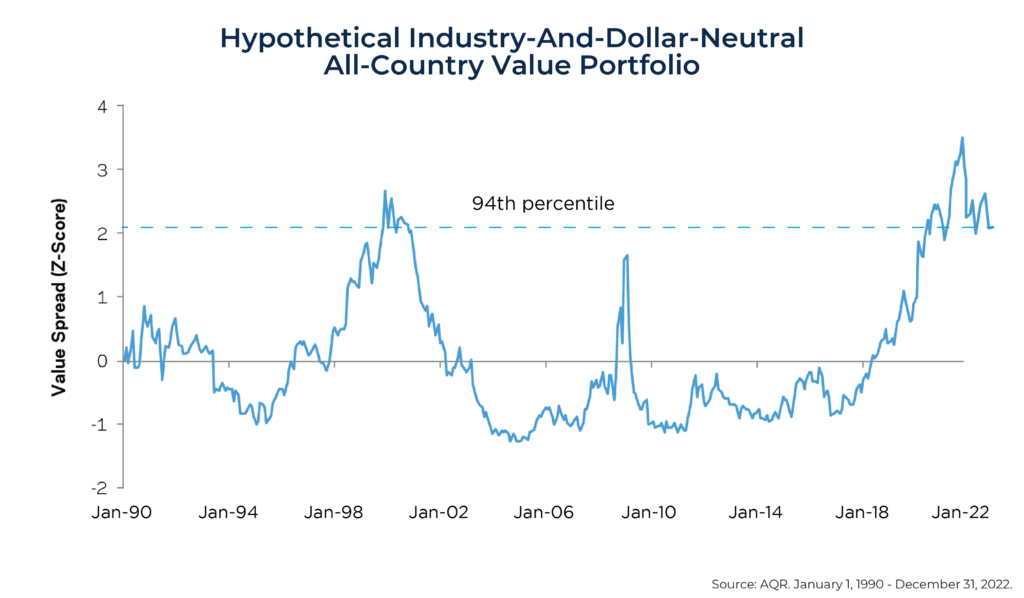
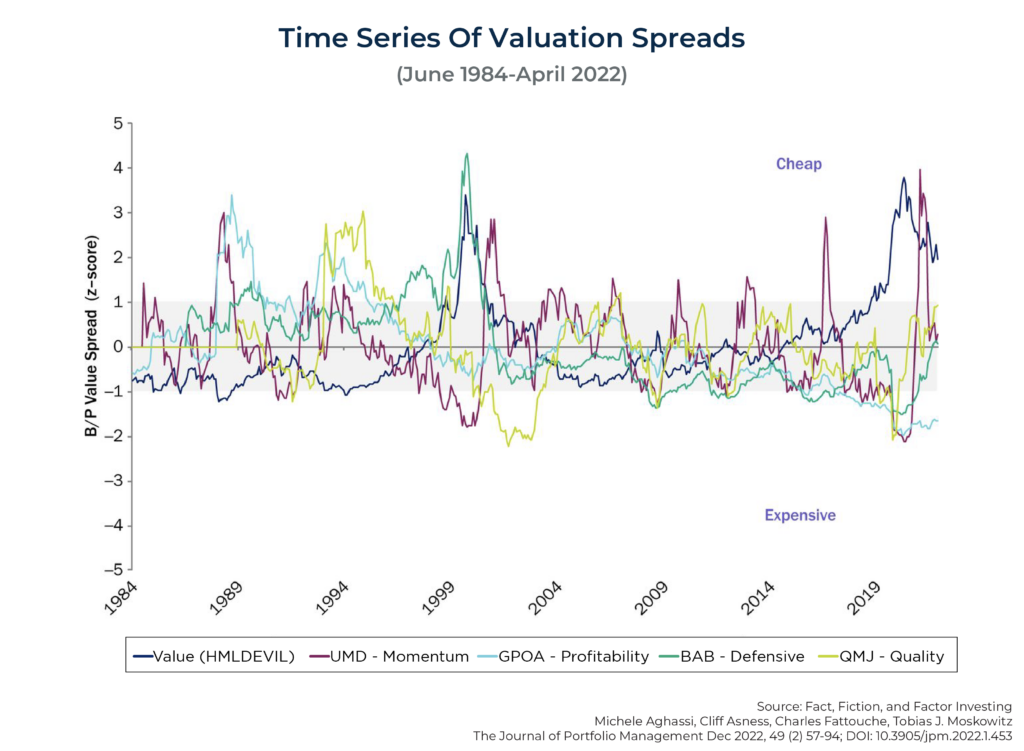
The simplest way to determine if a factor has become crowded is to examine relative valuations. For example, if the value factor was becoming crowded because of cash inflows, the value-to-growth valuation spread would narrow as value stocks became more expensive relative to growth stocks. Yet, in fact, as the chart below demonstrates, as of the end of 2022, a hypothetical industry- and dollar-neutral all-country value portfolio was trading at the 94th percentile in terms of relative cheapness, as the value spread hit its highest point in decades.
Clearly, the value trade has not become overcrowded; once viewed through the lens of relative valuation, value is actually the least crowded it has been at any point since the peak of the tech bubble!
The explanation for why factors may not be overcrowded, despite ‘everyone’ knowing about them, is simple. Just because investors are aware of a factor premium doesn’t mean they would choose to invest in that factor. It could be that they don’t want the economic or behavioral risks associated with the factor. Consider, for instance, that everyone is aware of the large historical premium generated by the market beta factor (i.e., stocks have historically outperformed bonds by a sizable margin), but very few investors are 100% in equities, and some investors avoid them altogether.
The historical evidence demonstrates that demand to take either side of factor bets varies over time as tastes for risks and preferences change. And that is the case with valuations. The following chart plots the time series of valuation spreads of value (HMLDEVIL), momentum, profitability, defensive, and quality factors over the period June 1984–April 2022. The value spreads indicate whether a factor looks ‘cheap’ or ‘expensive’ relative to its history – an indication of crowding into or out of a factor.
As Aghassi et al. note in their paper:
Comparing the time series of value spreads across the factors suggests that crowding was unlikely to blame for the poor performance from 2018 to 2020. For example, the value factor was relatively cheap prior to 2018, having followed a decade of relatively lower performance, which indicated lack of crowding into the value factor. Yet, it was precisely the value factor that experienced the worst drawdown from 2018 to 2020. Conversely, the defensive factor looked relatively expensive and hence possibly crowded, yet it did very well during the subsequent 2018–2020 period. These patterns are the opposite of what one would expect from a crowding story.
A well-known strategy will continue to work going forward as long as the other side of the trade does not disappear and as long as it does not become too crowded. But it takes a lot for a factor to become overcrowded, as risk and risk-based strategies (factors) cannot be arbitraged away. Of course, this applies to the equity market factor (beta) as well. That does not mean these premia won’t fluctuate over time, but a long-term positive premium should still be expected, and a relatively ‘moderate’ level of crowding from a known-to-be-popular factor may not be enough to eliminate its investment opportunities in practice.
Fiction: Everyone Should Invest In Factors
Because factors deviate from market weights and everything must add up to the market weight, not everyone can invest in the same factors at the same time – for each position that is net long (or overweight) a factor, there must be someone willing to take an offsetting short (or underweight) position. For either behavioral- or risk-based reasons, investors may desire to have long or short positions in factors.
For example, despite their historically poor performance, some investors have a preference for securities with lottery-like (very high growth potential) distributions; this allows other investors to take the other side of the trade by overweighting to the value factor when choosing stocks. And the well-known behavioral risk of negative tracking variance (when a portfolio underperforms the overall market) is a good reason for investors subject to that risk to avoid deviating from the market portfolio in the first place (and simply owning a market index instead of making an allocation towards a particular factor).
Having a deep understanding of why you invested in a factor in the first place is important for sticking with your investment decision during the inevitable periods of poor performance. Adhering to a well-thought-out plan is the necessary ingredient for investment success. My more-than-25 years of experience as an advisor has taught me that not every investor can deal with negative tracking variance – periods of time when a particular investment holding (which might be an allocation to a certain factor) may underperform its benchmark or the broader market.
Investors who cannot tolerate periods of underperforming the market should not deviate from the market portfolio because they may engage in panicked selling after a period of poor performance, just when expected future returns are greatest, as relative valuations are cheapest. Of course, the fact that some investors will not have the tolerance to invest in certain factors because of their potential for short-term underperformance is also, again, what leads those factors to persist in generating more favorable returns in the long run as well.
Fact: Factor Discipline Generally Trumps Timing, Tinkering, And Trading
Market timing is tempting because the historical evidence demonstrates that when valuations are high (low), expected returns are lower (higher). For example, research on the expected equity premium, including Aswath Damodaran’s 2017 study, Equity Risk Premiums (ERP): Determinants, Estimation and Implications, has found that the best predictor of future equity returns is current valuations – whether using measures such as the earnings yield (E/P) derived from the Shiller CAPE 10 (or for that matter, the CAPE 7, 8 or 9) or the current E/P – not historical returns.
The research has also found that valuations provide information on future factor returns. For example, authors Adam Zaremba and Mehmet Umutlu, in their 2018 study, Strategies Can Be Expensive Too! The Value Spread and Asset Allocation in Global Equity Markets, examined whether the value spread (the difference in valuation ratios between the long and the short sides of the trade) is useful for forecasting returns on quantitative equity strategies for country selection. To test this, they examined a sample of 120 country-level equity strategies replicated within 72 stock markets for the years 1996 through 2017. They found that:
The breadth of the value spread can predict the future returns in the cross-section. We show that equity strategies with a wide value spread markedly outperform strategies with a narrow value spread. In other words, if you wonder which strategy might produce decent payoffs in the future, pay attention to the value spread.
Their findings are consistent with those of Fahiz Baba Yara, Martijn Boons, and Andrea Tamoni, the authors of the 2018 study, Value Timing: Risk and Return Across Asset Classes, who found that:
Returns to value strategies in individual equities, commodities, currencies, global government bonds and stock indexes are predictable by the value spread. … In all asset classes, a standard deviation increase in the value spread predicts an increase in expected value return in the same order of magnitude (or more) as the unconditional value premium.
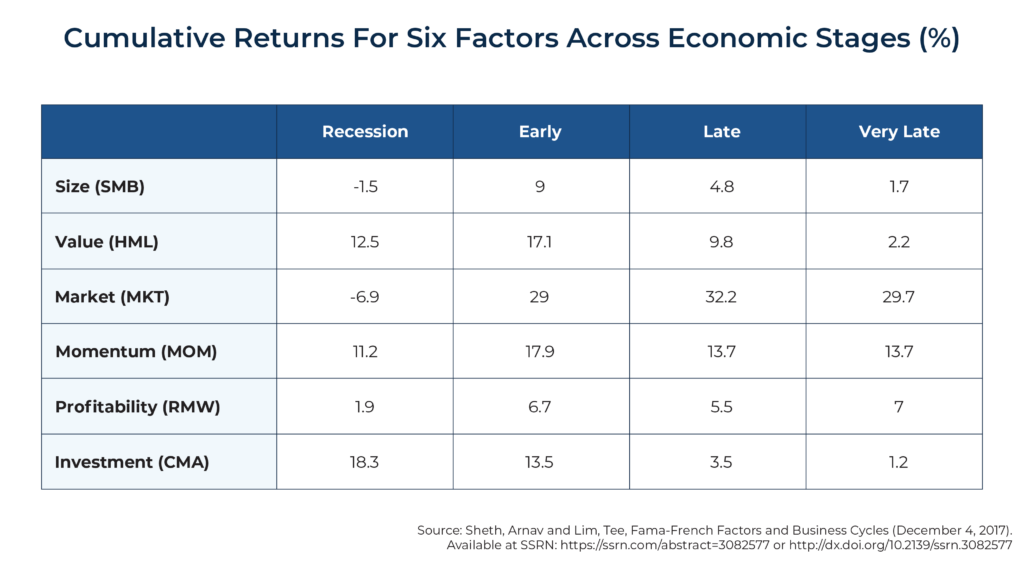
In addition, research has found that factor premiums are both time-varying and dependent on the economic cycle. For example, Arnav Sheth and Tee Lim, authors of the 2017 study Fama-French Factors and Business Cycles, examined the behavior of 6 Fama-French factors – market beta (MKT), size (SMB), value (HML), momentum (MOM), investment (CMA), and profitability (RMW) – across business cycles, splitting them into 4 separate stages: recession, early-stage recovery, late-stage recovery, and very-late-stage recovery. Their data, including the results shown in the following table, covered the period from April 1953 through September 2015. As the table below shows, factor premiums vary and are regime dependent.
All this data about how the outperformance of certain factors is associated with their valuation (e.g., value returns correlated to the value spread) or where we are in the economic cycle (per the graphic above) makes timing them tempting. However, in their study, Contrarian Factor Timing Is Deceptively Difficult, which appeared in the 2017 special issue of The Journal of Portfolio Management, Cliff Asness, Swati Chandra, Antti Ilmanen, and Ronen Israel found “lackluster results” when they investigated the impact of value timing – whether dynamic allocations can improve the performance of a diversified multi-style portfolio.
The authors found that “strategic diversification turns out to be a tough benchmark to beat.” They added: “Tactical value timing can reduce diversification and detract from the performance of a multi-style strategy that already includes value.” They also found that contrarian value timing of factors, while tempting, is generally a weak addition for long-term investors holding well-diversified factors including value, and specifically, it does not send a strong signal even when valuations are stretched.
Providing further evidence of the difficulty of timing factor premiums is the 2020 study Factor Exposure Variation and Mutual Fund Performance, initially posted in August 2018. The authors, Manuel Ammann, Sebastian Fischer, and Florian Weigert, examined whether actively managed mutual funds were successful at timing factor premiums (net of fees) over the period from late 2000 through 2016. They found that while factor-timing activity is persistent, risk-factor timing is associated with future fund underperformance. For example, a portfolio of the 20% of funds with the highest timing indicator underperformed a portfolio of the 20% of funds with the lowest timing indicator by a risk-adjusted 134 basis points per year with statistical significance at the 1% confidence level (t-stat: 3.3).
Summarizing their results, Ammann et al. concluded: “Our results do not support the hypothesis that deviations in risk factor exposures are a signal of skill and we recommend that investors should resist the temptation to invest in funds that intentionally or coincidentally vary their exposure to risk factors over time.”
As another example of the problems of market timing, in a 2012 paper, An Old Friend: The Stock Market’s Shiller P/E, Cliff Asness of AQR Capital Management found that the Shiller CAPE 10 does provide valuable information. Specifically, he found that 10-year-forward average real returns dropped nearly monotonically as starting Shiller P/Es increased. He also found that as the starting Shiller CAPE 10 ratio increased, worst cases became worse and best cases became weaker. Additionally, he found that while the metric provided valuable insights, there were still very wide dispersions of returns. For instance:
- When the CAPE 10 was below 9.6 (a low valuation, implying favorable expected future returns), 10-year-forward real returns averaged 10.3%. In relative terms, that is more than 50% above the historical average of 6.8% (9.8% nominal return less 3.0% inflation). The best 10-year-forward real return was 17.5%. The worst 10-year-forward real return was still a pretty good 4.8%, just 2.0 percentage points below the average and 29% below it in relative terms. The range between the best and worst outcomes was a 12.7 percentage point difference in real returns.
- When the CAPE 10 was between 15.7 and 17.3 (about its long-term average of 16.5), the 10-year-forward real return averaged 5.6%. The best and worst 10-year-forward real returns were 15.1% and 2.3%, respectively. The range between the best and worst outcomes was a 12.8 percentage point difference in real returns.
- When the CAPE 10 was between 21.1 and 25.1 (high valuation, implying reduced expected future returns), the 10-year-forward real return averaged just 0.9%. The best 10-year-forward real return was still 8.3%, above the historical average of 6.8%. However, the worst 10-year-forward real return was then -4.4%. The range between the best and worst outcomes was a difference of 12.7 percentage points in real terms.
- When the CAPE 10 was above 25.1 (highest valuations, suggesting substantially lower expected forward returns), the real return over the following 10 years averaged just 0.5% – virtually the same as the long-term real return on the risk-free benchmark, 1-month Treasury bills. The best 10-year-forward real return was 6.3%, just 0.5 percentage point below the historical average. But the worst 10-year-forward real return was then -6.1%. The range between the best and worst outcomes was a difference of 12.4 percentage points in real terms.
What can we learn from the preceding data? First, starting valuations clearly matter, and they matter a lot. Higher starting values mean that not only are future expected returns lower, but the best outcomes are lower and the worst outcomes worse. And the reverse is true as well – lower starting values mean that not only are future expected returns higher, but the best outcomes are also higher and the worst outcomes less poor.
However, it’s also extremely important to understand that a wide dispersion of potential outcomes, for which we must prepare when developing an investment plan, still exists – high (low) starting valuations don’t necessarily result in poor (good) outcomes. The best return at sky-high valuations was a 6.3% annualized real return over the subsequent 10 years, which is better than the worst 10-year return (4.8%) when starting at the most favorable valuation. In other words, investors should not think of a forecast as a single-point estimate but only as the mean of a wide potential dispersion of returns. The reason for the wide dispersion is mostly that risk premiums themselves are time-varying (if they were not, there would be no risk). It is the time-varying risk premium, what John Bogle called the “speculative return”, that leads to the wide dispersion in outcomes (such that good returns in a bad environment may still be better than some of the bad returns that occur in good starting valuation environments).
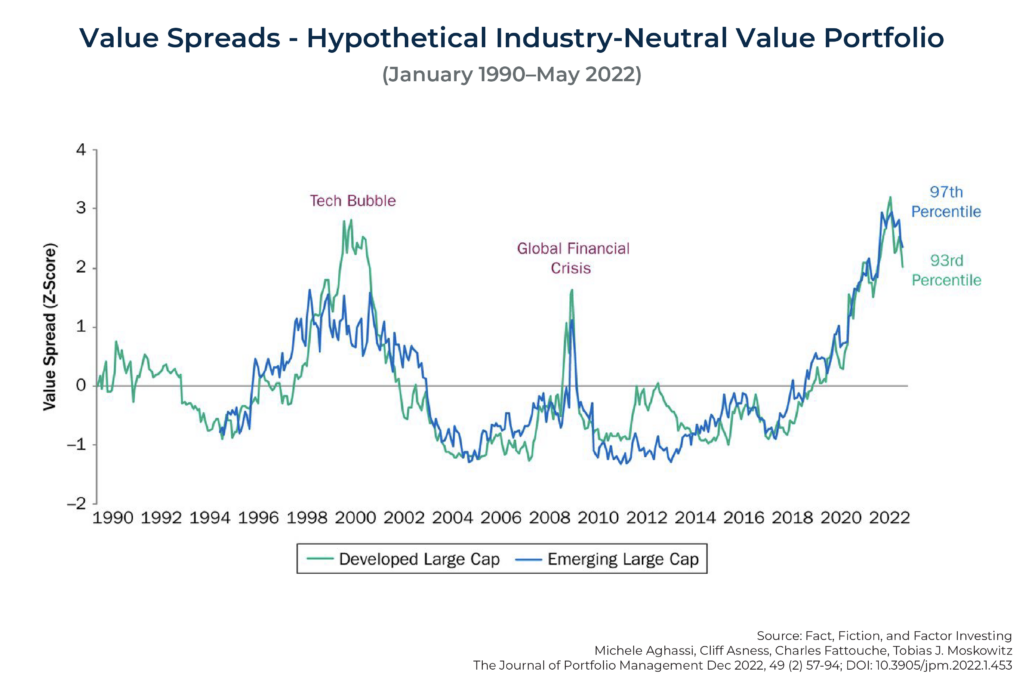
In addition, while valuations are the best predictor we have of future premiums, relatively high valuations (like a CAPE 10 well above its historical average) don’t predict negative premiums – they just predict smaller-than-historical premiums. Another caution is that factors can continue to underperform for lengthy periods, even when valuations are historically favorable. The following chart showing the value spreads for a hypothetical industry-neutral value portfolio over the period January 1990–May 2022 illustrates this point:
While value continued to trade at historically cheap levels in the late 1990s (indicated by a high value spread in the chart above), it still experienced its largest drawdown ever to that point. And once again, in 2019, while value was again trading at historically cheap levels (high value spreads), it continued to experience a large drawdown until experiencing a turnaround beginning in November 2020. These examples demonstrate that while cheap valuations may be tempting to time, trying to time factors can be ‘fraught with opportunity’ and should be attempted only by those with a strong belief system and strong enough stomachs to stay the course through long periods of negative performance.
Fiction: You Know When You Are In A Drawdown/Recovery And When To Cut/Add Risk
While forward-looking market timing based on valuations may be challenging, some investors are still tempted to try to ‘time’ the market (or various investment factors) by doubling down after factors have underperformed or had a significant drawdown, in anticipation that returns ‘must’ be better in the future given the recent past (or similarly, that “we must be closer to the end than the beginning of this drawdown/underperformance” such that it’s a good time to add to the position).
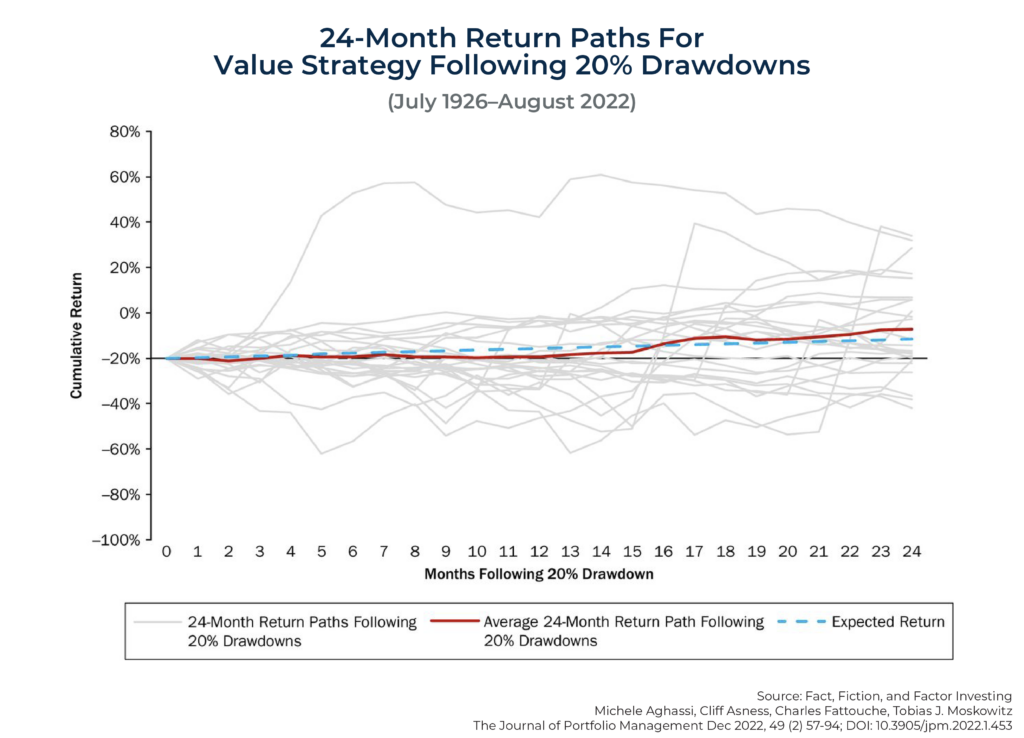
To explore this, the following chart from Aghassi and her co-authors shows all the 24-month return paths of a value strategy following 20% drawdowns over the period July 1926–August 2022. As shown, the average return path of investing after a drawdown is very similar to the path implied by the long-term expected return in the first place. In other words, over a relatively ‘short’ time period of 2 years, the recovery path after a drawdown actually is not all that dissimilar from the average (expected) return path in any particular 2-year time period.
Aghassi et al. concluded, “Knowing you are in a drawdown provides little information about subsequent expected returns – whether one is trying to stem the losses by reducing or capitalize on the losses by adding. It is really tough to know when to cut or add risk.” They added: “Retaining consistent and disciplined exposure to a well-diversified multifactor portfolio is hard to beat.”
Fact: Sticking With Factor Investing Is Hard, But Worth It
Because of the nature of risk, and the virtual certainty that factor strategies will experience long periods of underperformance (and, with them, the behavioral problem of negative tracking variance), factor investing is hard. It requires a strong belief system that can provide the discipline needed to ignore the stress created by near-term negative performance (or relative underperformance) and allow investors to stay the course. If factor investing were easy, everyone might do it; again, it’s the presence of investor behaviors (from preferences to risk needs and tolerance) that don’t always align with factor investing that allows the factors to exist and persist and potentially be ‘investable’ in the first place.
This is what led Aghassi et al. to similarly conclude it is that difficulty that “creates those willing to hold the other side to provide a sustainable return premium going forward.” And that “What makes sticking with it particularly difficult is that factor investing will inevitably experience drawdowns, but you will not know when (fact #2) or be able to time them well (fact #8 and fiction #9). Moreover, you will not have easy explanations for them (fact #2 and fiction #3).”
The authors added that what makes sticking with it particularly hard is that when factors suffer drawdowns, it is difficult to know why: “This is both a curse and blessing, as it makes factors more difficult to stick with during the difficult times (that’s the curse), but this is what allows factors to bring much-needed diversification to investors’ portfolios (the benefit).”
Advisor Takeaways On Factor Investing For Clients
Factor investing is backed by an enormous body of literature, strong out-of-sample evidence, and an economically intuitive rationale. But the fact that factor strategies have become well known doesn’t mean they won’t work going forward. They will continue to generate premiums as long as the other side of the trade does not disappear (which appears unlikely because they’re tied to fundamental behaviors and risk preferences of human investors who remain human), and as long as they do not become overcrowded (keeping in mind that risk and thus risk-based strategies [factors] cannot be arbitraged away). Of course, this applies to the equity factor as well. Still, though, that does not mean these premia won’t fluctuate over time, but a long-term positive premium for both the market beta and value factors can be expected.
The fact that factor strategies that meet all of the criteria we established for investing have experienced long periods of underperformance should not lead to a loss of faith, as all strategies that involve risk assets experience short and sometimes long periods of poor performance (if that were not the case, there would be no risk and no premium). Instead, the evidence that all strategies involving risk assets experience long periods of poor performance should lead one to conclude that diversification across unique sources of risk and return is the prudent strategy. This is especially because the research findings demonstrate that factor investment strategies have provided valuable diversification to traditional markets that is not dependent on market conditions or macroeconomic environments in the first place.
Nonetheless, while diversification is valuable, it cannot eliminate losses – it is not a hedge. However, hedges (insurance) typically have negative expected returns, while the factors that meet the criteria we established have expected positive return premiums for which, importantly, diversification of factors doesn’t fail any more often when ‘most needed’ versus other normal times.
Finally, factor timing is extremely difficult, and a consistent and disciplined exposure to a well-diversified multifactor portfolio is hard to exceed.
For informational and educational purposes only and should only be construed as specific investment, accounting, legal, or tax advice. Certain information is based on third party data and may become outdated or otherwise superseded without notice. Third-party information is deemed to be reliable, but its accuracy and completeness cannot be guaranteed. Indices are not available for direct investment. Their performance does not reflect the expenses associated with the management of an actual portfolio nor do indices represent results of actual trading. Information from sources is deemed reliable, but its accuracy cannot be guaranteed. Performance is historical and does not guarantee future results. All investments involve risk, including loss of principal. By clicking on any of the links above, you acknowledge that they are solely for your convenience and do not necessarily imply any affiliations, sponsorships, endorsements or representations whatsoever by us regarding third-party websites. We are not responsible for the content, availability or privacy policies of these sites, and shall not be responsible or liable for any information, opinions, advice, products or services available on or through them. Neither the Securities and Exchange Commission (SEC) nor any other federal or state agency have approved, determined the accuracy, or confirmed adequacy of this article. The opinions expressed by featured authors are their own and may not accurately reflect those of Buckingham Strategic Wealth® or its affiliates. LSR-23-440


