Executive Summary
People often talk about "the economy" as a single entity whose parts move in unison, with a small number of key indicators (such as GDP, the unemployment rate, and inflation) moving reliably in relation to each other. In reality, though, the economy is a complex web of interdependent factors where events often make sense only in hindsight – and sometimes, not at all. This has perhaps never been more true in many financial advisors' careers than at the current moment where, depending on which numbers you look at, the economy could be either growing steadily, leveling off, or already in a recession. And when conditions are this uncertain, it often makes sense to dive deeper into the factors driving the economy to better understand the risks – and opportunities – that clients may face.
At a high level, we're currently seeing a 'tale of 2 economies': While the market for services has expanded steadily since the beginning of the year (with both employment and the price of services growing in kind), the U.S. manufacturing sector, by the measures of employment and service prices, has been in a recession for nearly 12 months. And even though numerous signs are pointing to the looming possibility of a more widespread economic downturn – including the reduction of household savings, reduced lending, and the resumption of student loan payments for many borrowers – the job market remains strong. Furthermore, inflation, though down from its peak in early 2022, remains above the Federal Reserve's long-term target of 2% despite the bank's attempts to tamp it down.
What's driving many of the economic conditions today are higher interest rates resulting from the Fed's efforts to fight inflation. But while these high rates might be enough to tip the country into a recession if we were in 'normal' times, there has been so much liquidity in the economy – both as a residual effect of the economic stimulus programs of the COVID-19 pandemic and the more recent Inflation Reduction Act and legislation subsidizing green energy and semiconductor manufacturing – that it's possible the Fed may need to hike rates even further (and keep them high for longer than expected) to achieve its inflationary goals.
The expectations for the future economic outlook also appear in the valuations of equities, which tend to reflect how markets anticipate that corporate earnings will grow in the future. Yet again, the numbers tell a different story depending on where you look: While growth stocks (particularly for large companies) are trading at historically high valuations, value stocks are trading as if we were already in a serious recession. And even though U.S. equities have been able to weather a wide variety of economic conditions over the last 30 years (thanks to broader trends of both declining interest rates and corporate tax rates), it's reasonable to wonder whether that era is coming to a close given the Fed's raising interest rates to fight inflation and the Federal government's need to raise tax revenue to address its ballooning budget deficit. There's also the question of whether long-term equity returns could be significantly lower than we've experienced during the post-WWII era without the boost of lower interest and tax rates.
The key point is that, with so much uncertainty in the economic outlook, it becomes all the more important to recognize and manage the risks inherent in the current environment, perhaps by shifting more assets into shorter-term, less-volatile assets like short-term Treasury bills or even cash (which, thanks to higher interest rates, are yielding significantly more than they did up until recently) or diversifying into assets that are less correlated with other parts of the portfolio (such as reinsurance or secured private debt). Since ultimately, while neither advisors nor their clients may be able to control the more considerable forces that shape economic conditions today, they can recognize and (at least to some extent) control which risks they're exposed to and manage those risks to stay protected and on track for the long term!
The U.S. continues to be a tale of 2 economies, with the services sector showing growth and the manufacturing sector indicating a recession. On the inflation front, progress has been made. However, there are clouds on the horizon, so it's too early to declare victory. There is also a longer-term threat to economic growth: the unsustainable path of U.S. fiscal policy.
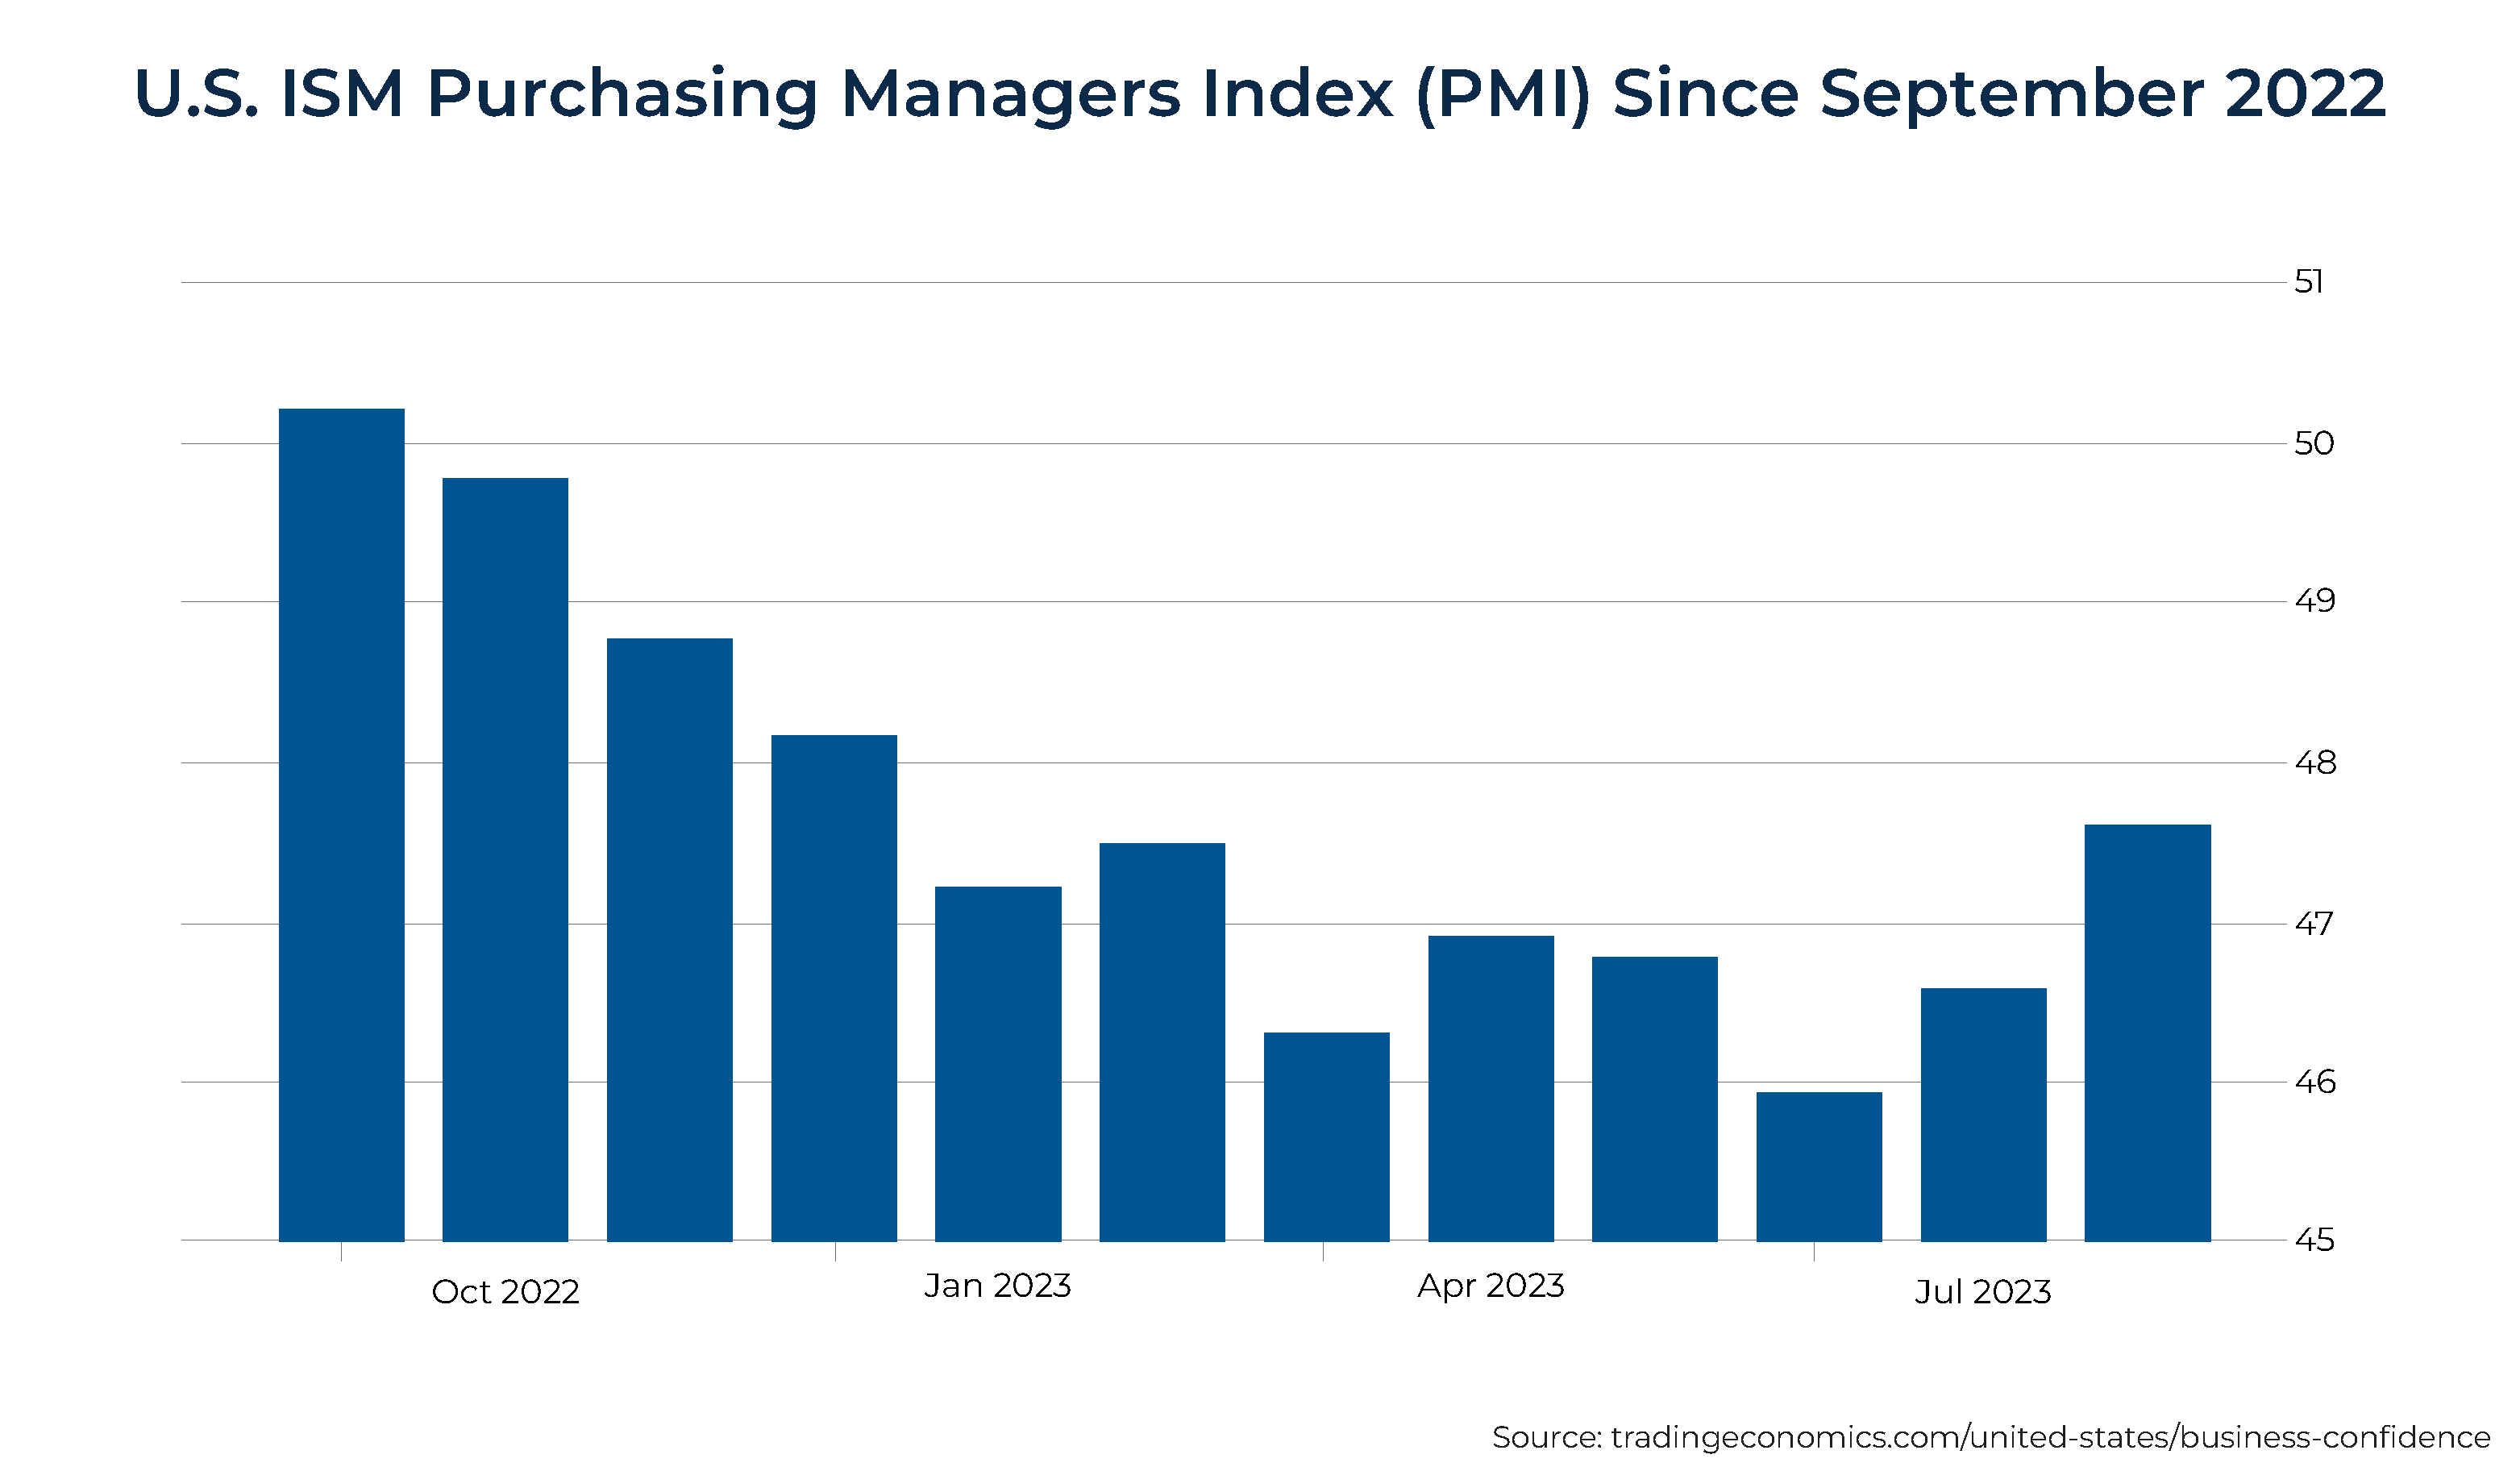
The manufacturing sector has been in recession since November 2022 as the Fed's aggressive rate hikes cool the interest-sensitive sectors of the economy (such as housing, autos, commercial real estate, manufacturing, and durable goods). As the following chart shows, the U.S. Institute for Supply Management (ISM) Purchasing Managers Index (PMI) has been below 50 (generally accepted threshold signaling a contraction) since November 2022 (10 straight months):
The 'good' news is that today, manufacturing's share of employment is only about 8%. While spending on goods has slowed (as has goods price inflation), spending on services, which are less sensitive to interest rates and constitute about 78% of GDP, continues to be strong even as economic growth has slowed.
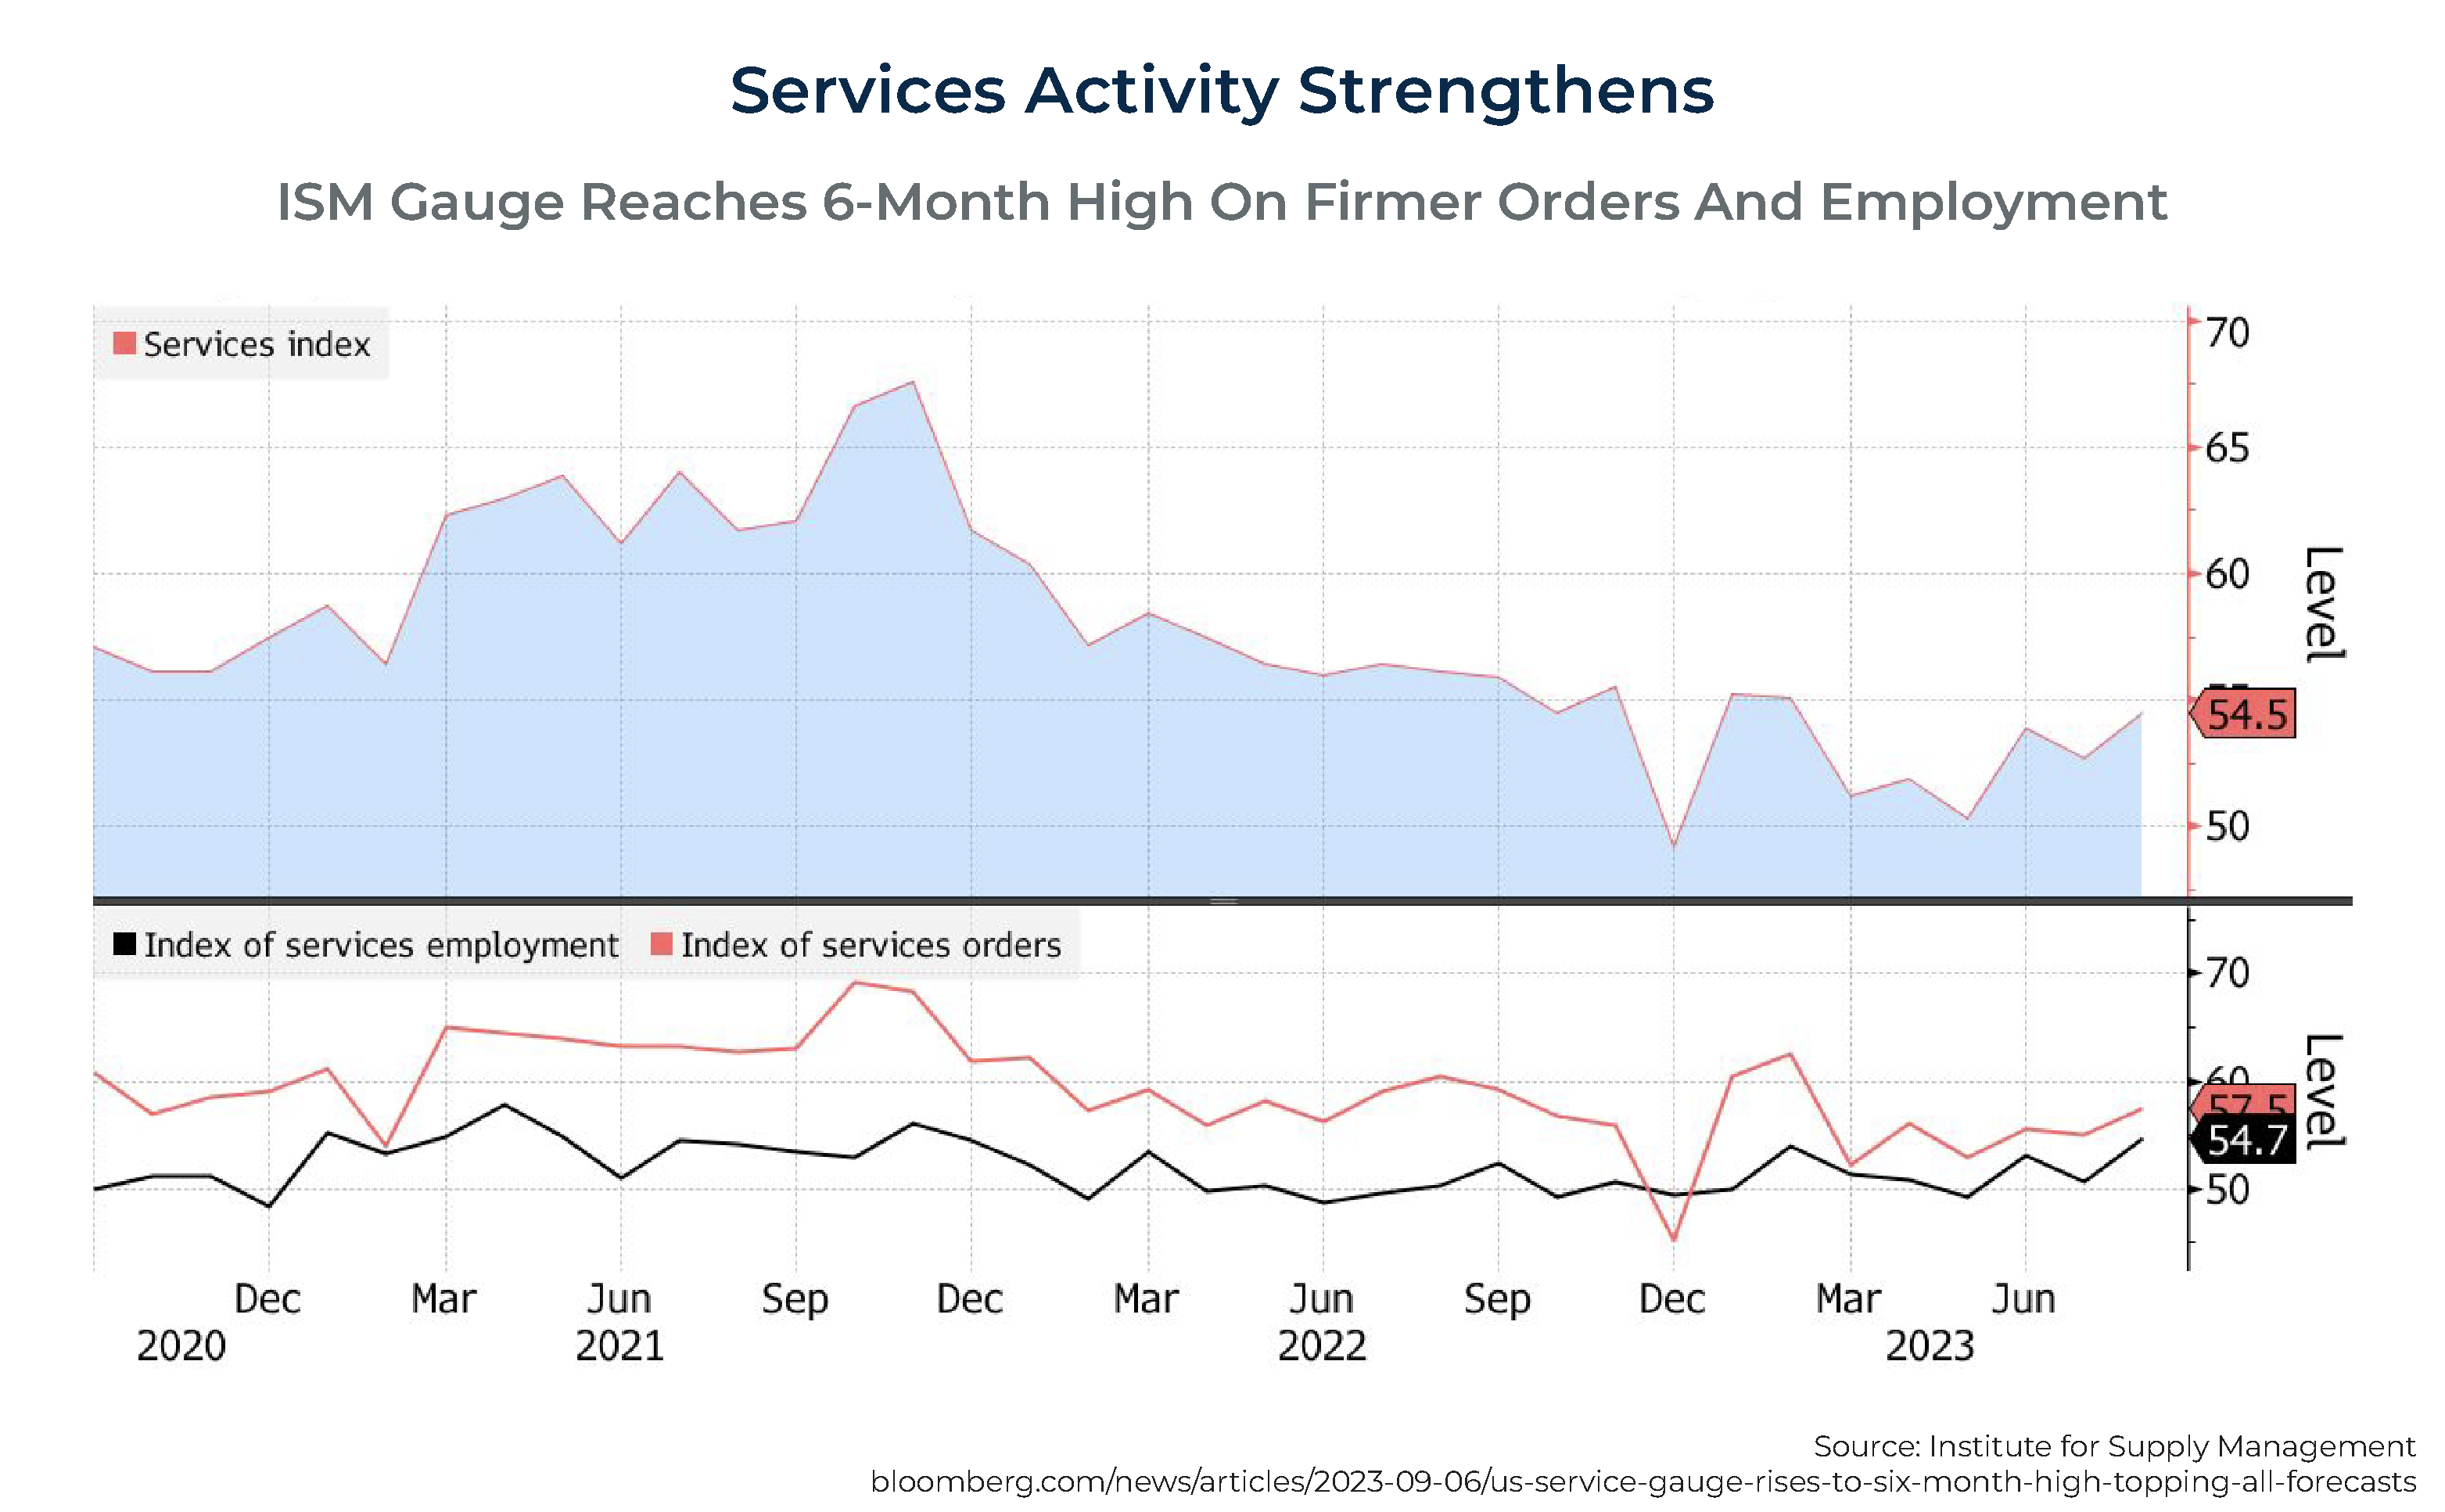
Economic activity in the services sector expanded for the 8th straight month in August, hitting a 6-month high of 54.5 (readings above 50 indicate expansion).
As a result of the strength in the services sector, the rate of increase in prices for services remains well above the Fed's target.
Signs of economic weakness are also a result of the collapse of Silicon Valley Bank, which put pressure on regional banks to tighten credit standards, reducing the availability of credit to small and midsize businesses. However, regional banks account for only about 13% of total lending today, as the private markets have increased lending, offsetting some of that negative impact.
While the U.S. economy is gradually slowing down, it's not happening at the pace needed to get inflation under control. Core CPI inflation is still well above the Federal Reserve's 2% target. Against this backdrop, the expectation should be that the Fed will keep rates elevated for the foreseeable future, raising the risk of a recession.
Impact Of Fed Tightening
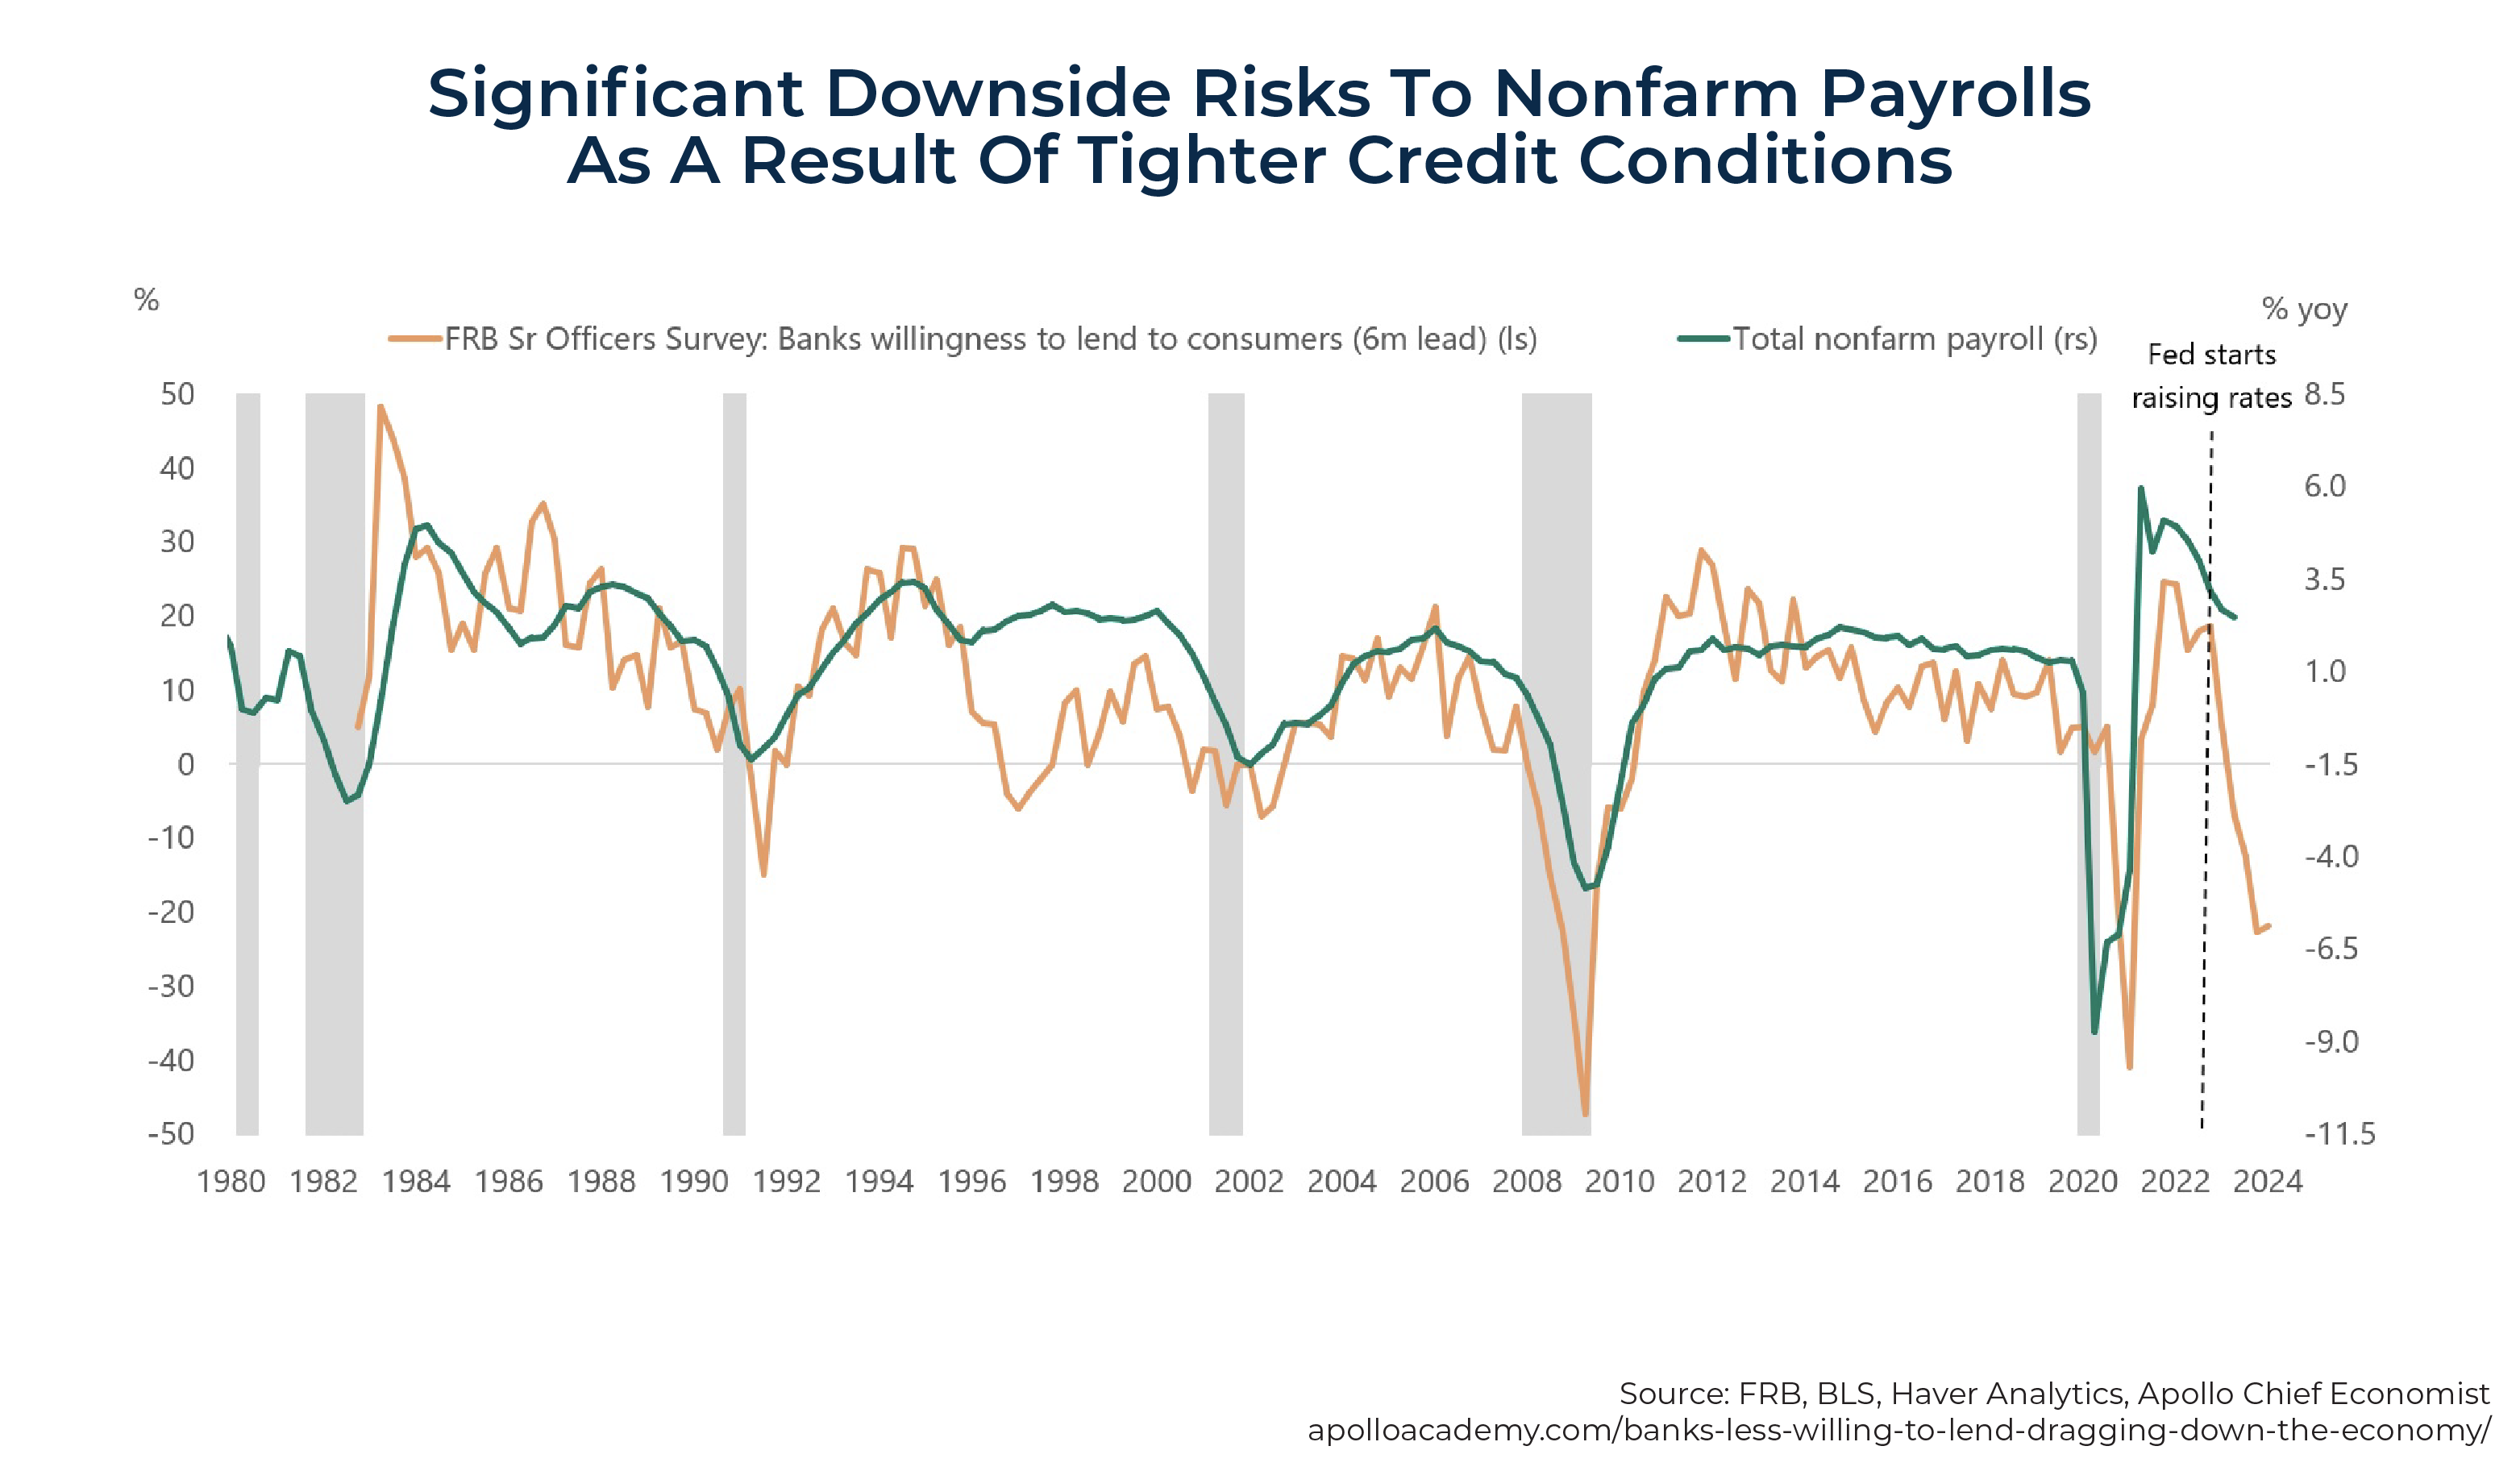
The Fed's hikes in interest rates and its quantitative tightening (reducing its balance sheet) continue to result in a hiring slowdown for both small firms and the broader economy. The labor market is softening, with hours worked, wage growth for job switchers, the number of job openings, and the quits rate all declining; the quits rate, which measures the number of people voluntarily leaving their jobs as a share of total employment, dropped to 2.3% in July, the lowest since the start of 2021. That implies Americans are less confident in their ability to find another job in the current market. In addition, in July, the number of available positions decreased to 8.83 million from 9.17 million in June, marking the 6th decline in the last 7 months. Monetary policy is working by raising the cost of capital, which slows capital expenditures and hiring. Other reasons why the downside risk to nonfarm payrolls is increasing include higher interest rates and tighter lending standards on consumer loans, tighter corporate lending standards, the resumption of student loan repayments, and higher energy prices.
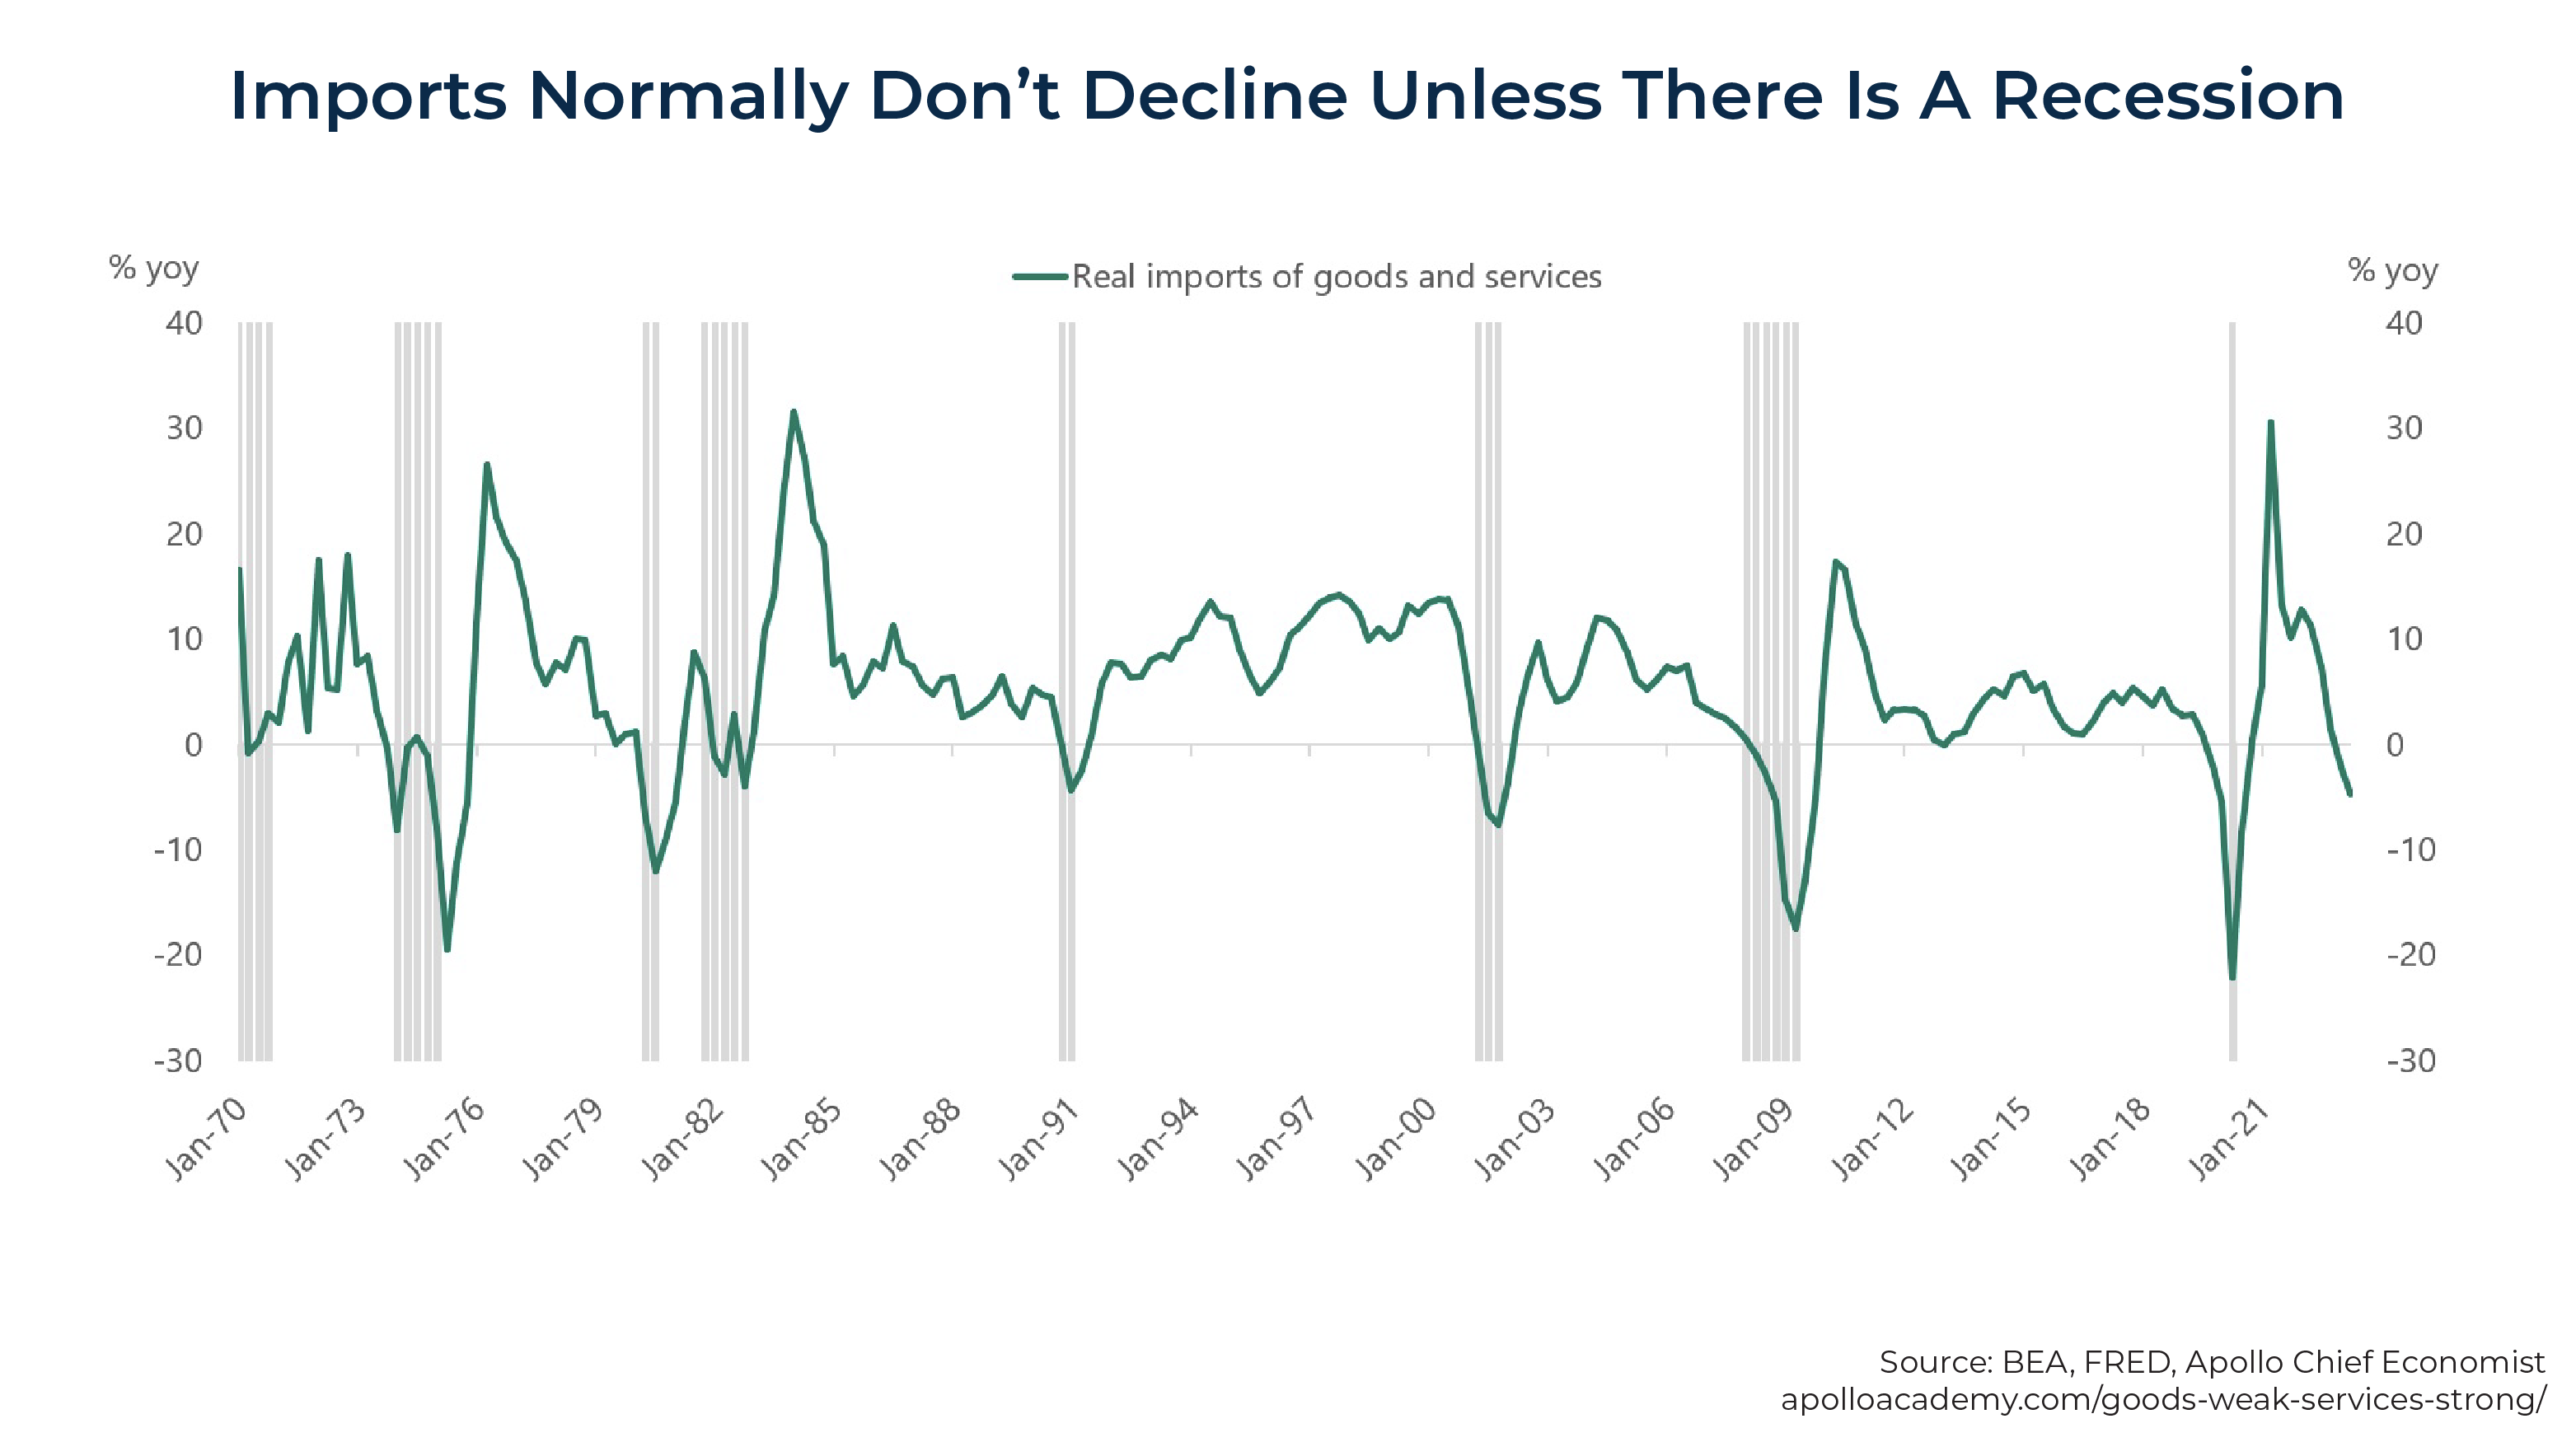
In addition, as can be seen in the chart below, imports are falling, which normally occurs only when the economy is in a recession.
However, the weakness in the goods sector continues to be offset by continued strength in the less interest rate-sensitive services sector, which makes up 80% of GDP.
Monetary policy works by increasing the cost of capital, which slows down capex spending and hiring. With rates likely staying at these levels for a couple of years, this process seems likely to continue. That is why the consensus expects negative nonfarm payrolls for 6 months, from October 2023 to March 2024.
Commercial Real Estate
Some commercial real estate sectors (in particular, offices and retail malls) are under significant distress. Office vacancy rates are on the rise as working from home reduces the need for office space. A July 2023 Bloomberg article stated that "foot traffic near stores in metro areas remains as much as 20% below pre-pandemic levels; lower office attendance is driving down asking rents in real terms; and New York City and San Francisco have seen declines in rents of 18% and 28%, respectively. And things may worsen, with employers set to downsize when long-term leases end."
On the other hand, other sectors are holding up well (data centers, warehouses, hotels, life science centers, multifamily and single-family homes for rent).
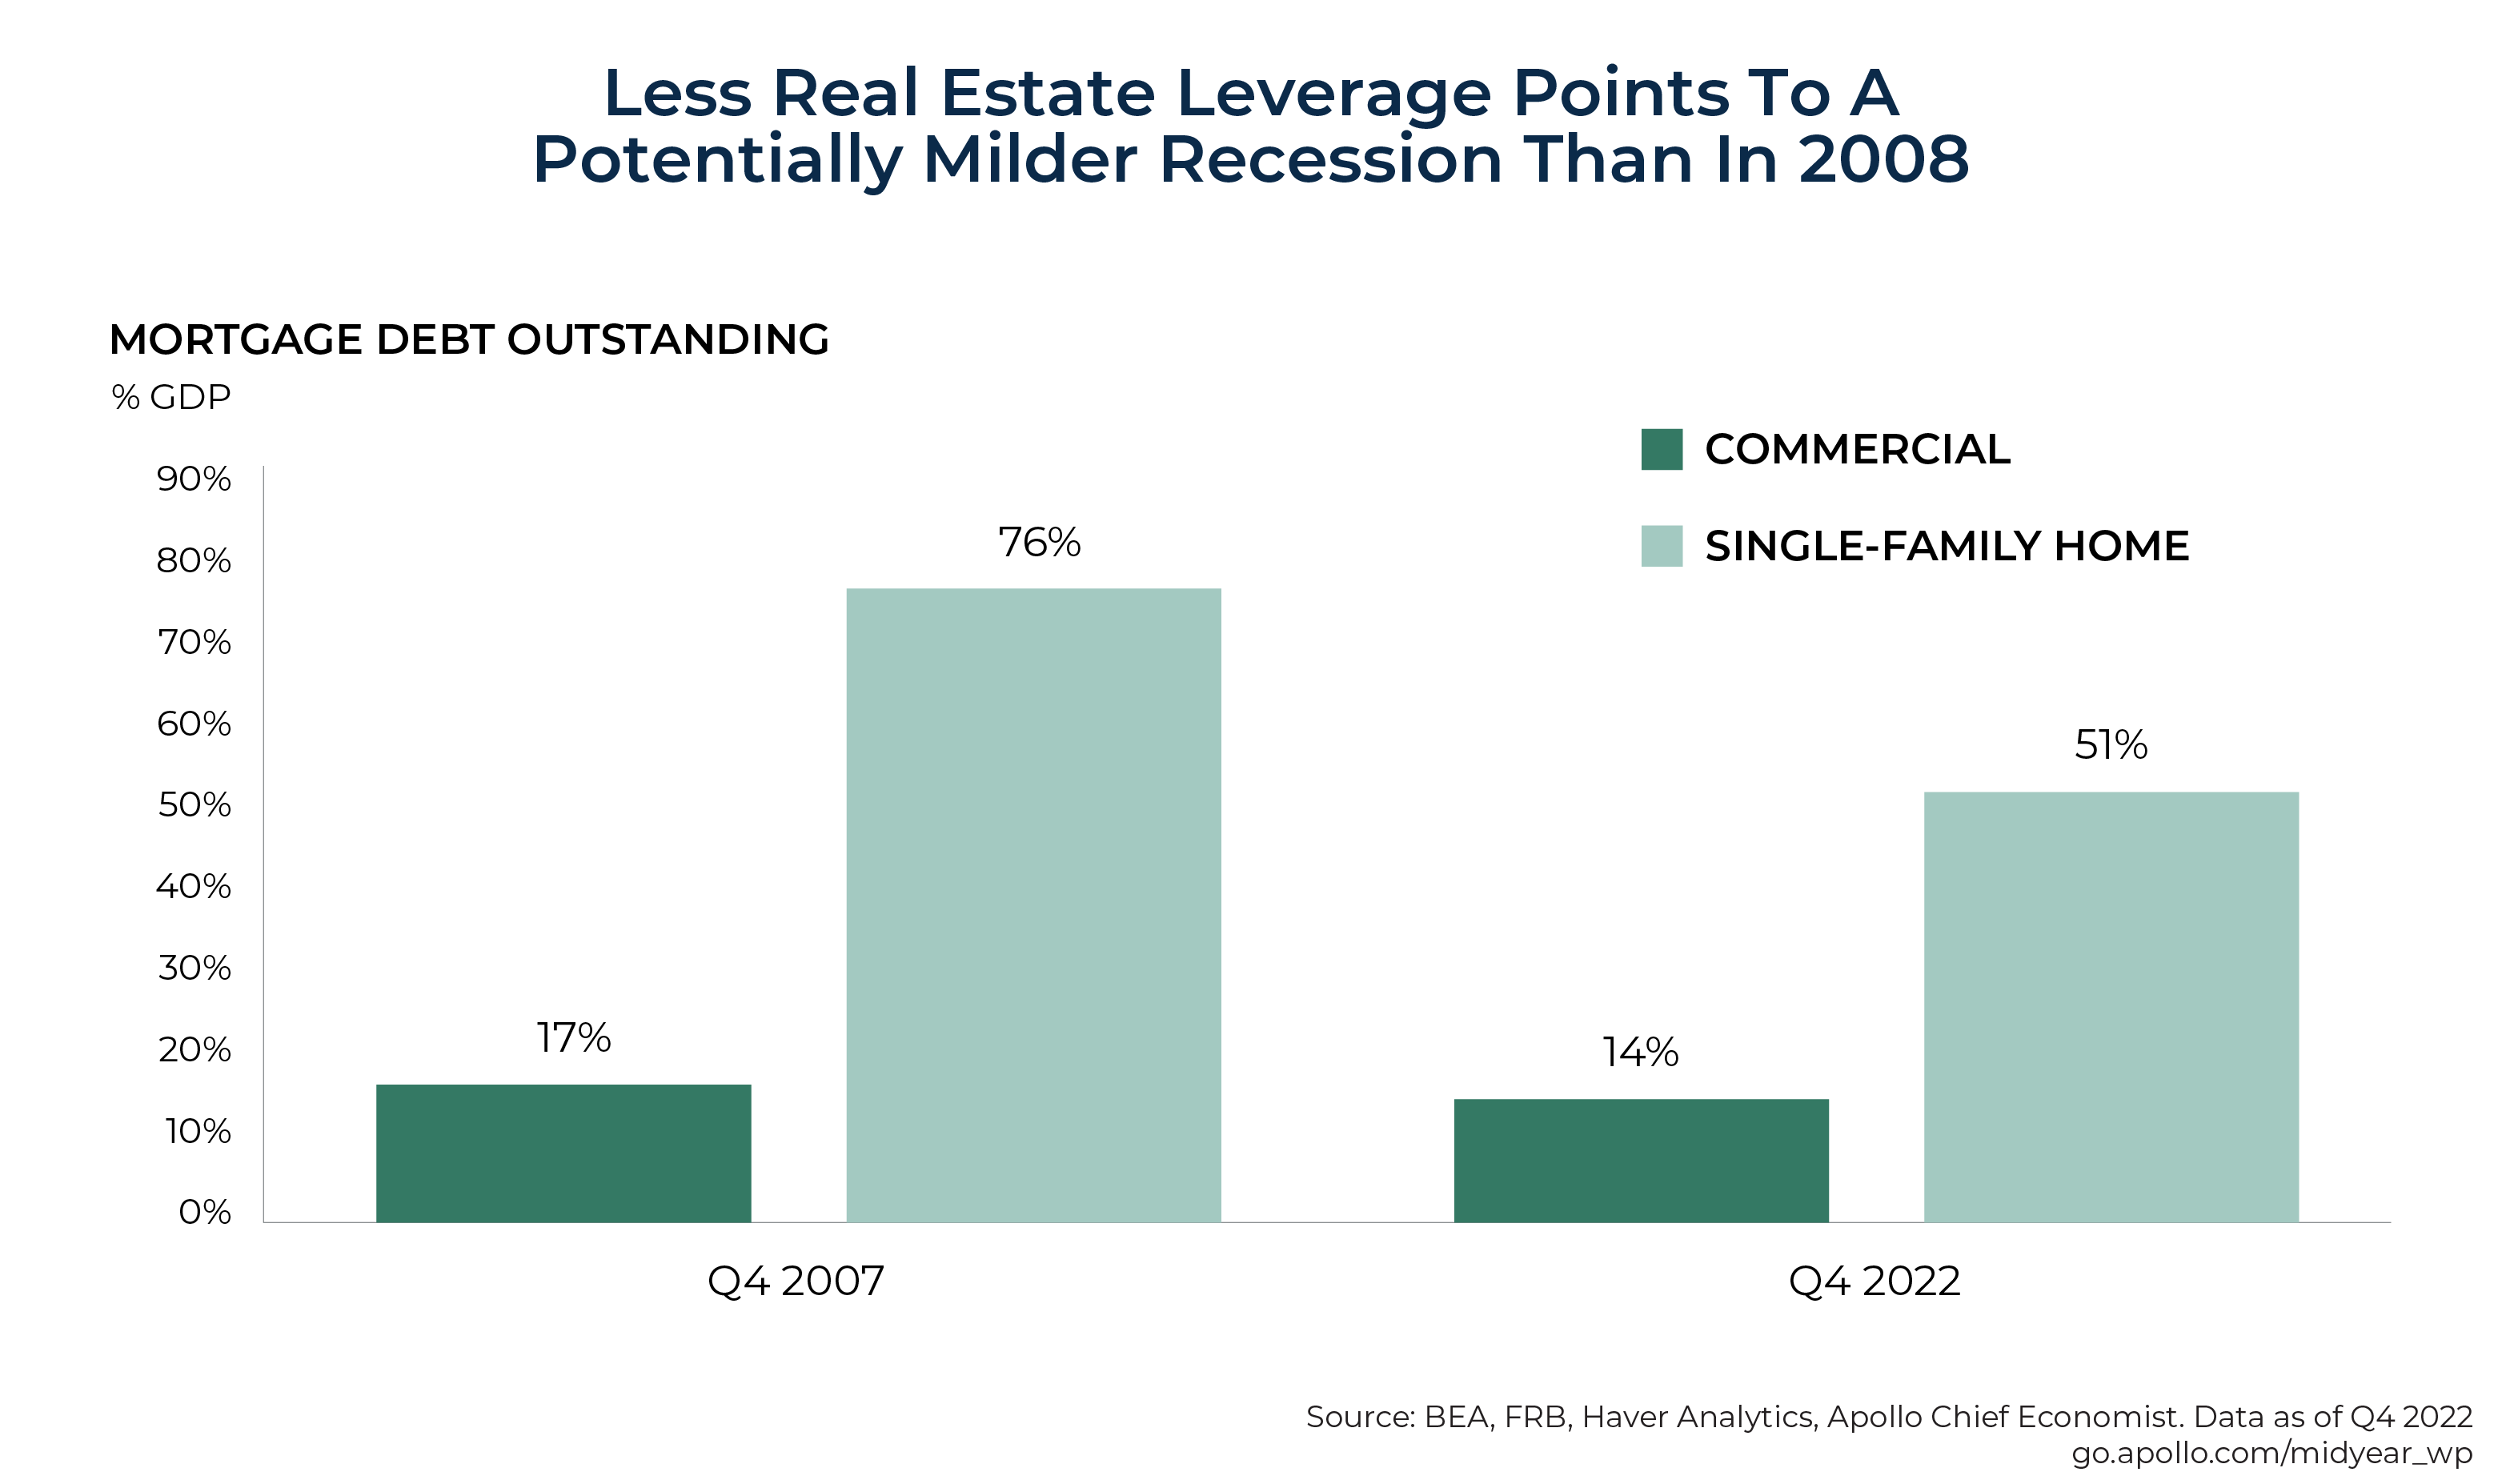
In terms of its impact on the overall economy, commercial real estate is fortunately a much smaller sector than residential housing, the collapse of which led to the Great Recession in 2007. In addition, the amount of commercial mortgage debt is a significantly smaller percentage of GDP than it was in 2007.
Tightening Credit Conditions
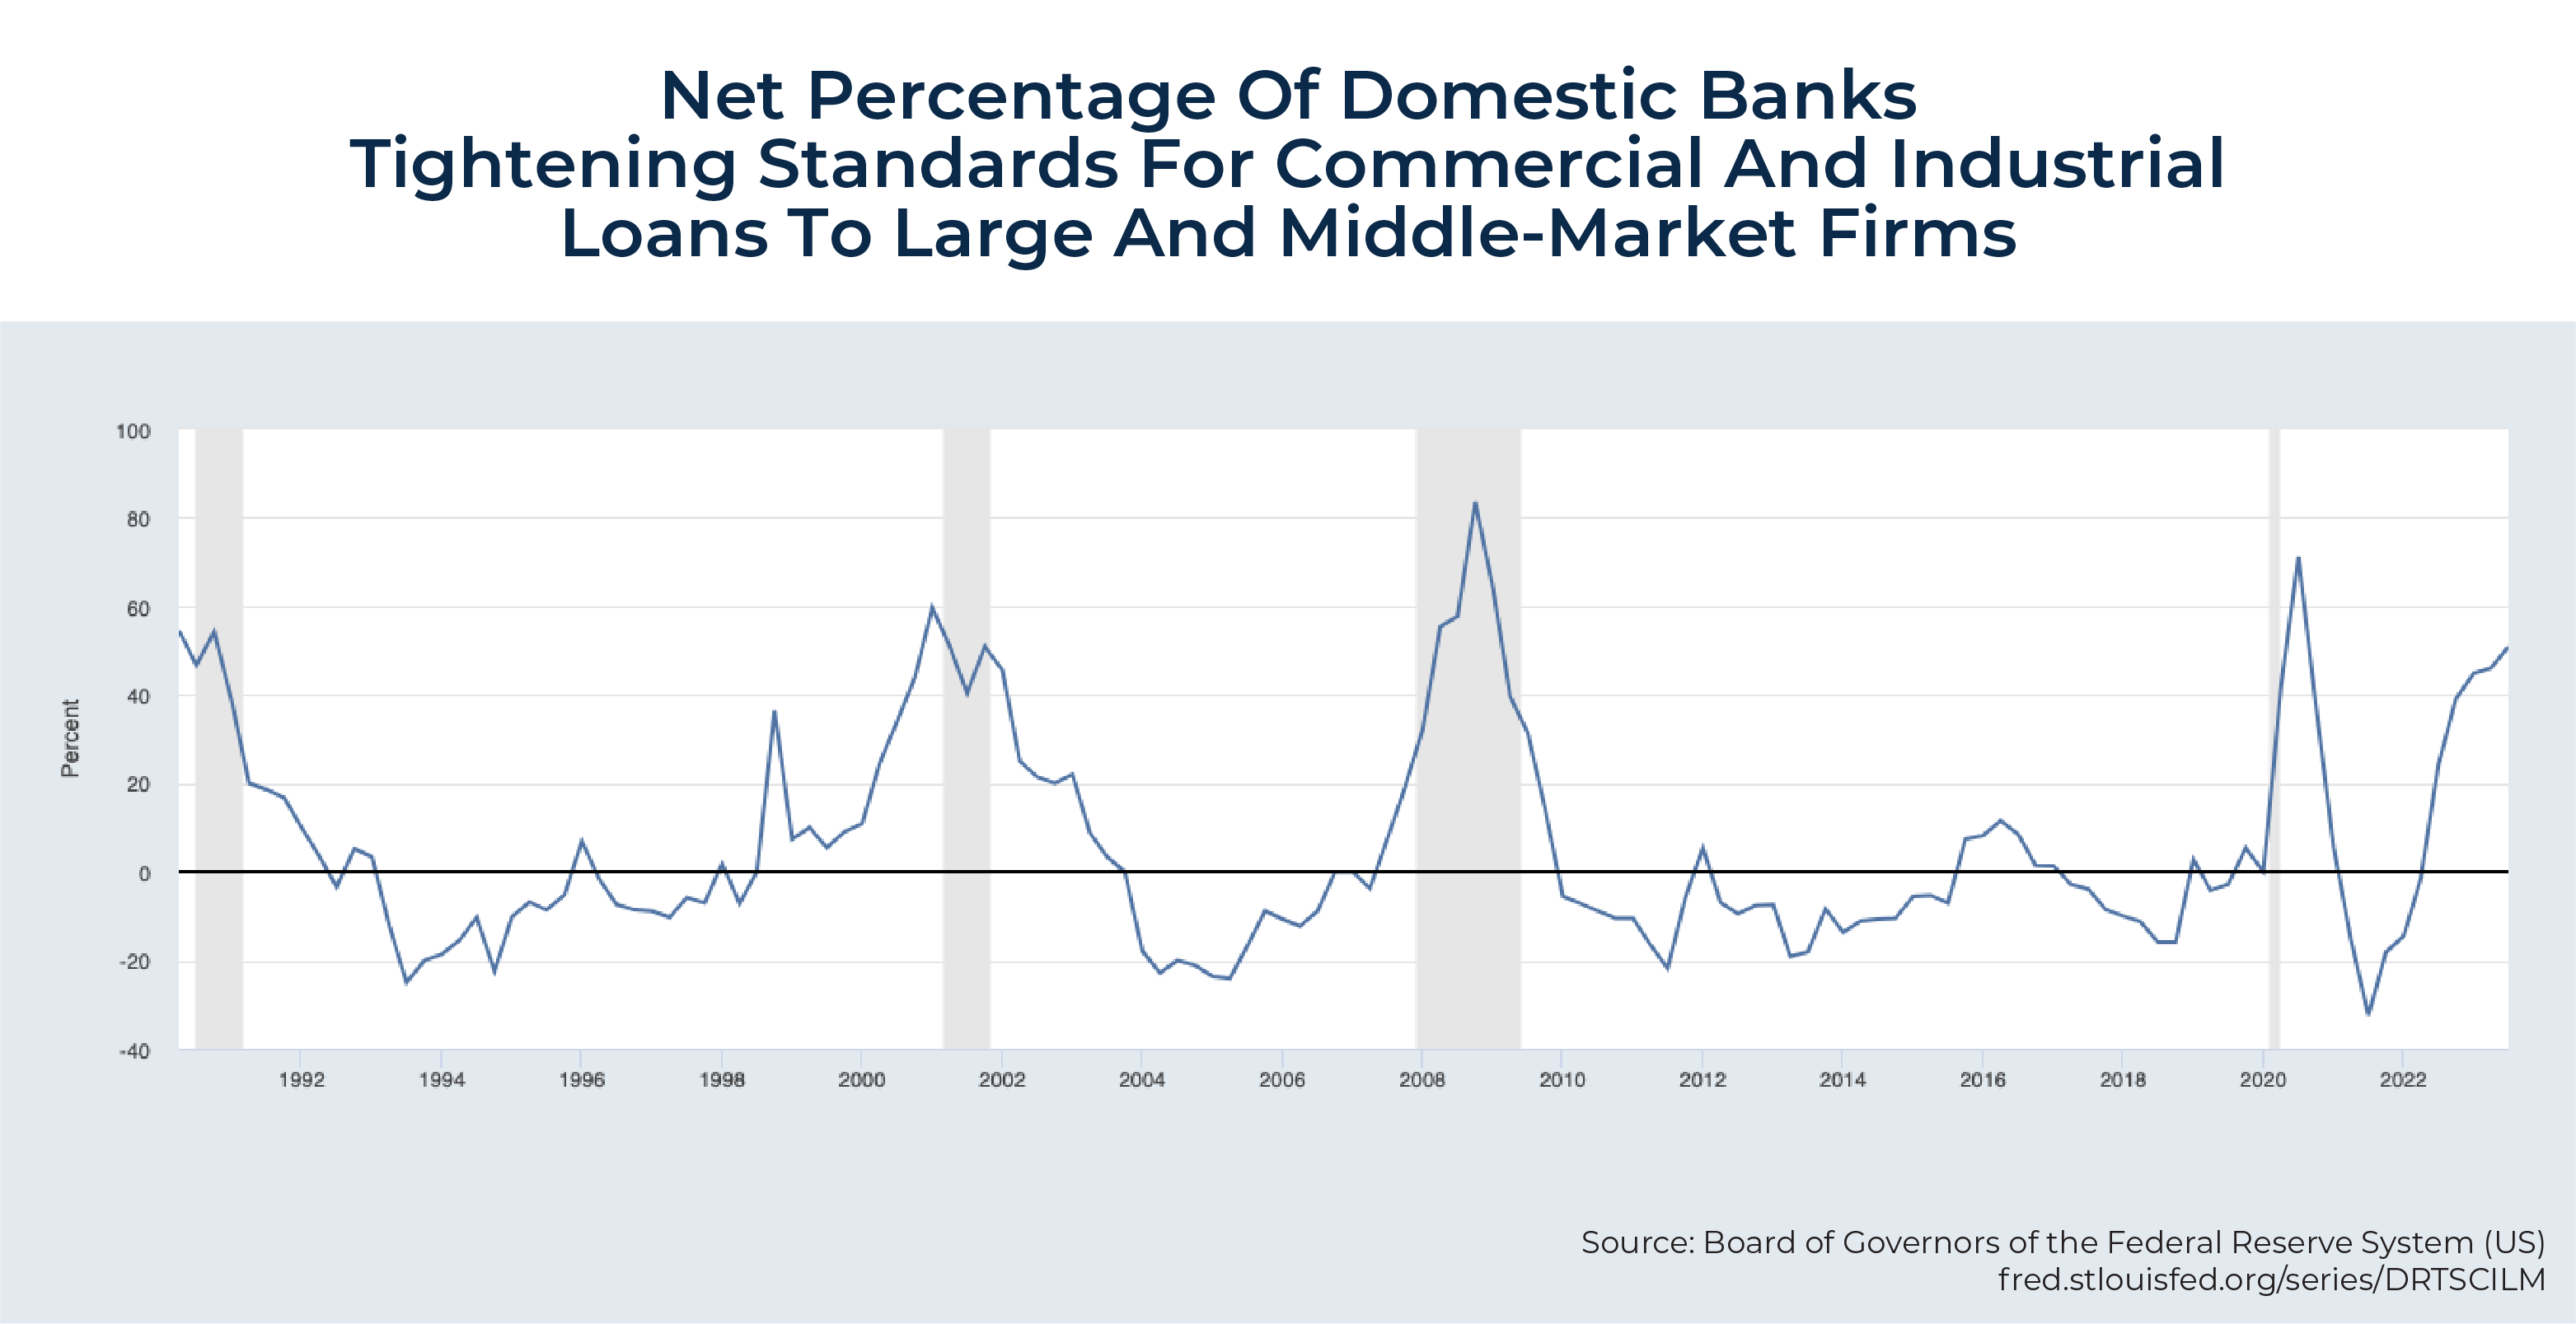
The banking sector has been tightening credit since the collapse of Silicon Valley Bank. The chart below shows a dramatic increase in the percentage of banks that are tightening standards for commercial and industrial loans at or approaching levels associated with prior recessions:
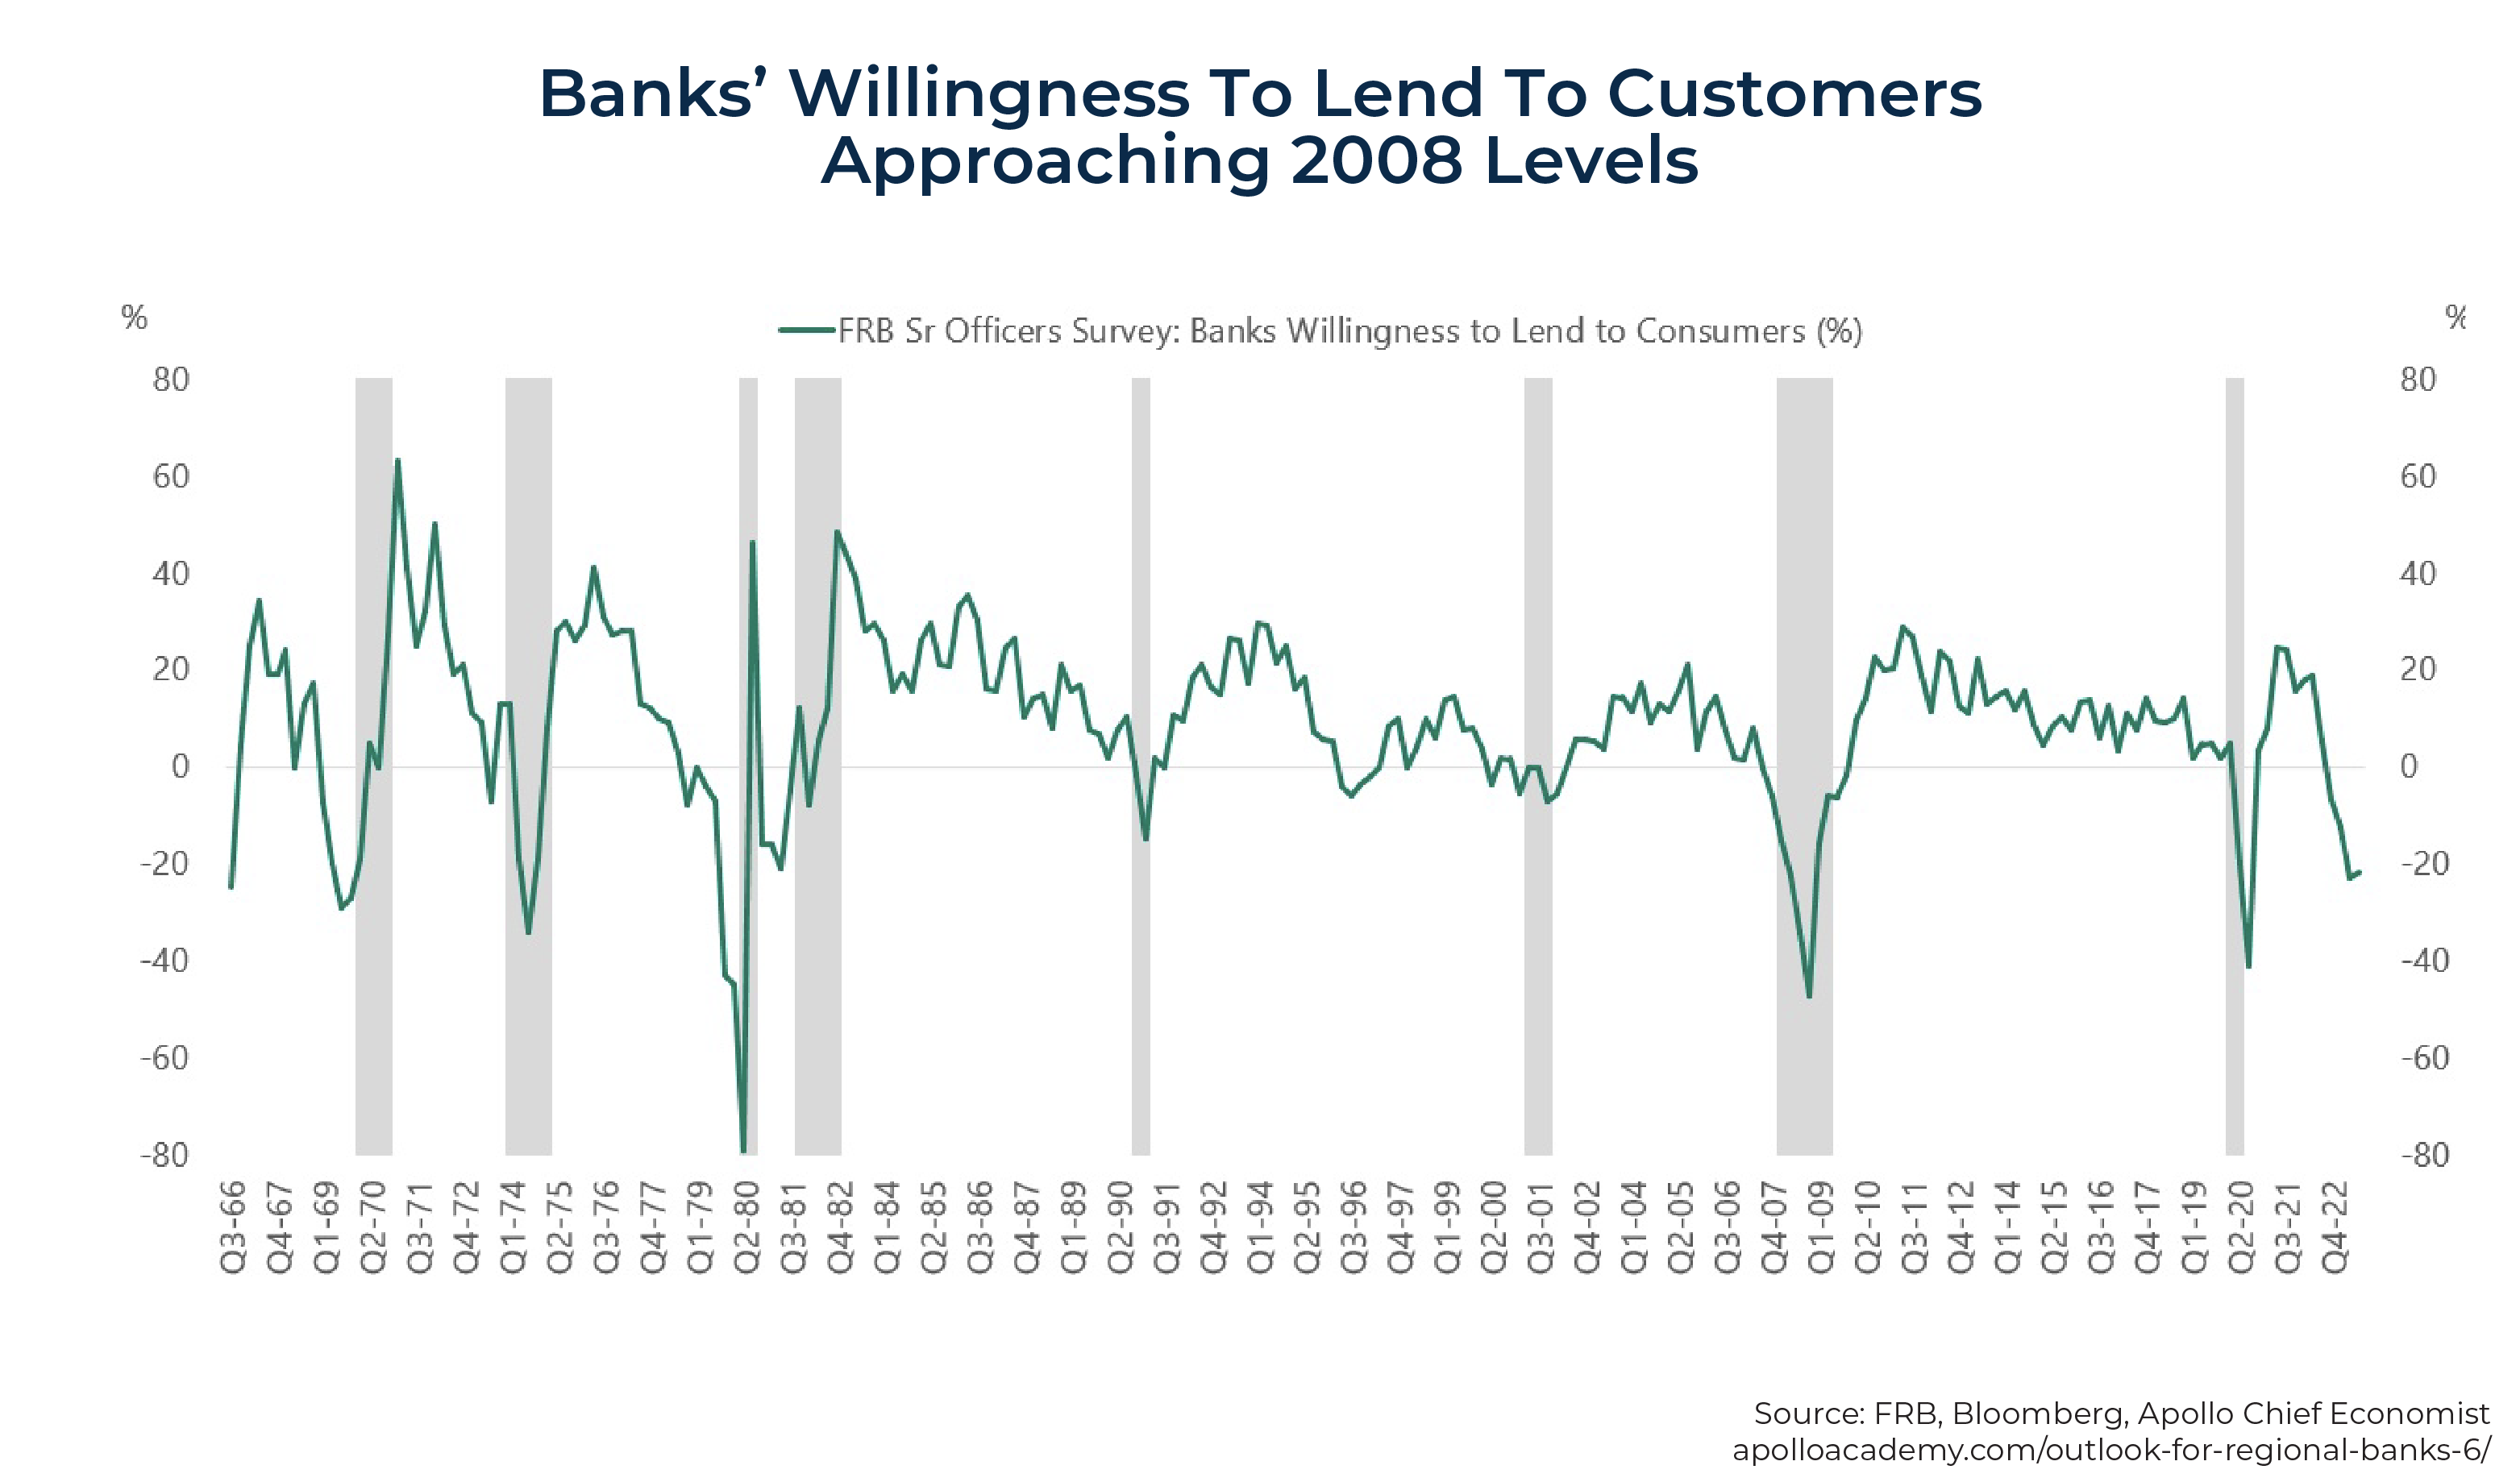
In terms of banks' willingness to lend to consumers, it's approaching 2008 levels:
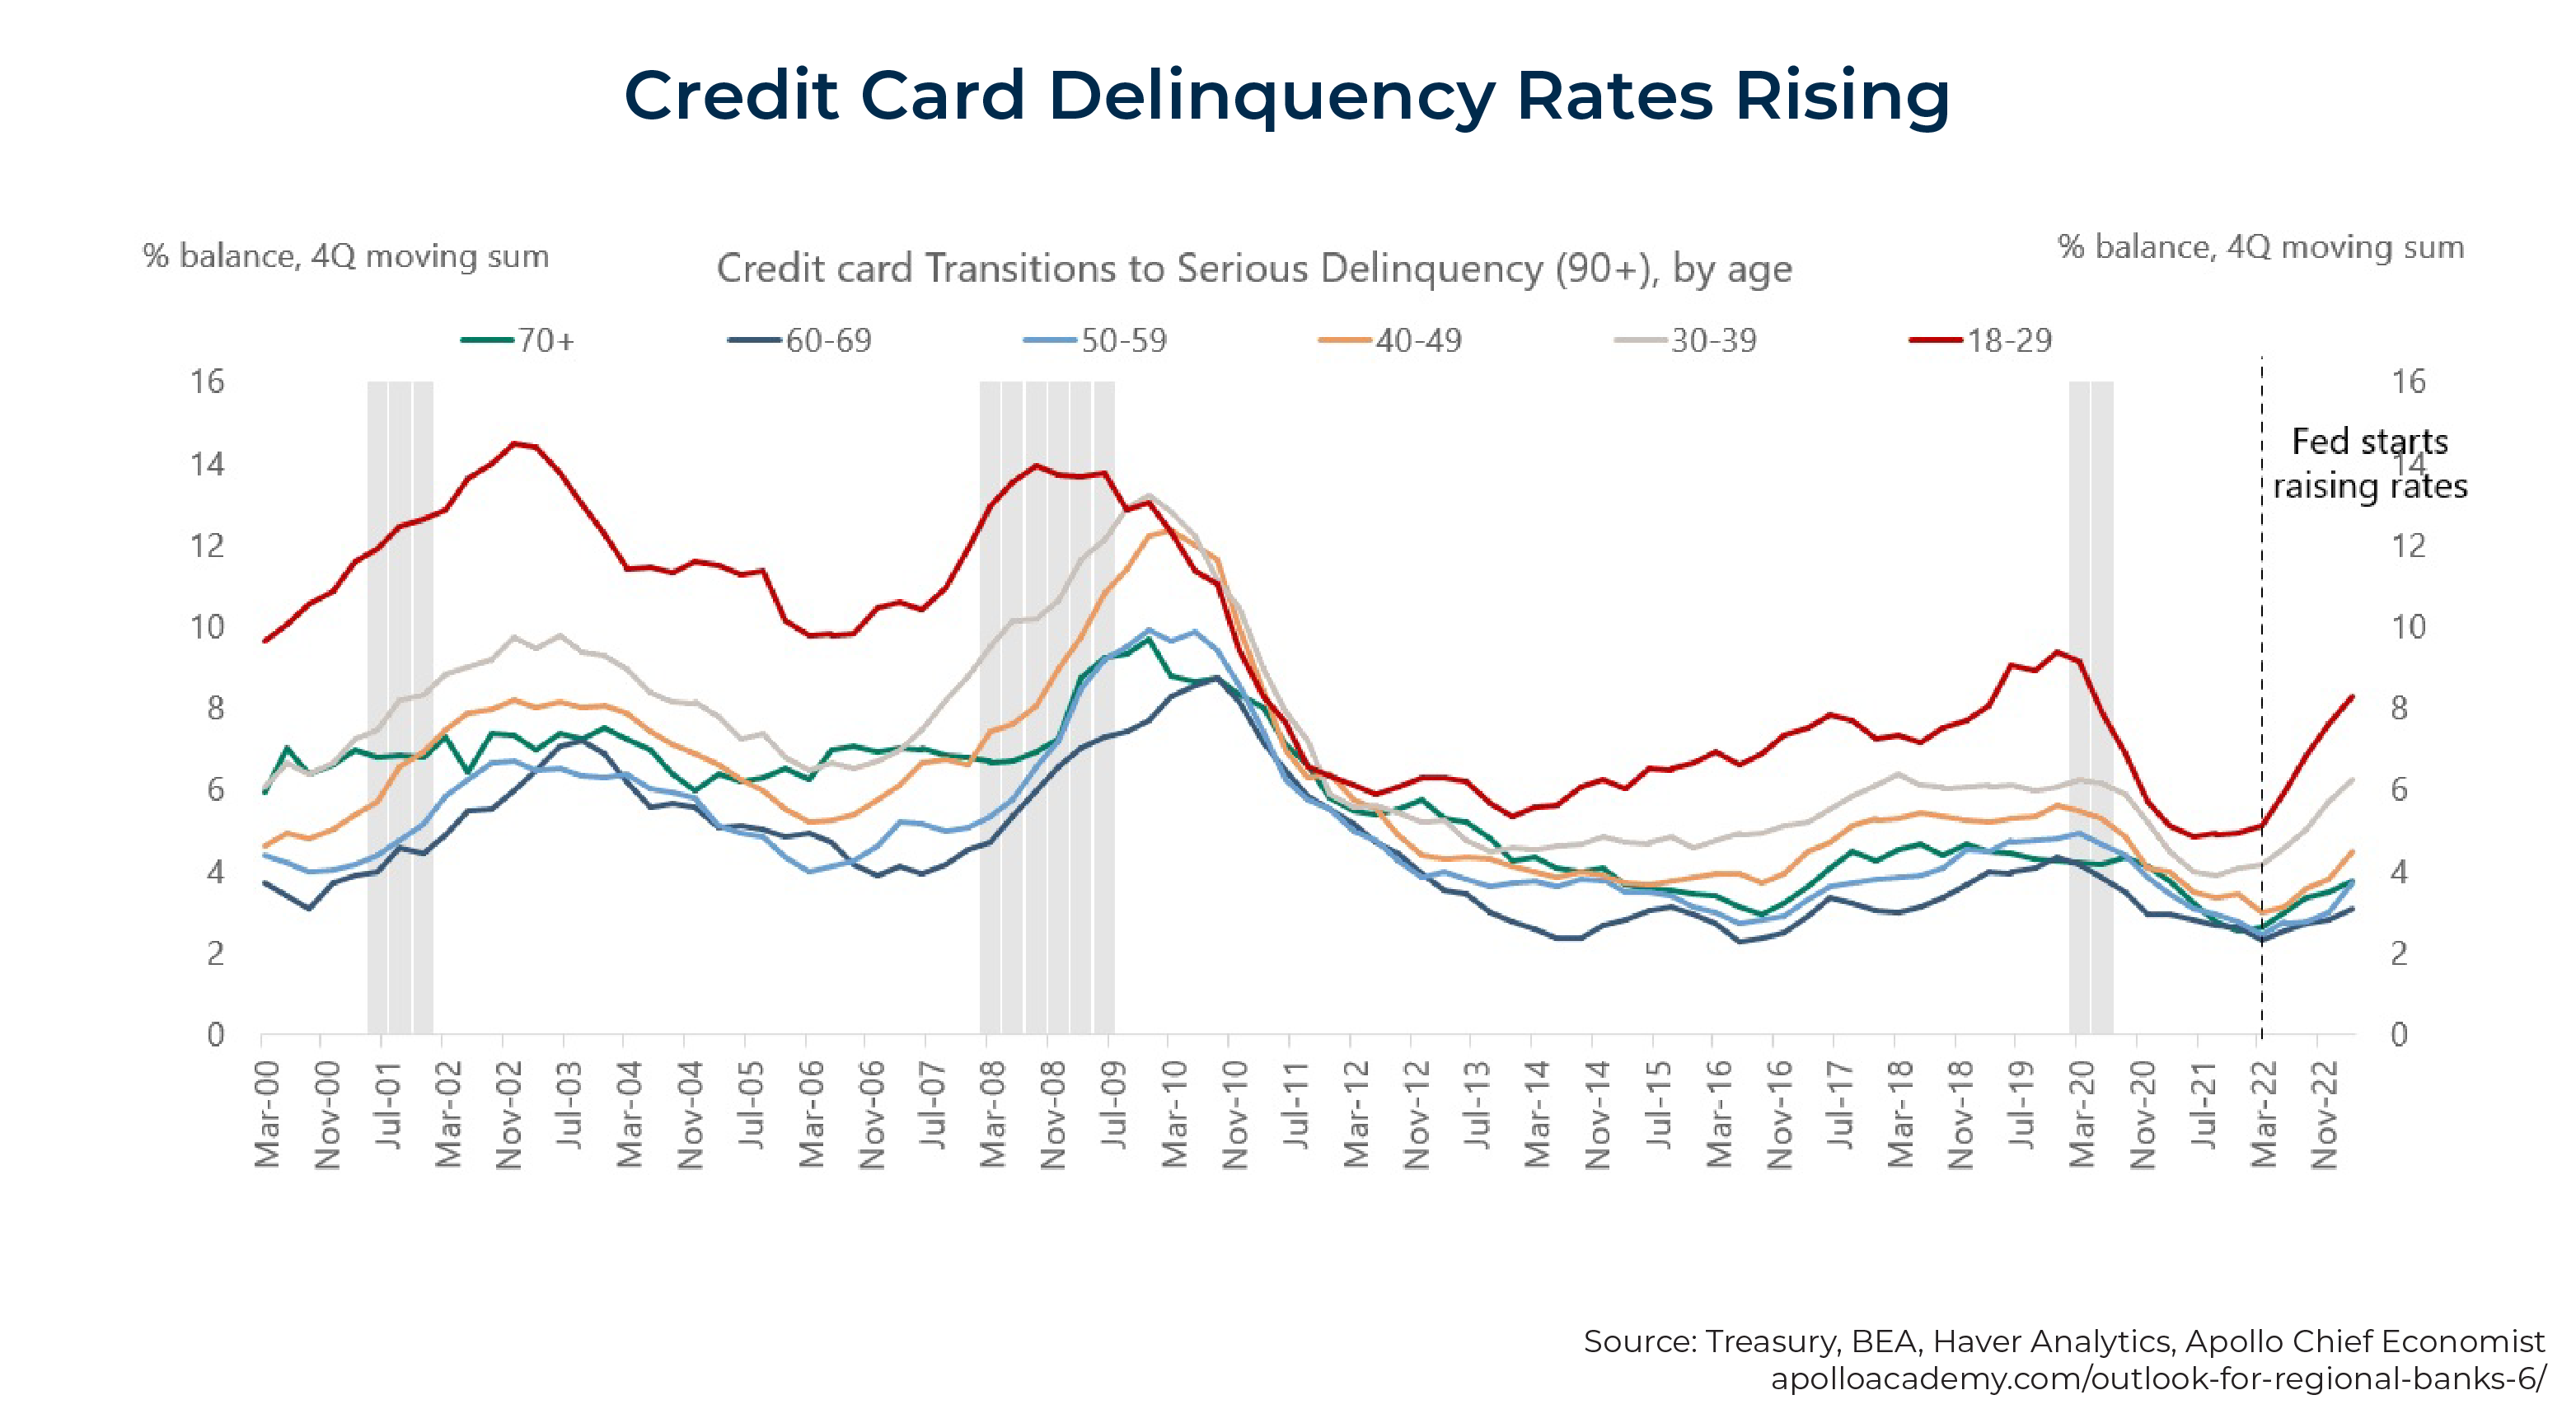
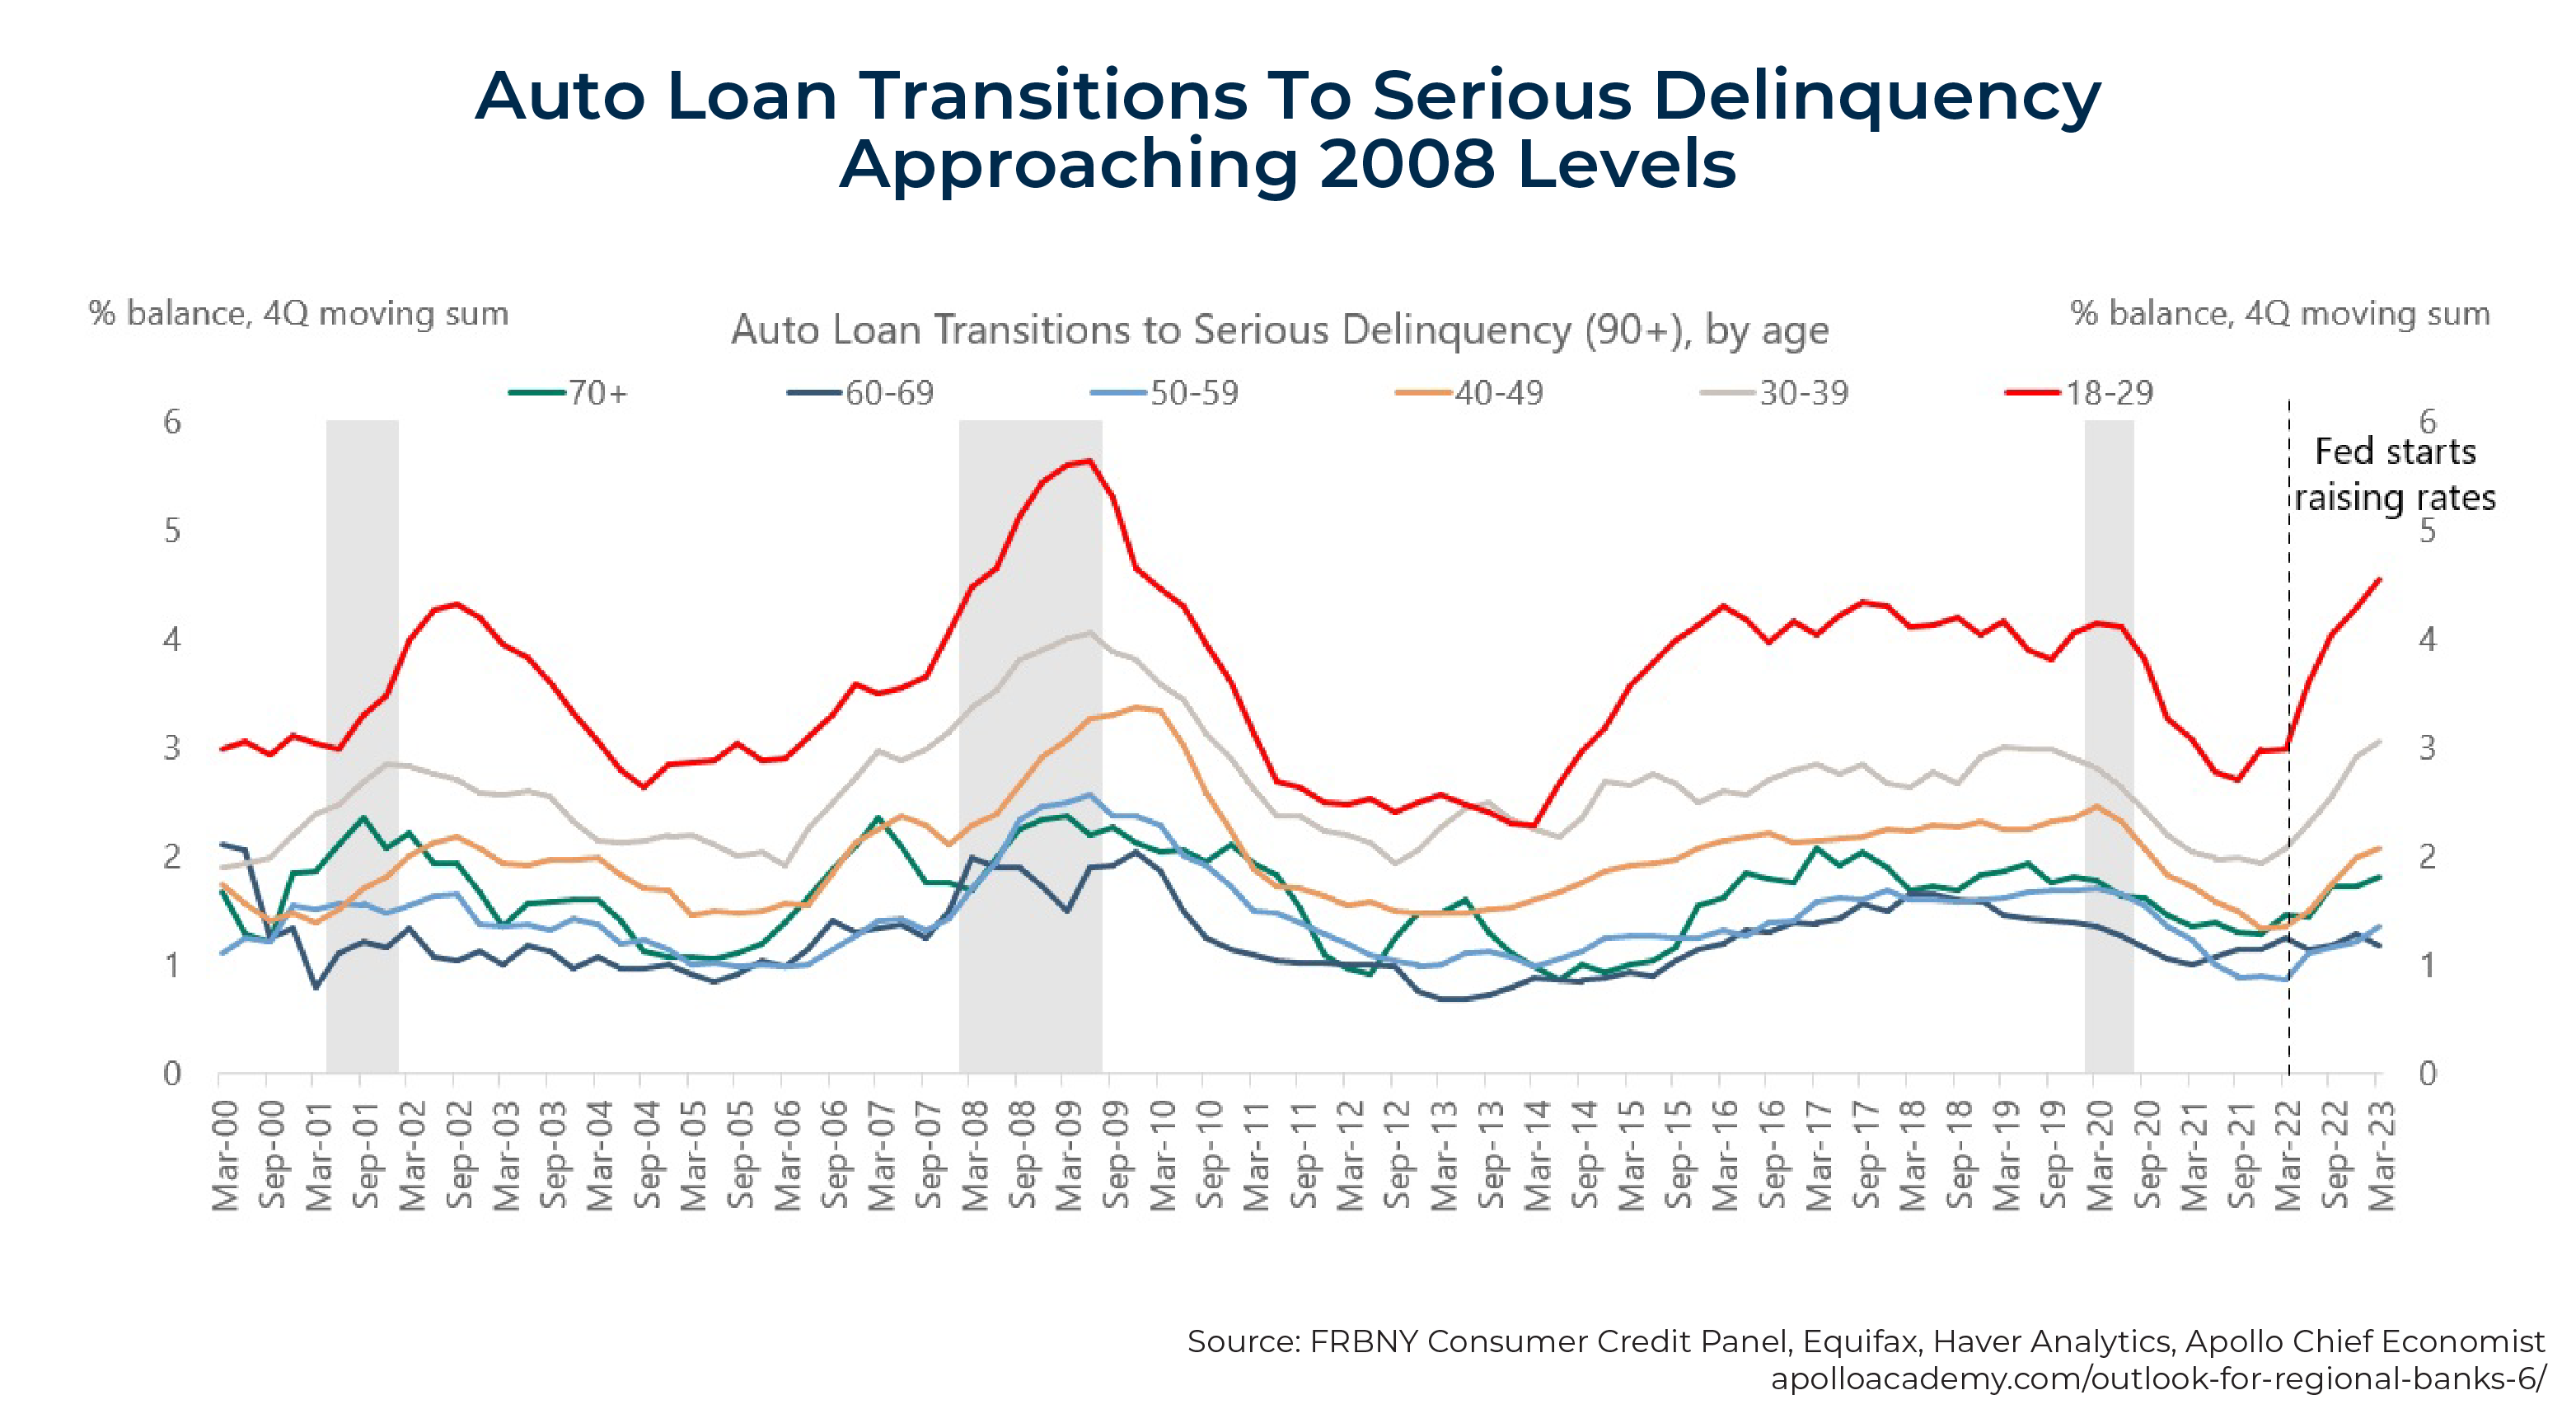
The following 2 charts, which show rising delinquency rates for credit cards and auto loans, help explain the increasing unwillingness of banks to lend to consumers (in addition to the need for banks to raise capital). Tighter credit conditions and rising delinquencies will put a damper on consumer spending.
2 other financial indicators that inform future economic conditions are corporate bond spreads and the slope of the Treasury yield curve (the term spread). Credit spreads anticipate future economic activity because they incorporate expectations of future corporate defaults, which affect corporate profits, employment, and investment.
In addition, a deterioration in the capital position of financial intermediaries leads to a reduction in the supply of credit, causing higher costs of debt financing (and thus a widening of credit spreads) followed by lower levels of spending and production. Research has found that credit spreads have considerable predictive power for economic activity.
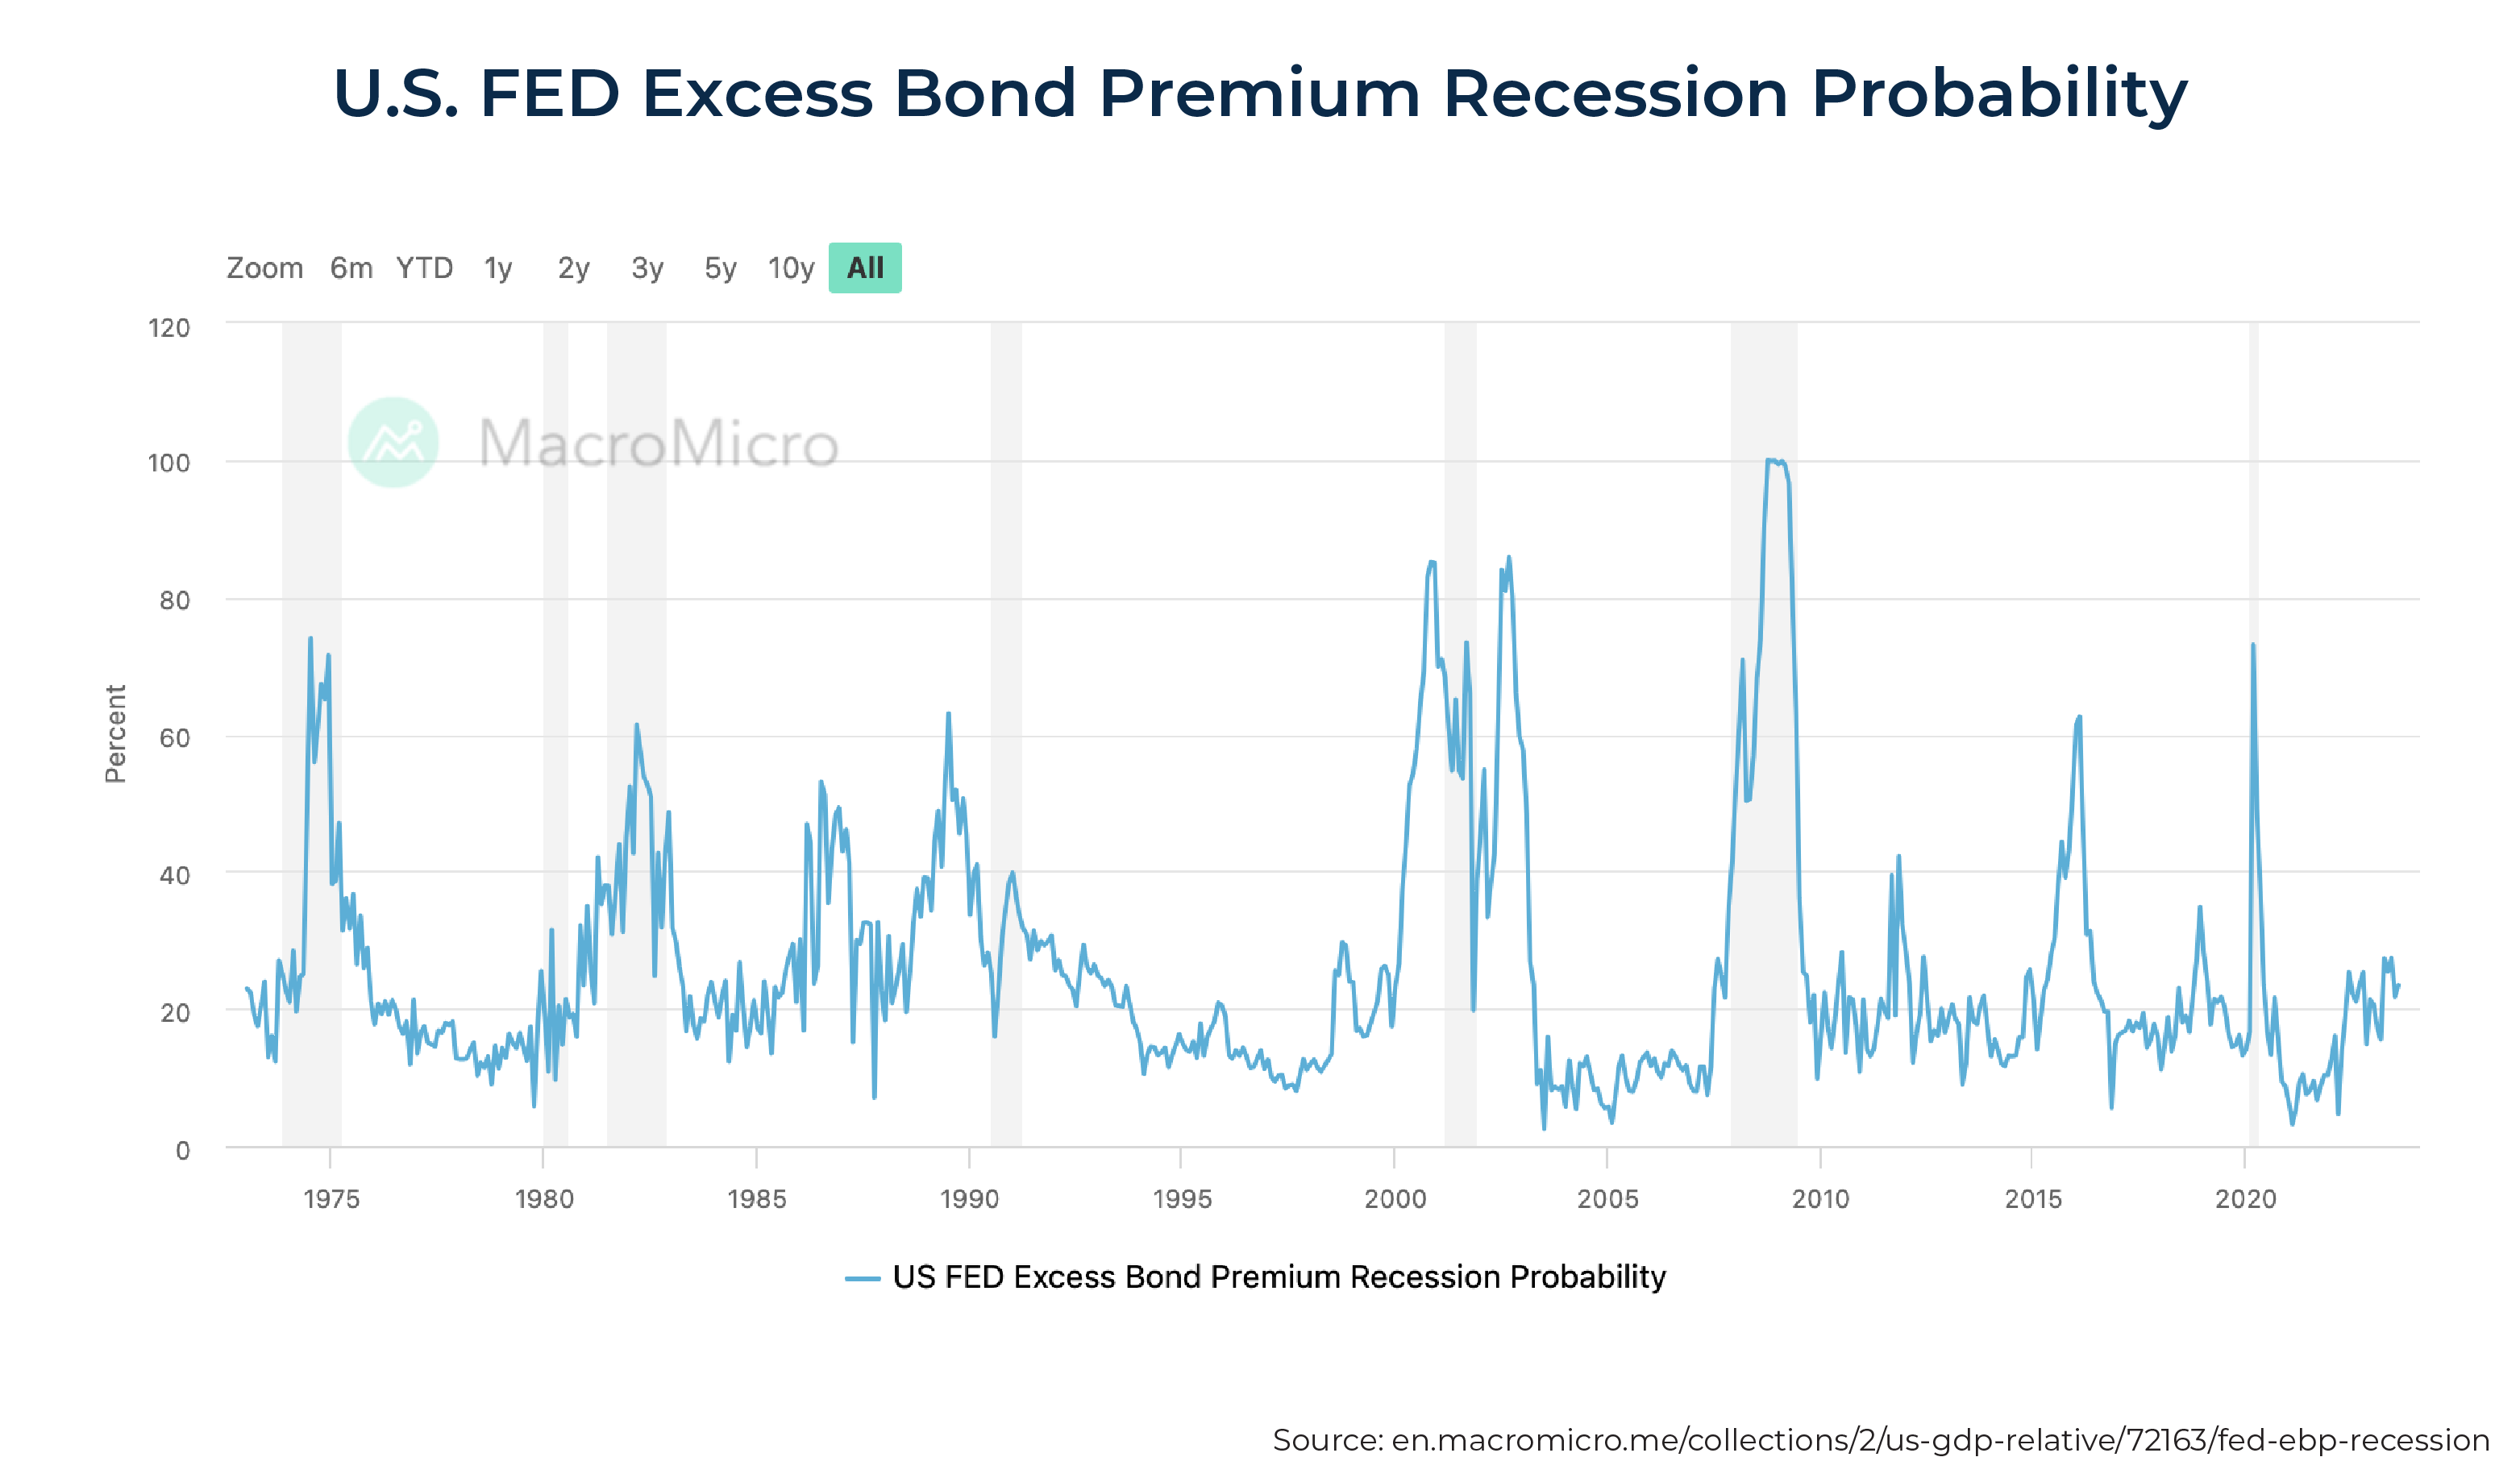
Further research presented in a 2016 Federal Reserve working paper by Giovanni Favara et al. notes that the 'Excess Bond Premium' (EBP) "tries to capture the variation in the average price of bearing U.S. corporate credit risk – above and beyond the compensation that investors in the corporate bond market require for expected defaults."
As seen in the chart below, EBP suggests that the probability of a recession in the next 12 months has been rising:
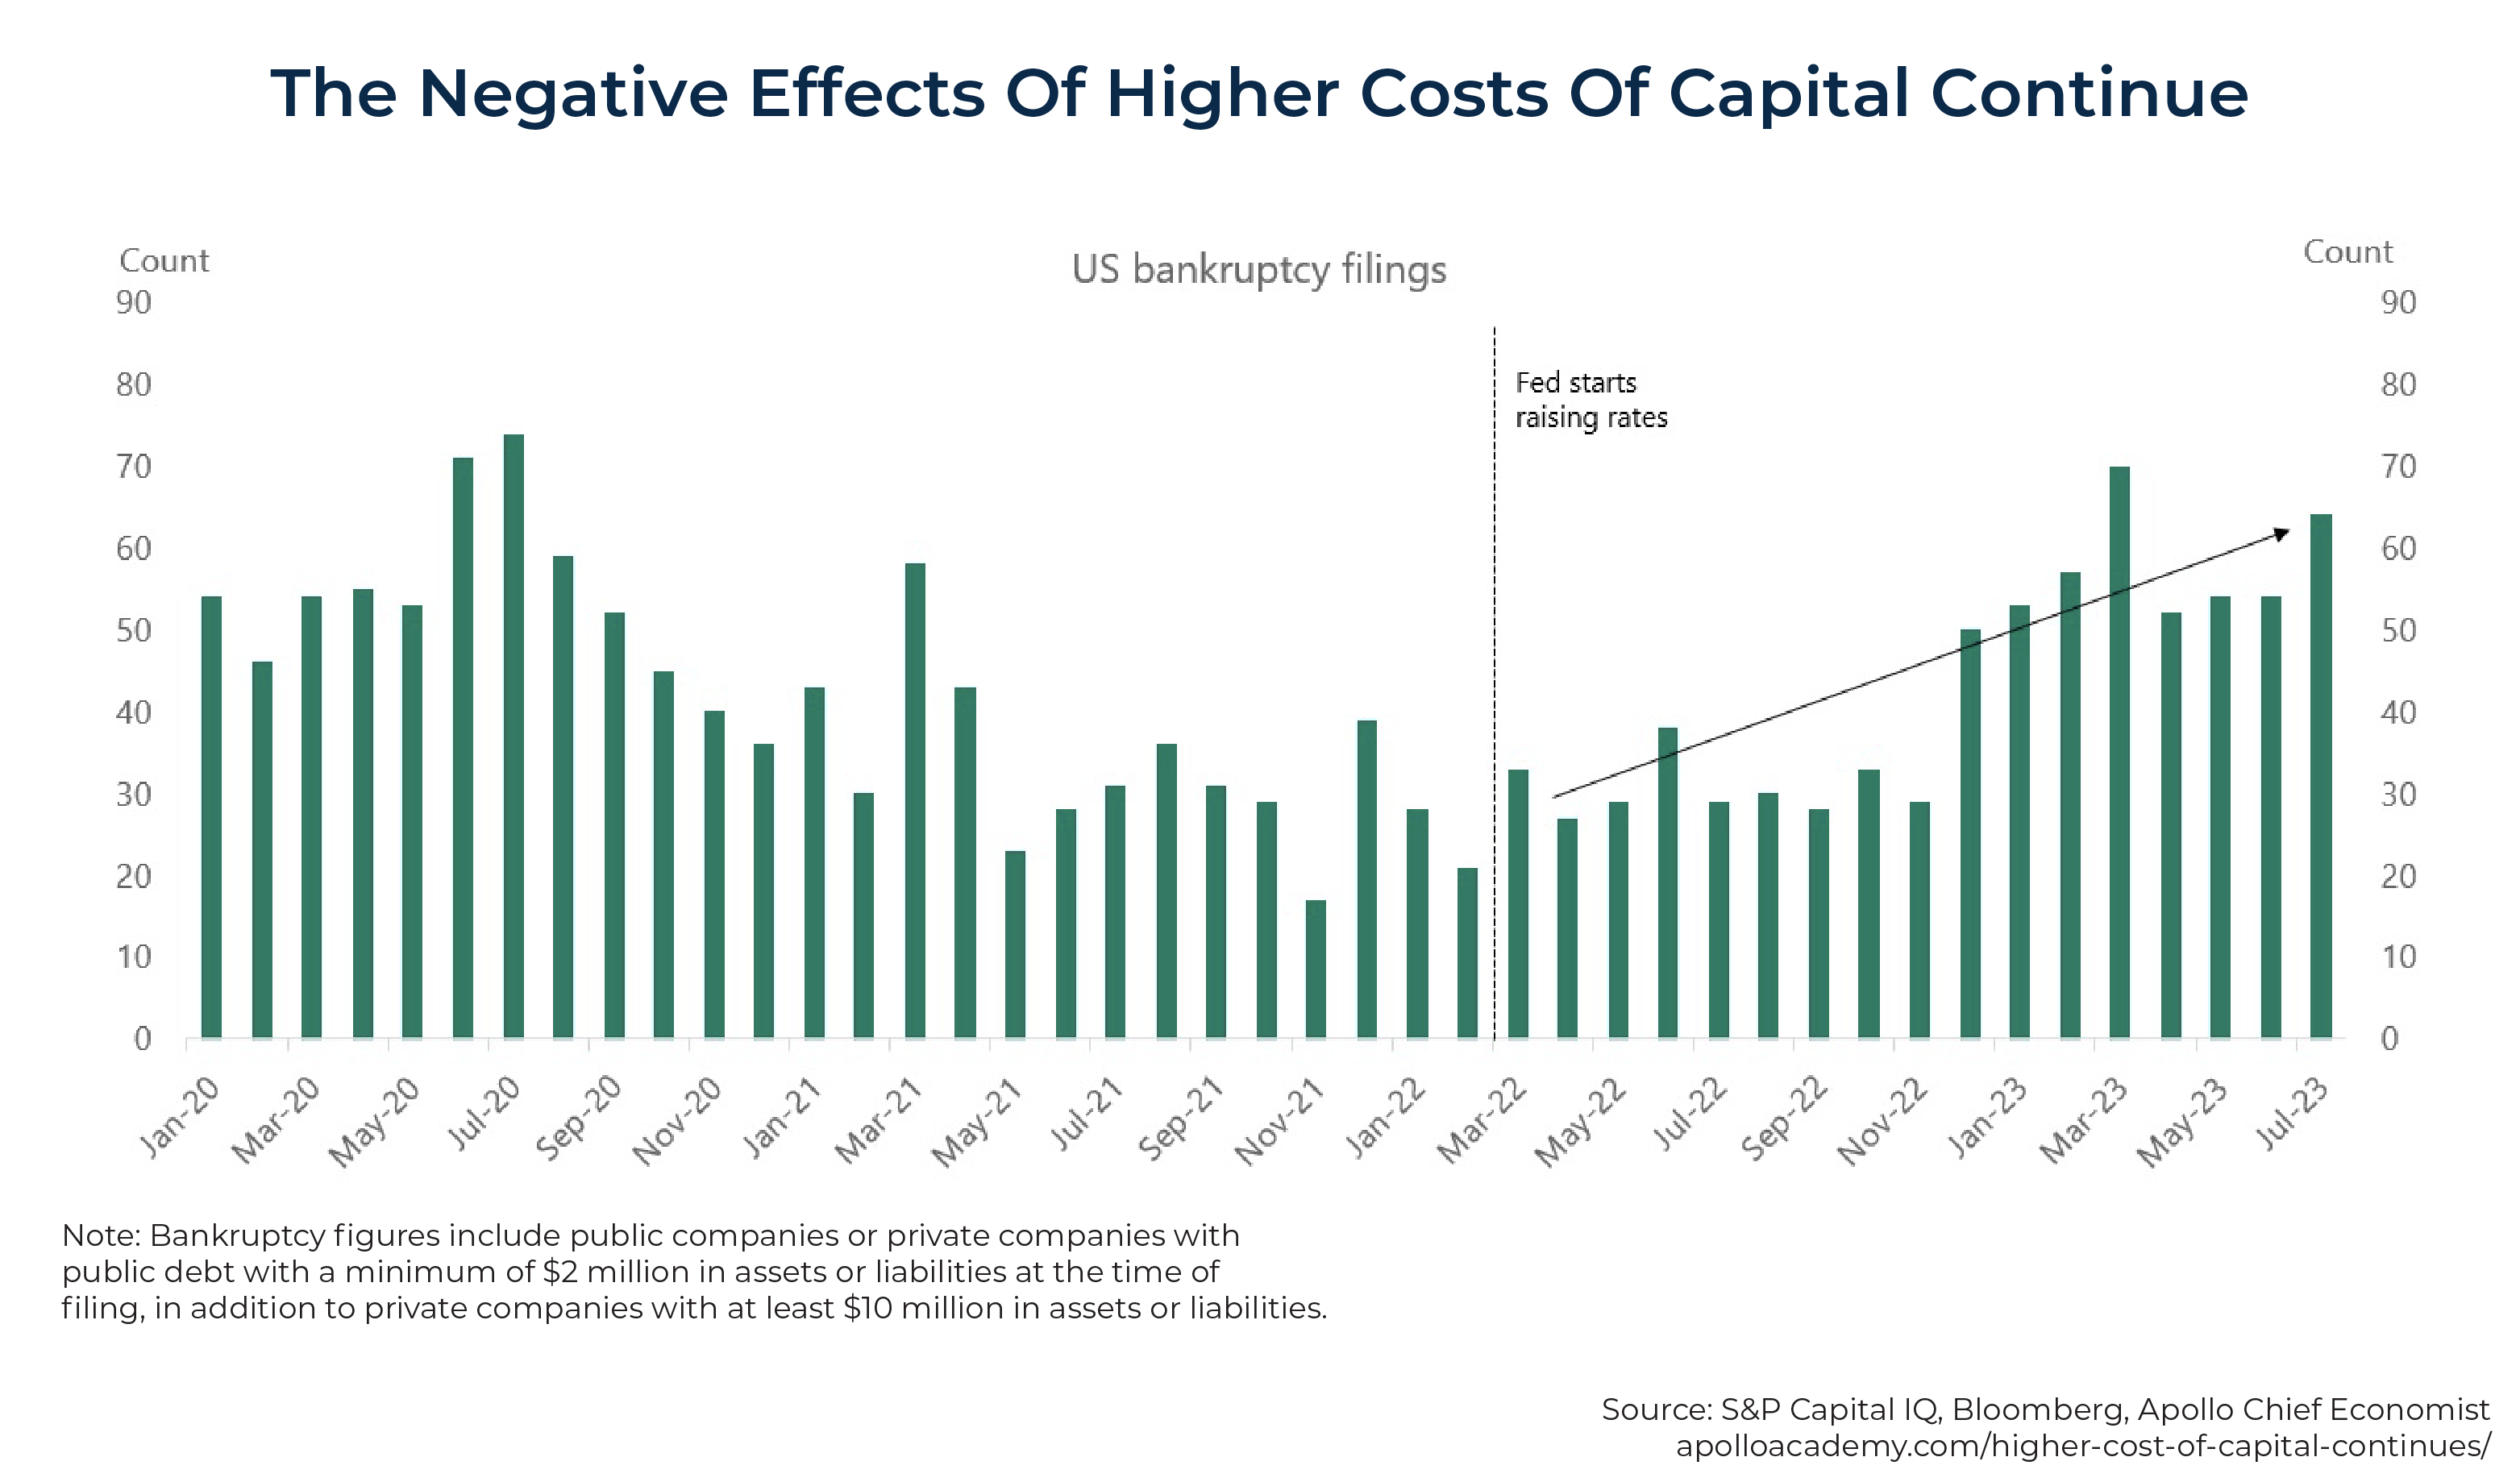
The following chart shows that bankruptcies are already rising significantly:
Turning to the yield curve, it has remained inverted at historically high levels. Arturo Estrella and Frederic Mishkin, in their 1996 research published in the Federal Reserve Bank Of New York's Current Issues In Economic and Finance, The Yield Curve as a Predictor of U.S. Recessions, concluded: "The yield curve – specifically, the spread between the interest rates on the ten-year Treasury note and the three-month Treasury bill – is a valuable forecasting tool. It is simple to use and significantly outperforms other financial and macroeconomic indicators in predicting recessions two to six quarters ahead."
Estrella and Mishkin further conclude that the reason for the relationship is that "monetary policy has a significant influence on the yield curve spread and hence on real activity over the next several quarters. A rise in the short rate tends to flatten the yield curve as well as slow real growth in the near term... expectations of future inflation and real interest rates contained in the yield curve spread also seem to play an important role in the prediction of economic activity."
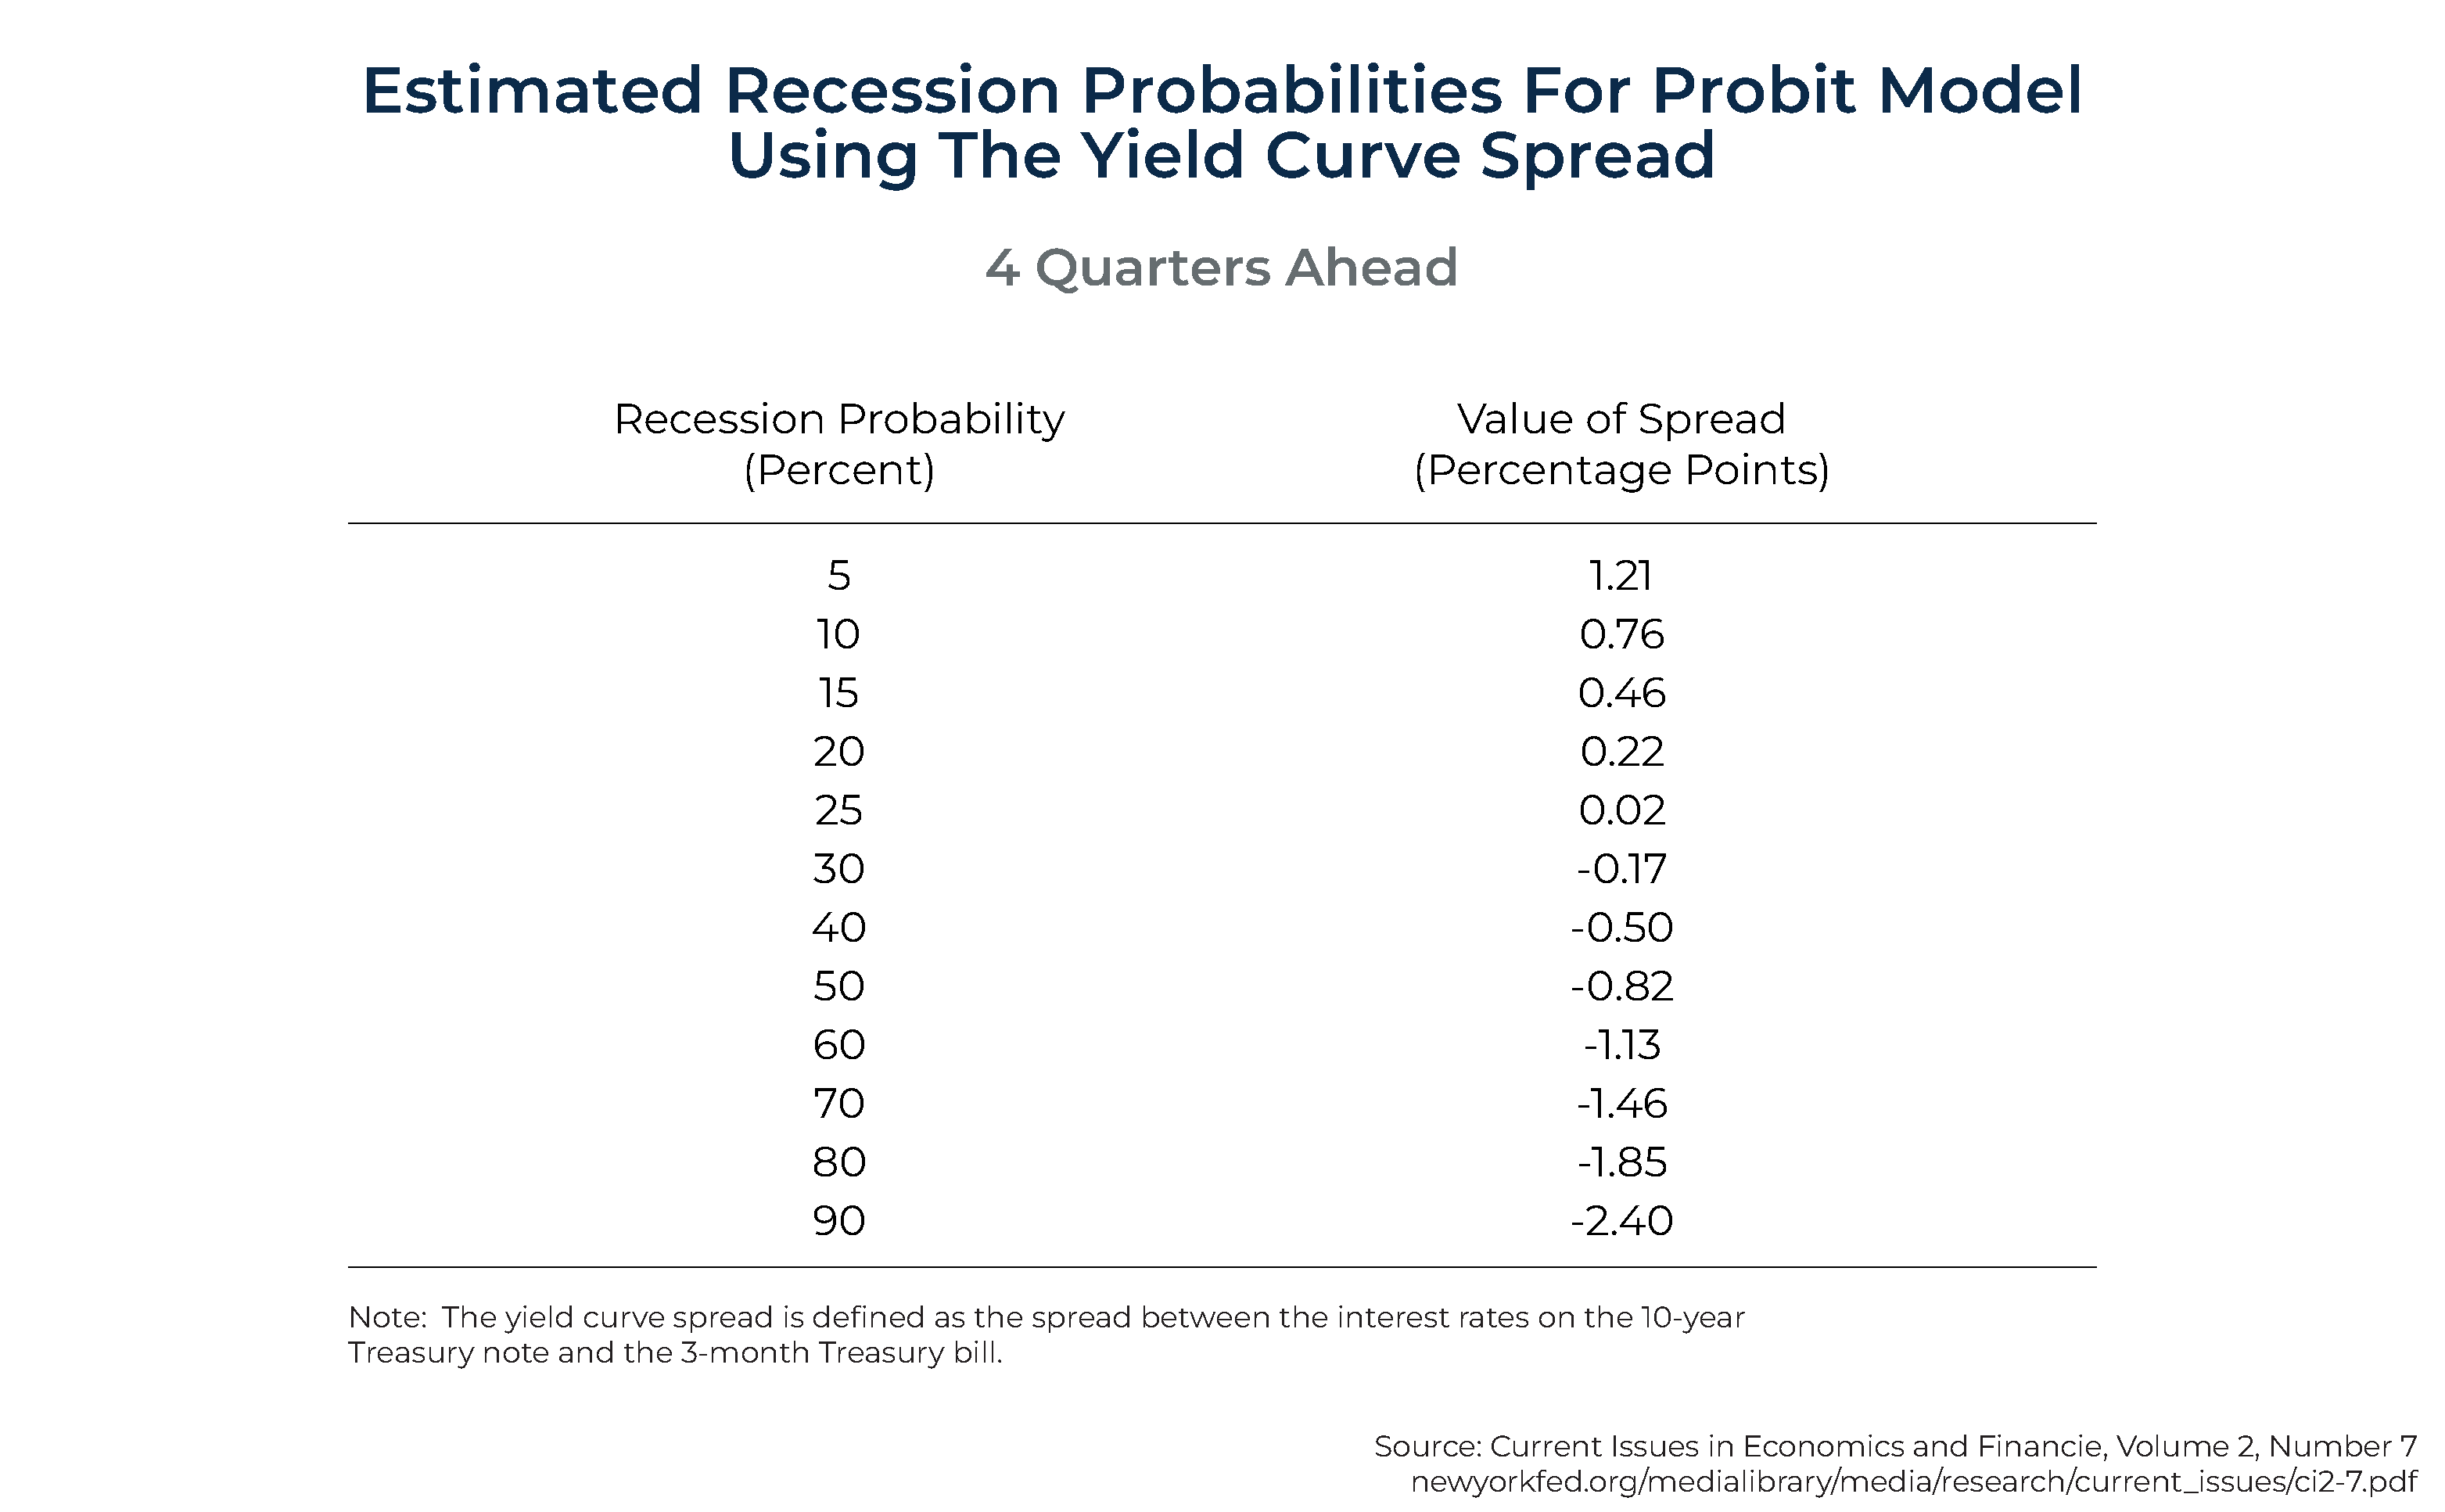
The following chart shows the probability of a recession depending on the slope of the yield curve. As of September 28, the spread between the 3-month bill (5.56%) and the 10-year (4.59%) note was –.97%, indicating a probability of recession between 50% and 60%.
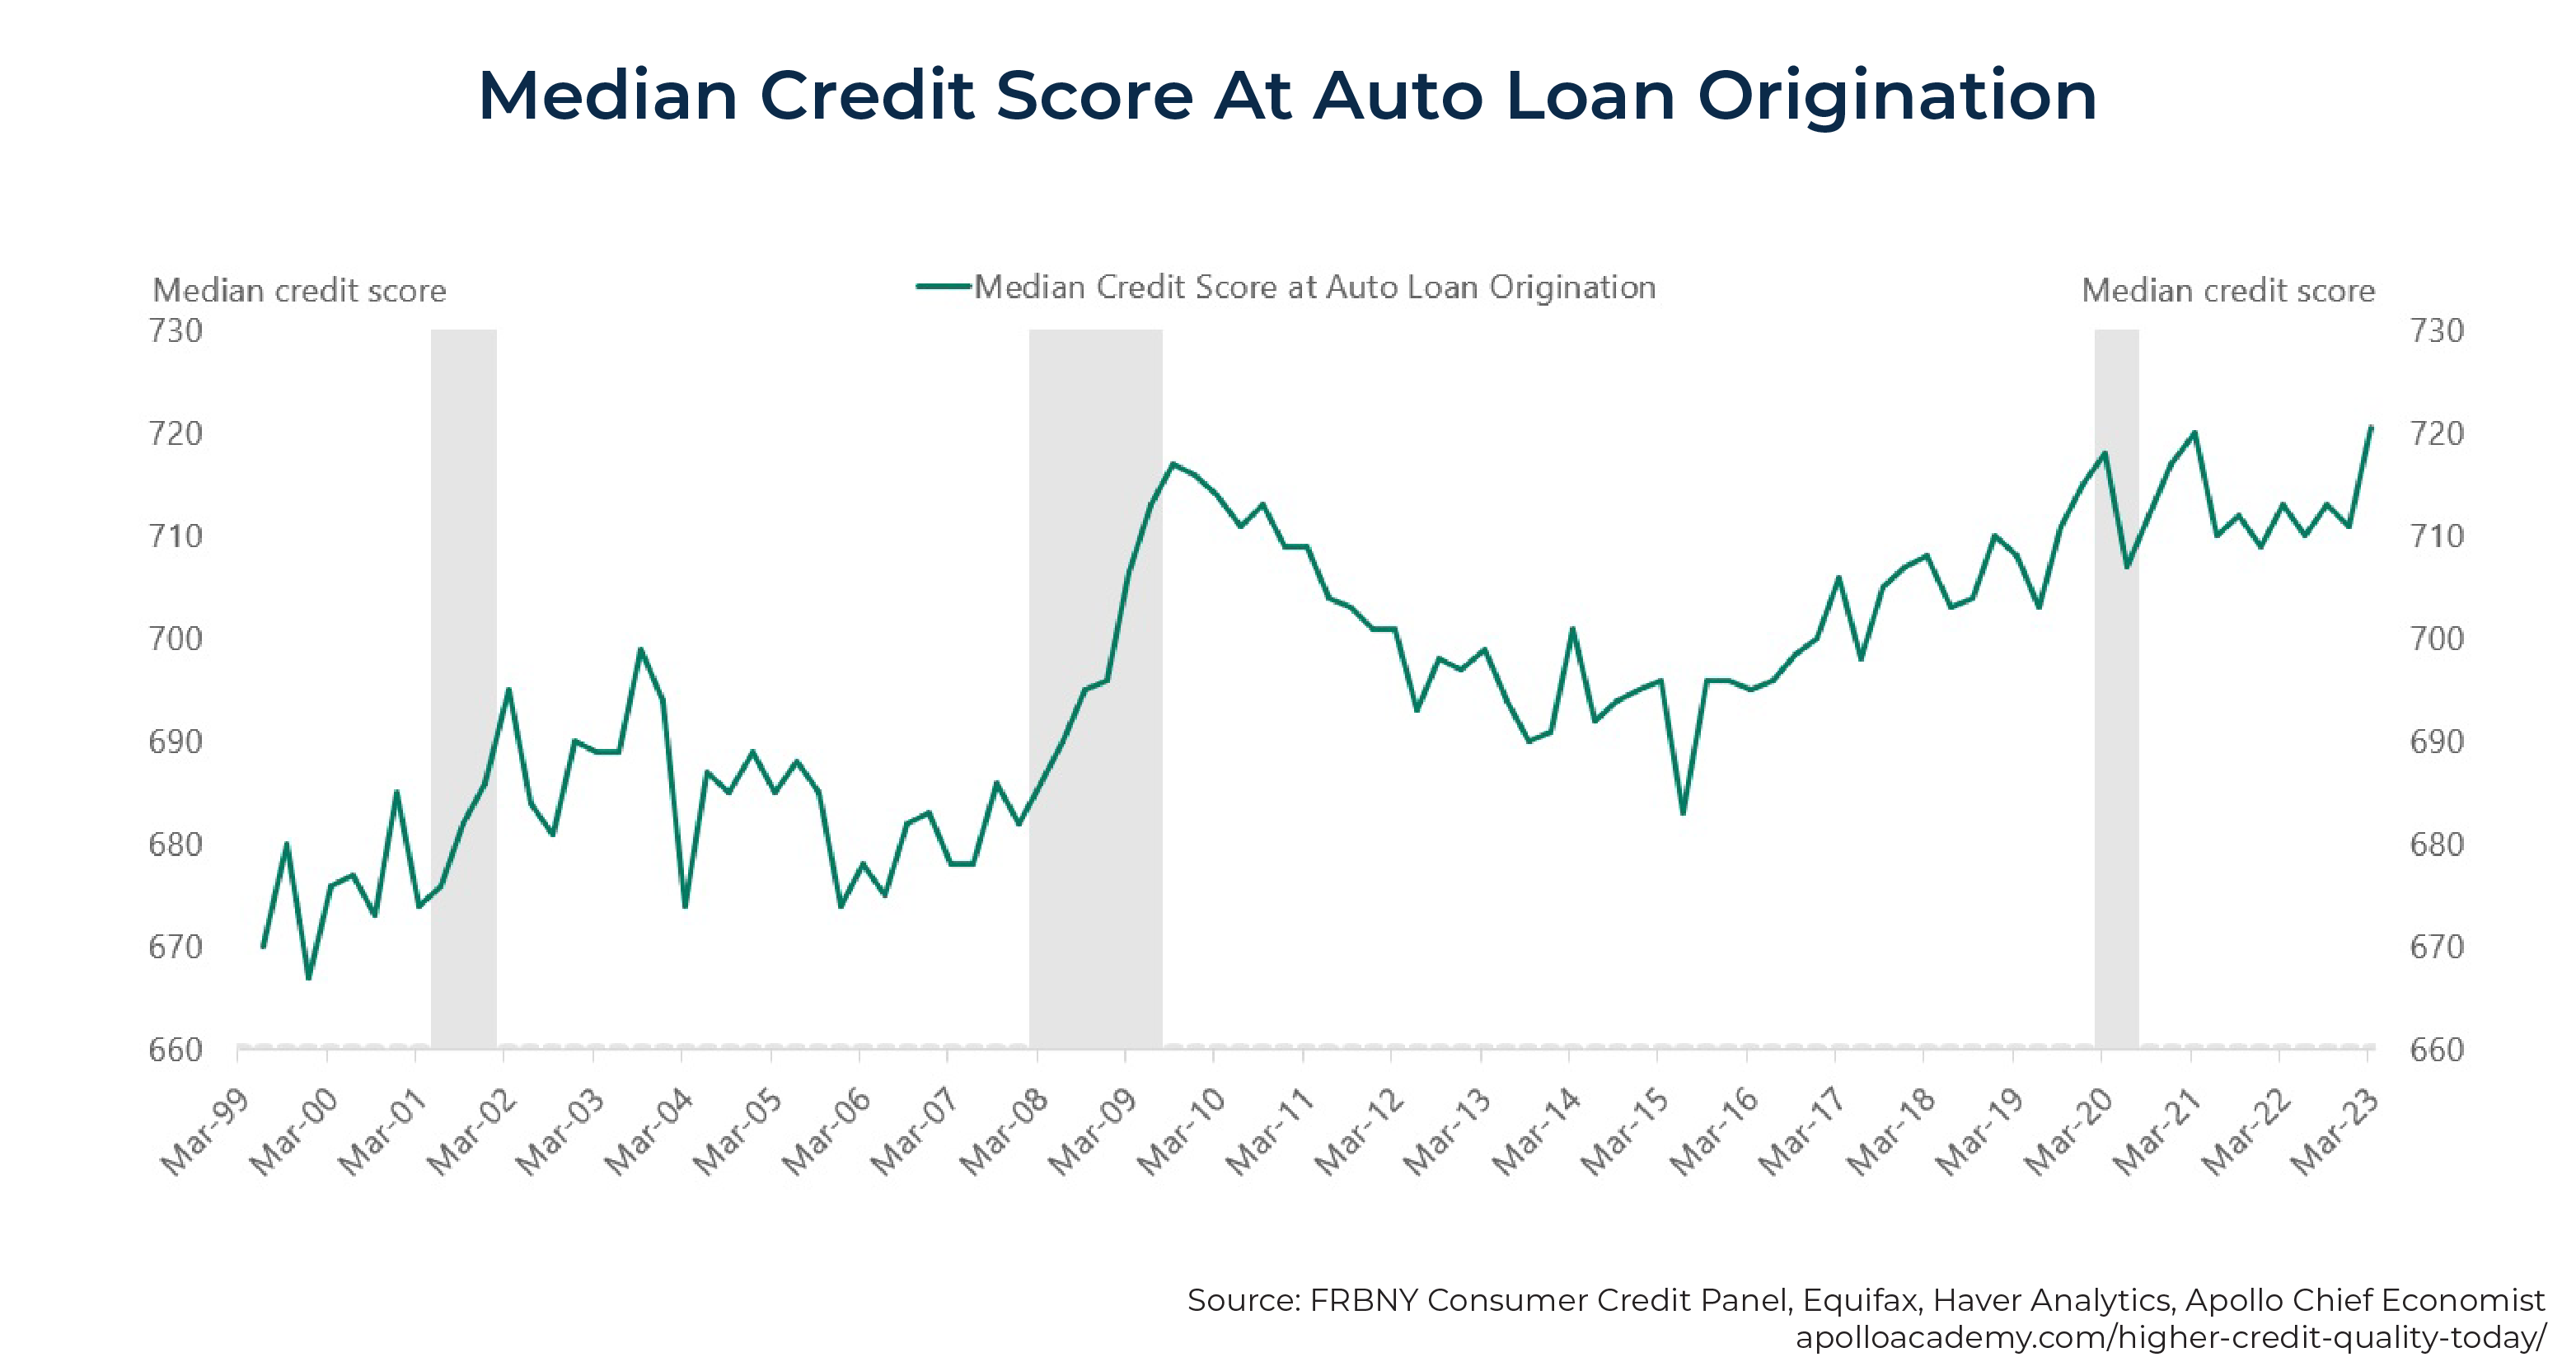
With the increasing risk of a recession, especially if the Fed has to stay tighter for longer, it's important to look at the credit quality of loans being originated. The news on this front is good. The quality of auto loans and mortgages originated today is significantly higher than auto loans and mortgages originated before the global financial crisis in 2007.
Resumption Of Student Loan Payments
In addition to the likelihood of continued tightening of monetary conditions, Bloomberg reported that the resumption of Federal student loan payments serves as a "headwind" for the U.S. economy, as "almost 27 million borrowers who have a total of $1.1 trillion in student loans in forbearance will need to resume servicing them starting on Oct. 1." The suspension of payments acted as a tailwind for consumer spending. The restart of payments – which averages about $400 a month – will crimp consumer outlays, which are already showing signs of stalling.
Excess Consumer Savings Running Out
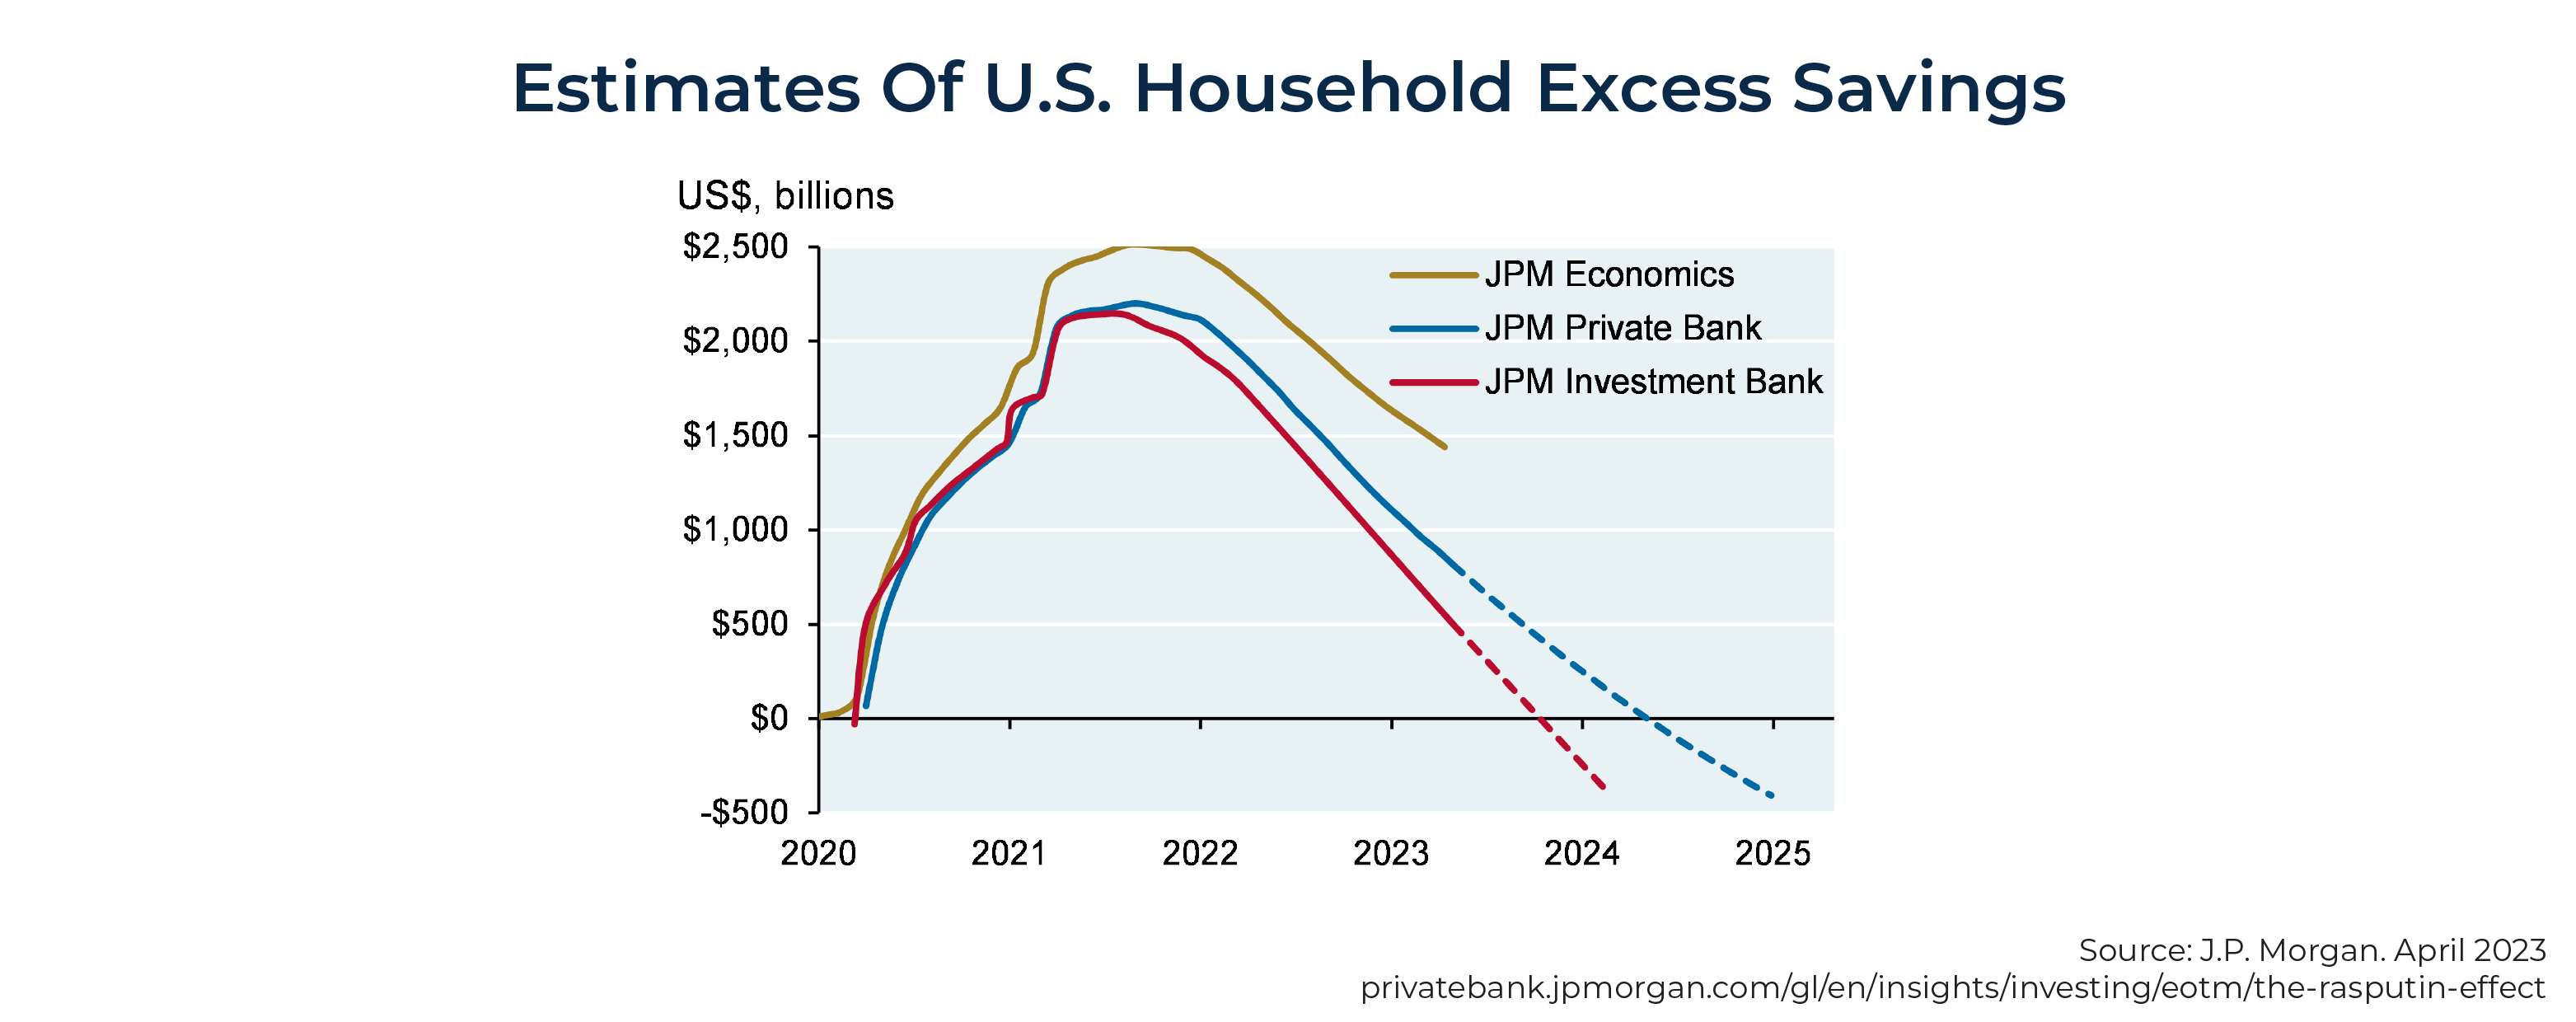
Another tailwind for the economy is also running out of steam: The excess savings built up by consumers during the pandemic is expected to run out sometime in early 2024.
Global Headwinds
The U.S. economy is confronted with headwinds from global markets. The Chinese economy, the second largest in the world, is experiencing much slower growth, considering the following factors:
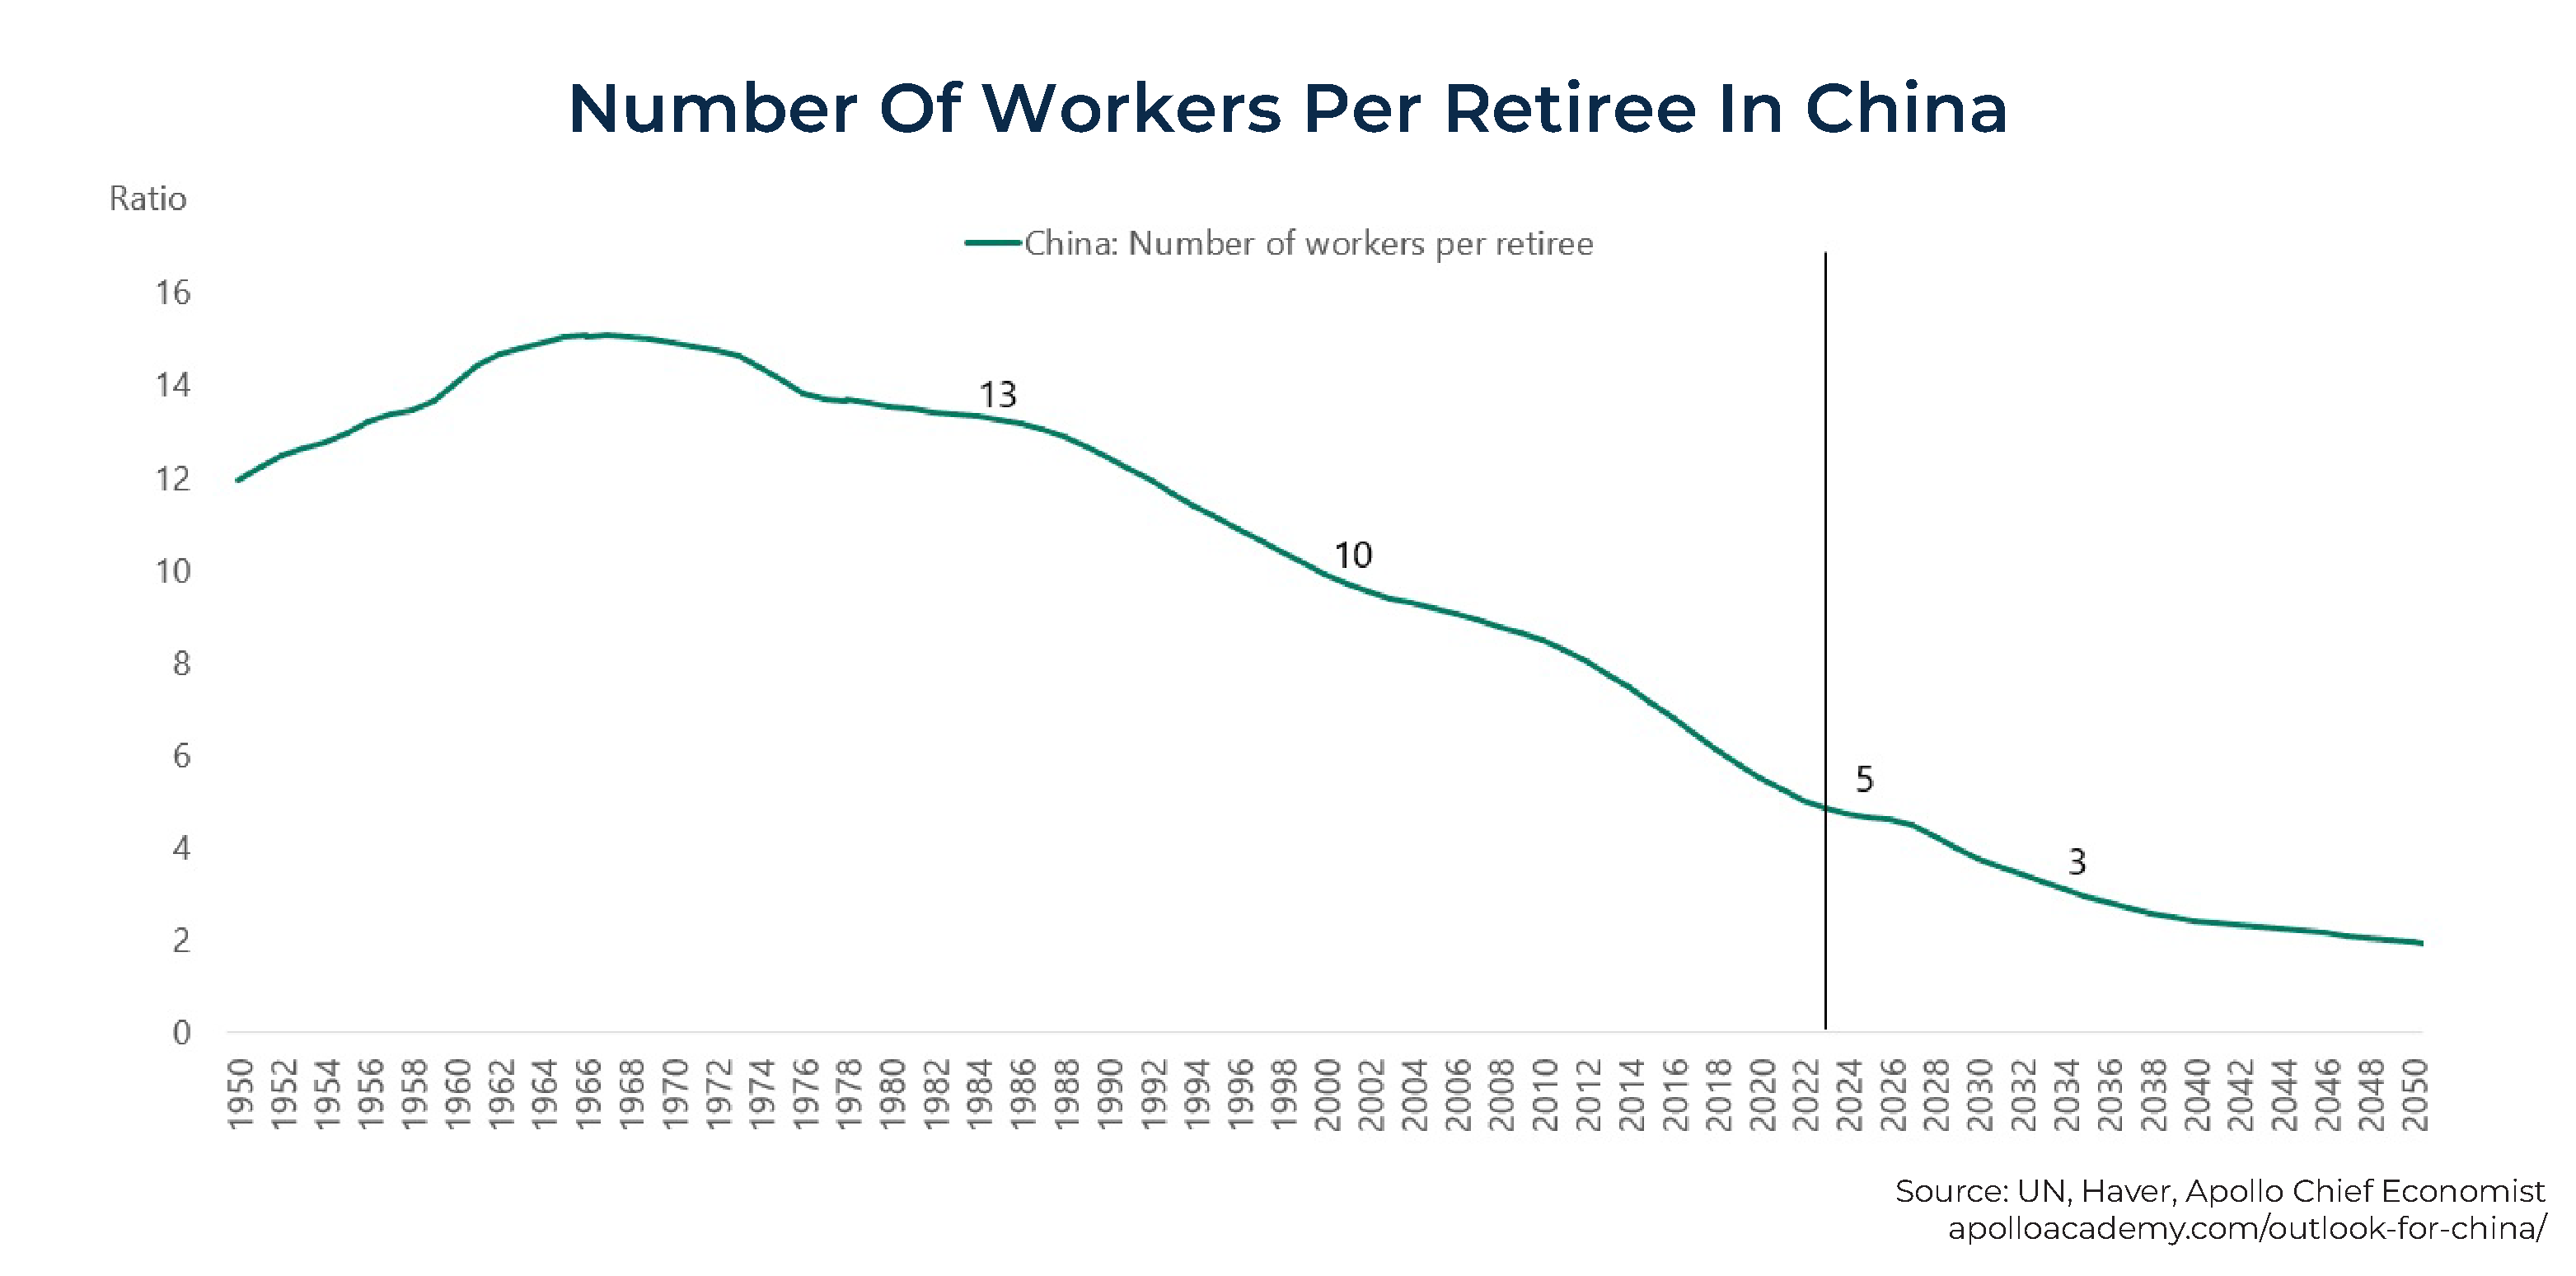
- Aging population. A significant part of China's economic growth was fueled by a rapidly increasing population. China's population is now aging quickly – and fewer workers are available to support the growing number of retirees, placing a strain on the economy and leading to slower growth. In 2000, there were 10 workers for every retiree compared to just 5 today – and trending lower.
China's population, which now stands at about 1.4 billion, is predicted to drop below 1 billion by 2080 and 800 million by 2100. China's working-age population, which peaked in 2011, is projected to decline nearly a quarter by 2050. Meanwhile, the number of elderly Chinese is expected to rise from 200 million to 500 million at midcentury, and providing for their needs will be a mounting challenge for China's workers and policymakers.
- Slowing productivity. The Chinese migration from farms to cities helped fuel rapid increases in productivity. However, that era is basically over. As a result, China's productivity has been slowing in recent years, another factor contributing to slower growth.
- Deglobalization. China benefited from the era of globalization, which is now reversing for national security reasons and to reduce supply chain risks, with negative implications for growth.
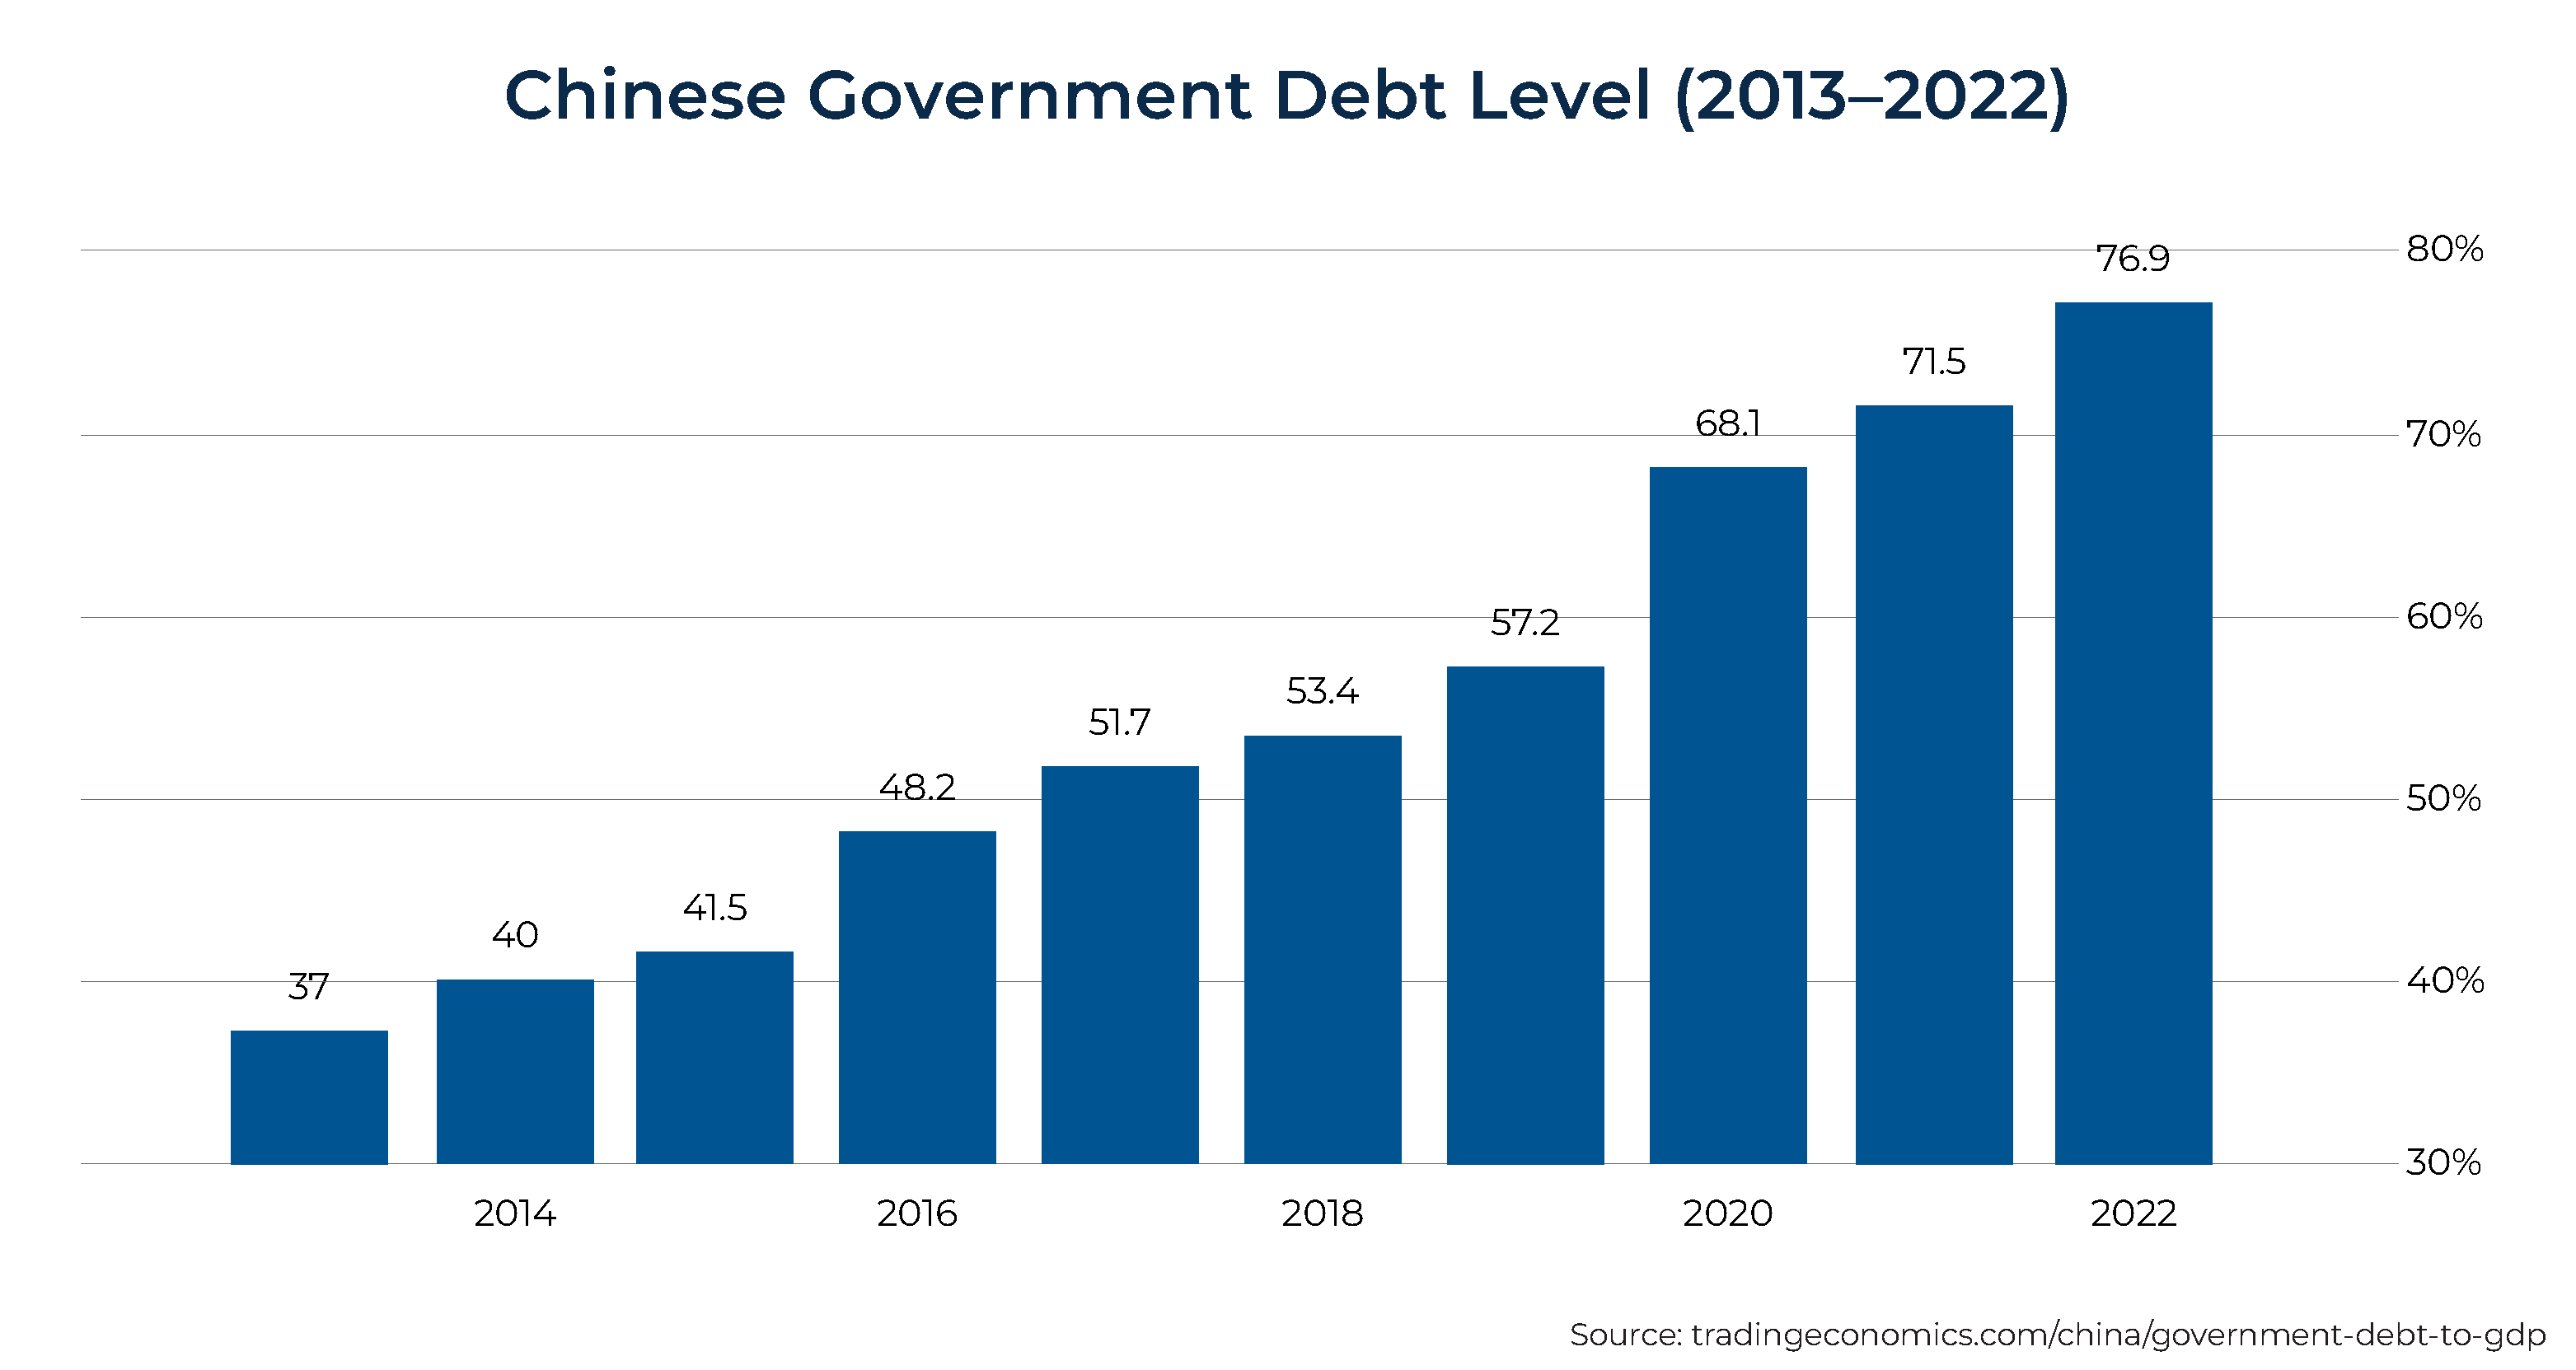
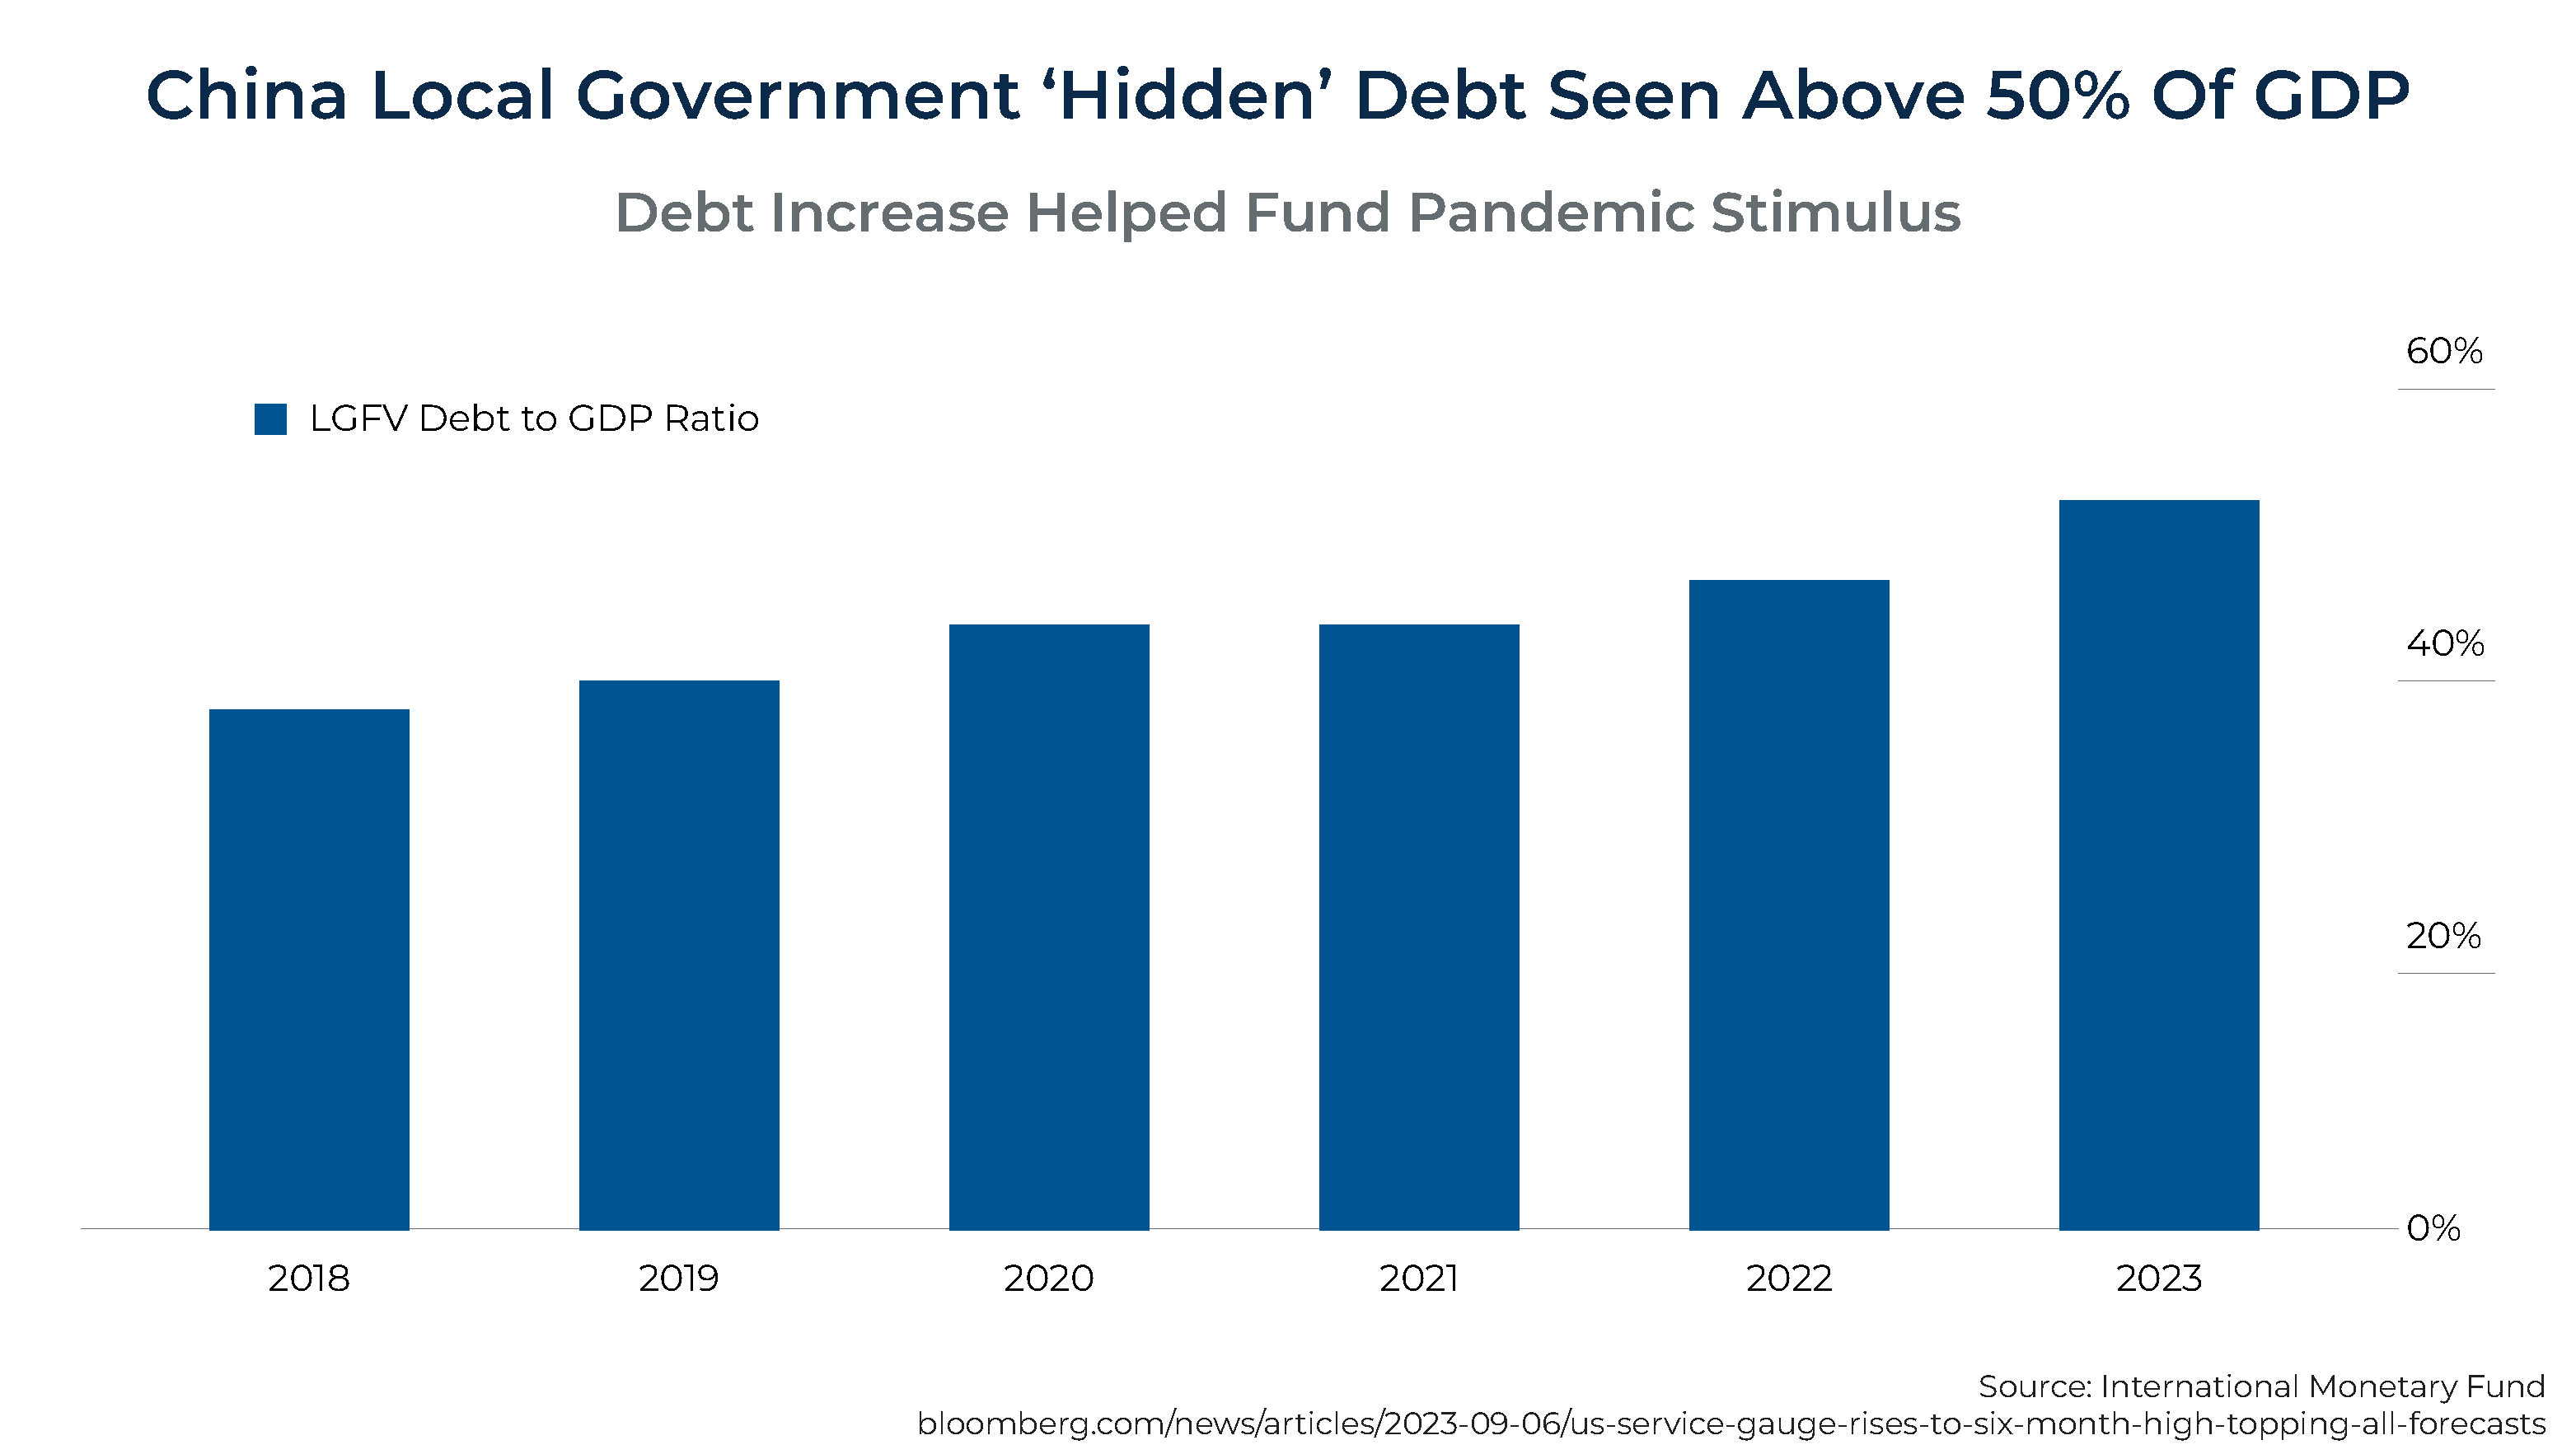
- Rising debt levels. China's debt level is rising, and the research shows a negative relationship between economic growth and debt once the debt-to-GDP ratio reaches about 100%. As the chart below shows, China's government debt level was approaching 80% by the end of 2022. However, the chart excludes debt issued by local Chinese governments.
The following chart shows that local government "hidden" debt is above 50% of GDP.
- Trade tensions. Trade tensions (including the imposition of tariffs) between China and the United States have led to slower growth in exports, which have been a drag on China's overall growth.
- Distressed property sector. Because Chinese investors have a higher percentage of their net worth invested in real estate, the negative impact of distress in that sector could be as dramatic as it was in the U.S. during the Great Recession, or even worse.
- Unemployment. The unemployment rate among Chinese youths aged 16–24 in urban areas reached a record high of 21.3% in June 2023, the highest since reporting began in 2008.
Distress in the property sector, high unemployment among youth, and declining trust in financial institutions are negatives for consumer confidence.
The German economy (Europe's largest and the 4th largest in the world), heavily reliant on manufacturing exports, is in recession because it is more vulnerable to the slowdowns in both Russia and China, 2 of its important trading partners.
The 'Godot' Recession
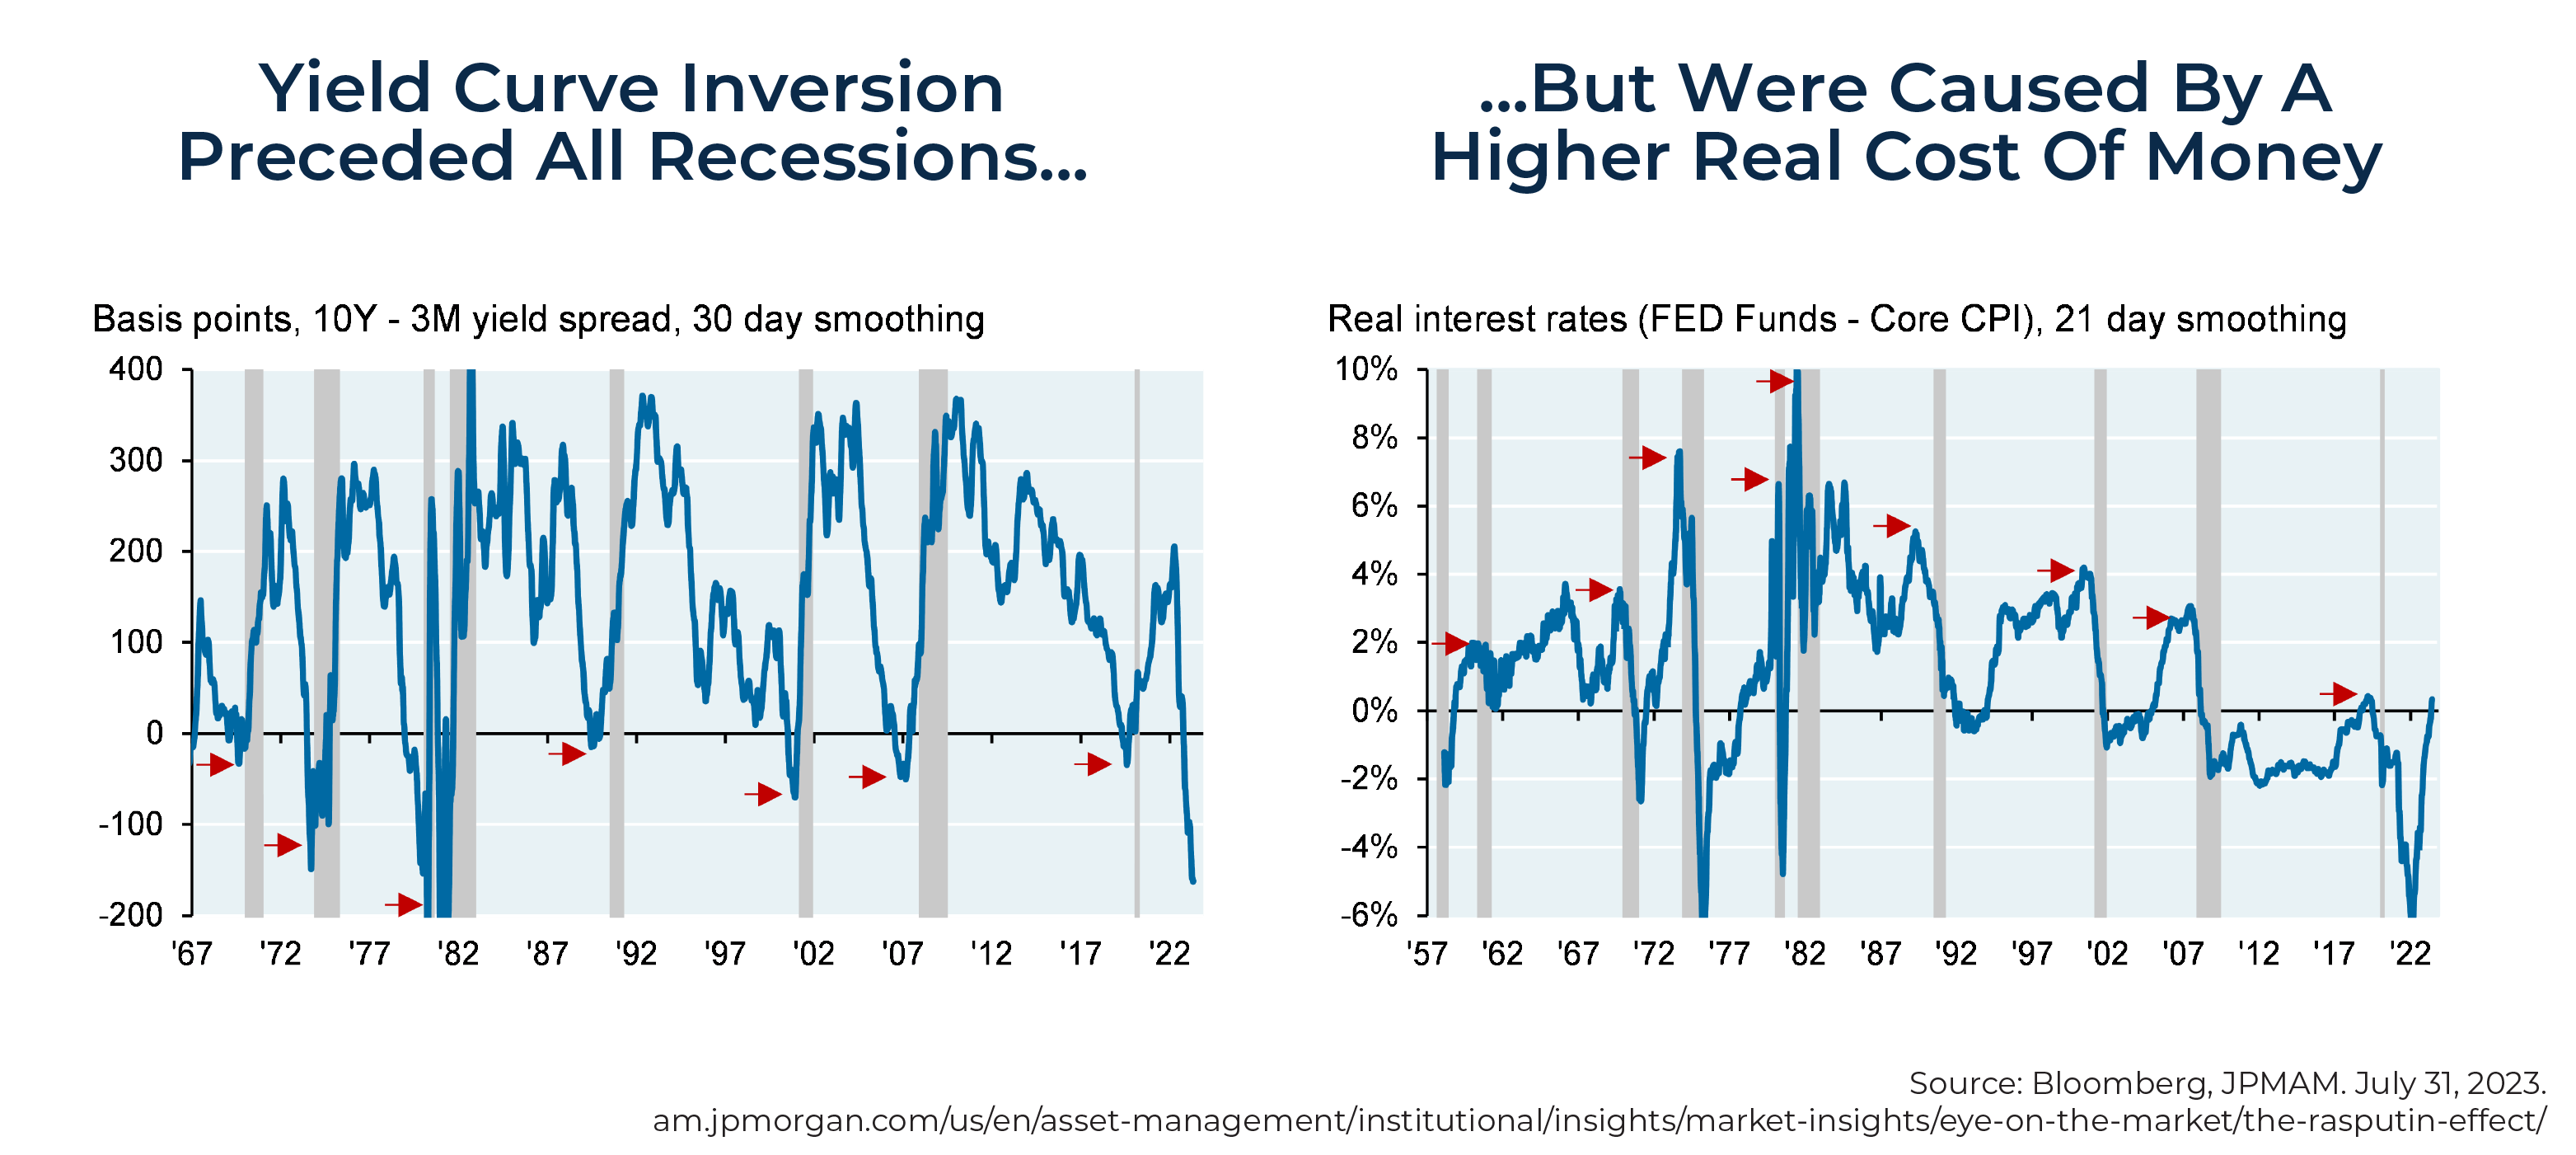
With the Fed raising interest rates above 5%, many have been predicting a recession for a long time. Reasons for the forecast include the fact that the yield curve (1-month Treasury yield minus 10-year Treasury yield) turned negative in November 2022, and the index of leading economic indicators fell in August (–0.4%) for the 17th consecutive month. Why has there not yet been a recession? First and foremost, Fed policy has not been sufficiently tight, as the Fed funds rate has been below the nominal growth of GDP and until recently was even below the rate of inflation (see chart at right).
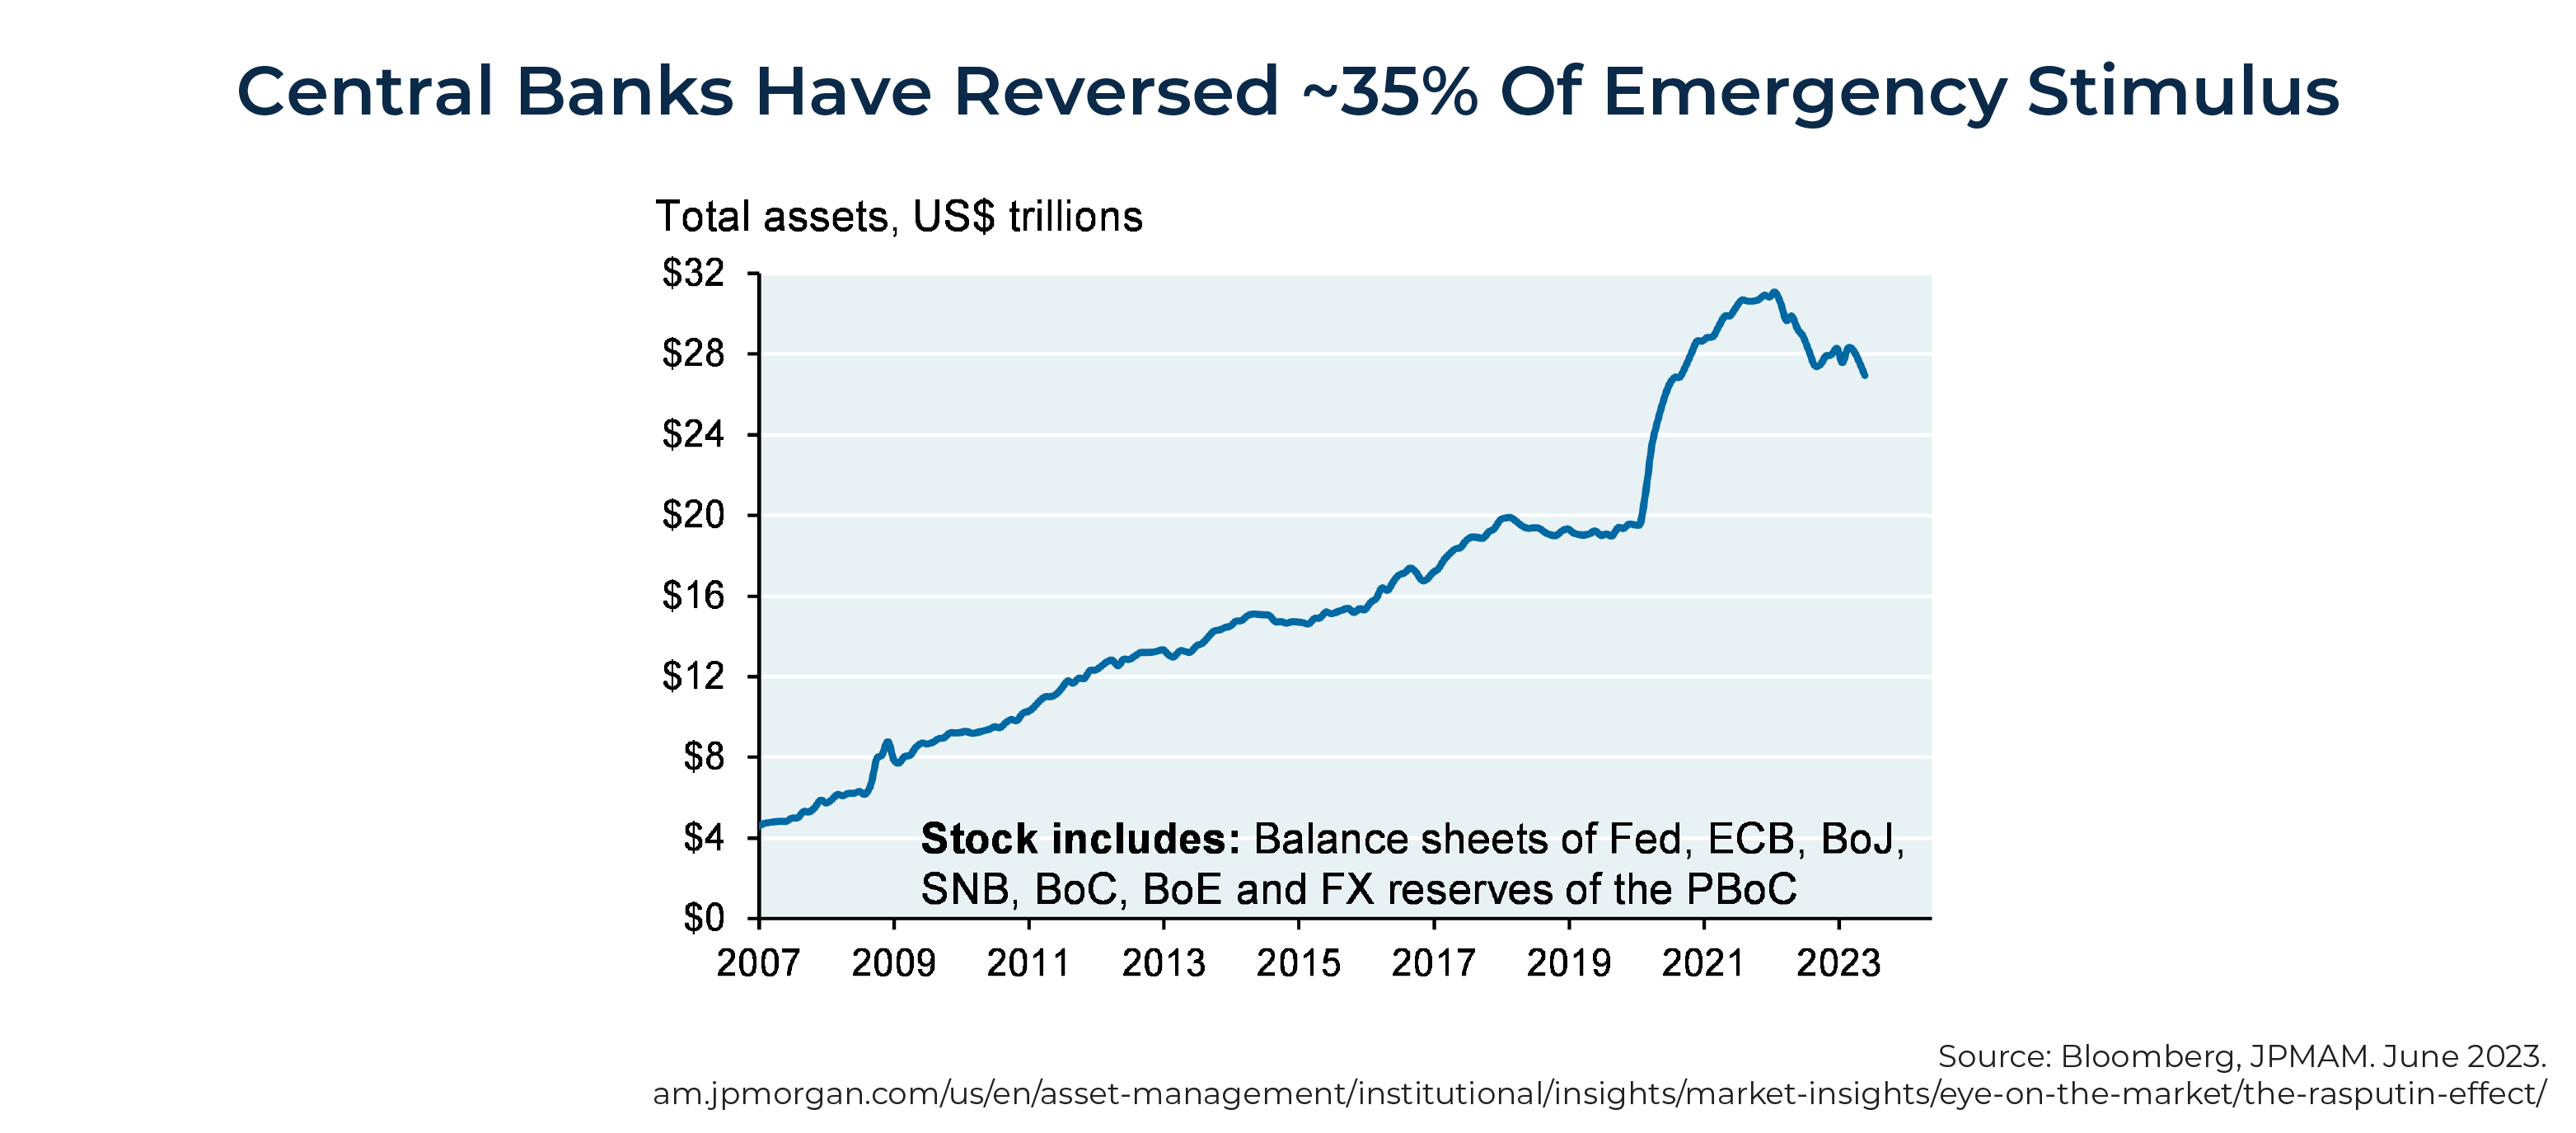
Another explanation is that central banks have removed only around 1/3 of the $11 trillion in global liquidity they created in 2020–2021 – there is still ample liquidity in the system, and the cost of money is not prohibitive in real terms.
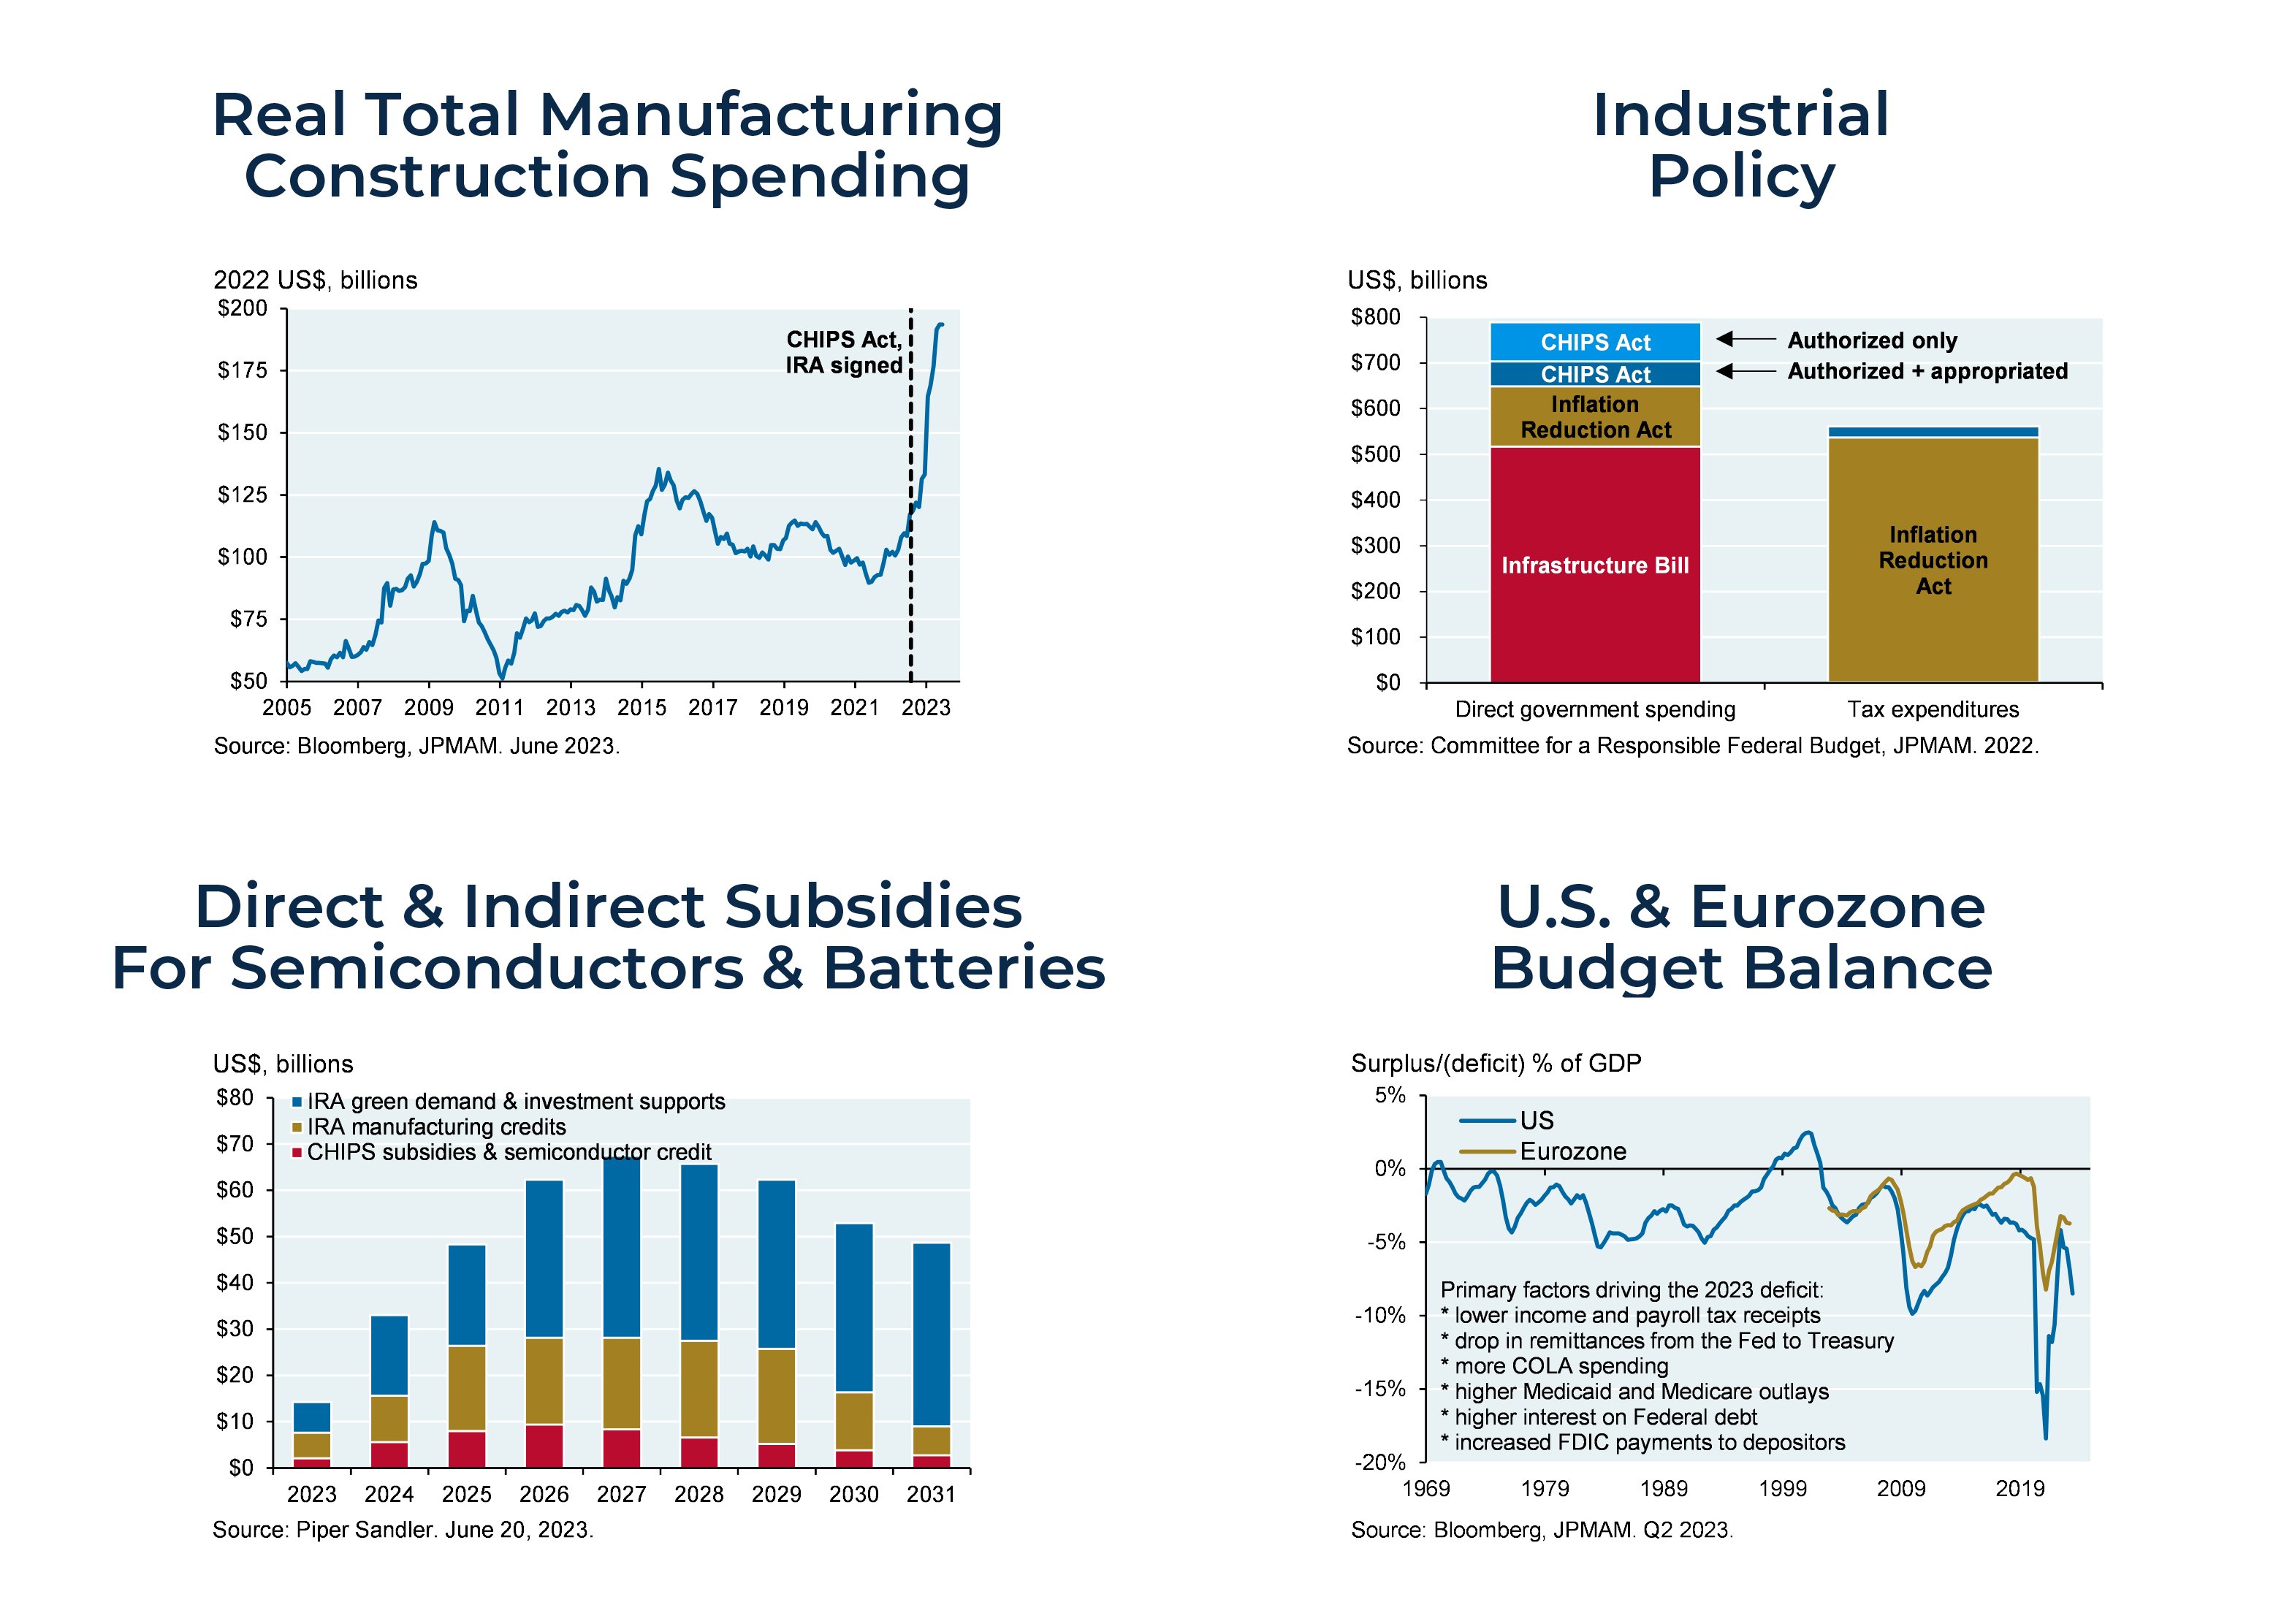
A third explanation is that the administration's stimulative industrial and fiscal policies have offset part of the drag from higher interest rates. Fitch recently forecasted the 2023 deficit to be 6.3% of GDP. With unemployment at historic lows, we should be running large surpluses, not large deficits that add stimulus to the economy. The charts below show the construction bounce in the manufacturing sector and the direct government spending and tax incentives associated with semiconductor, infrastructure, and energy bills:
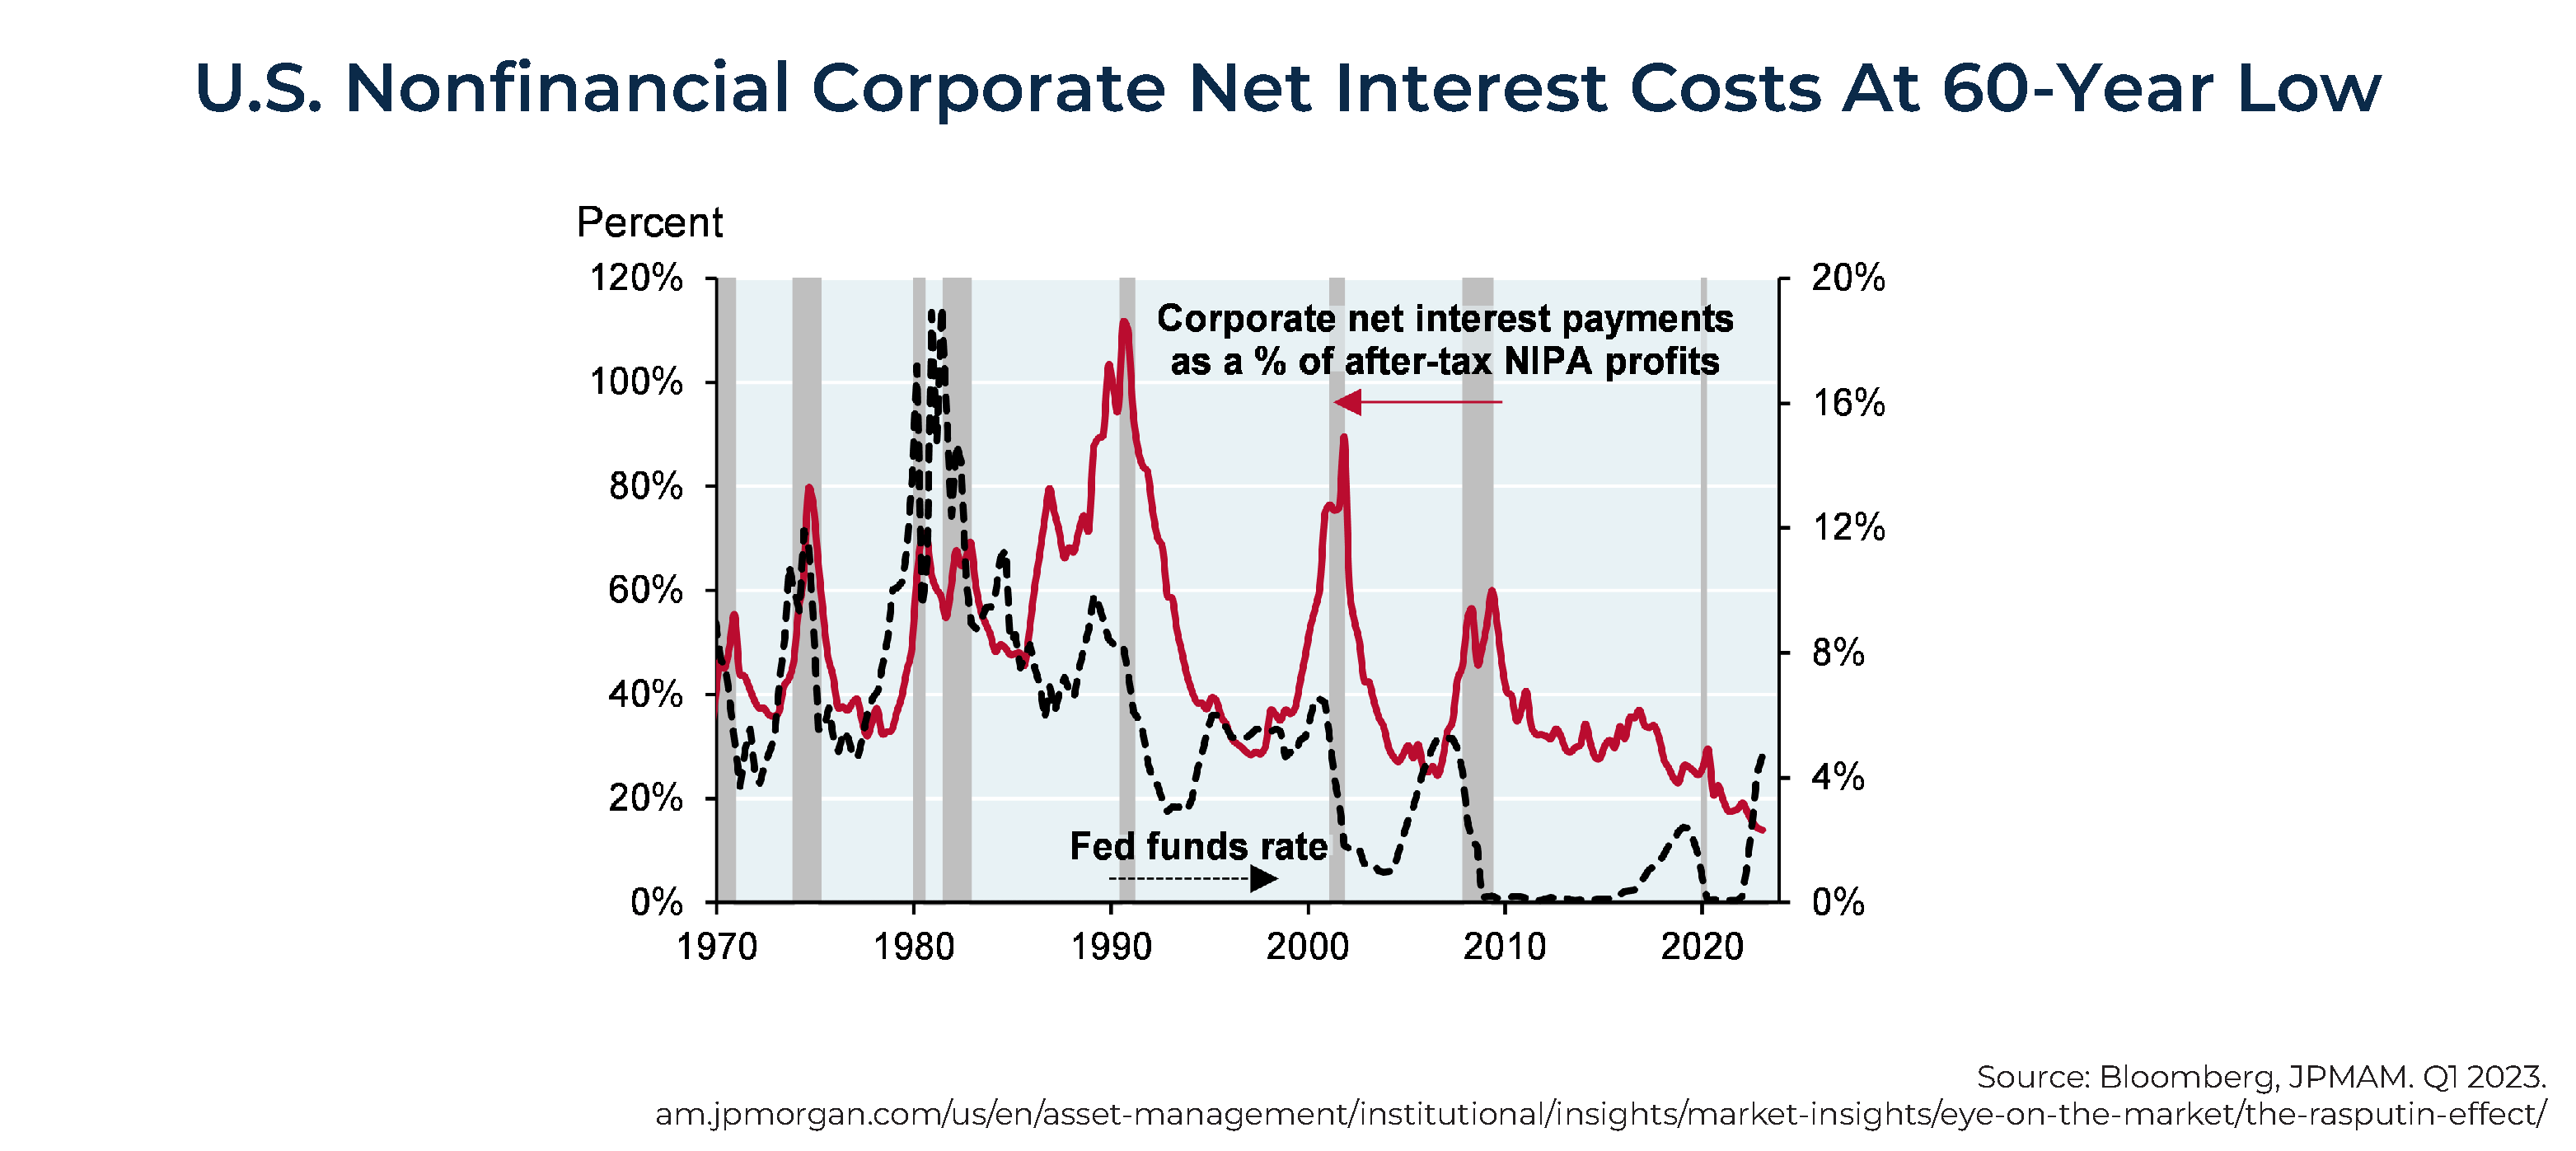
Yet another explanation for the absence of recession is that many U.S. corporations and individuals refinanced to take advantage of historically low rates, extending maturities and limiting the impact of the Fed's raising short-term rates. In fact, despite the sharp rise in interest rates, U.S. nonfinancial interest costs as a percentage of profits are at a 60-year low.
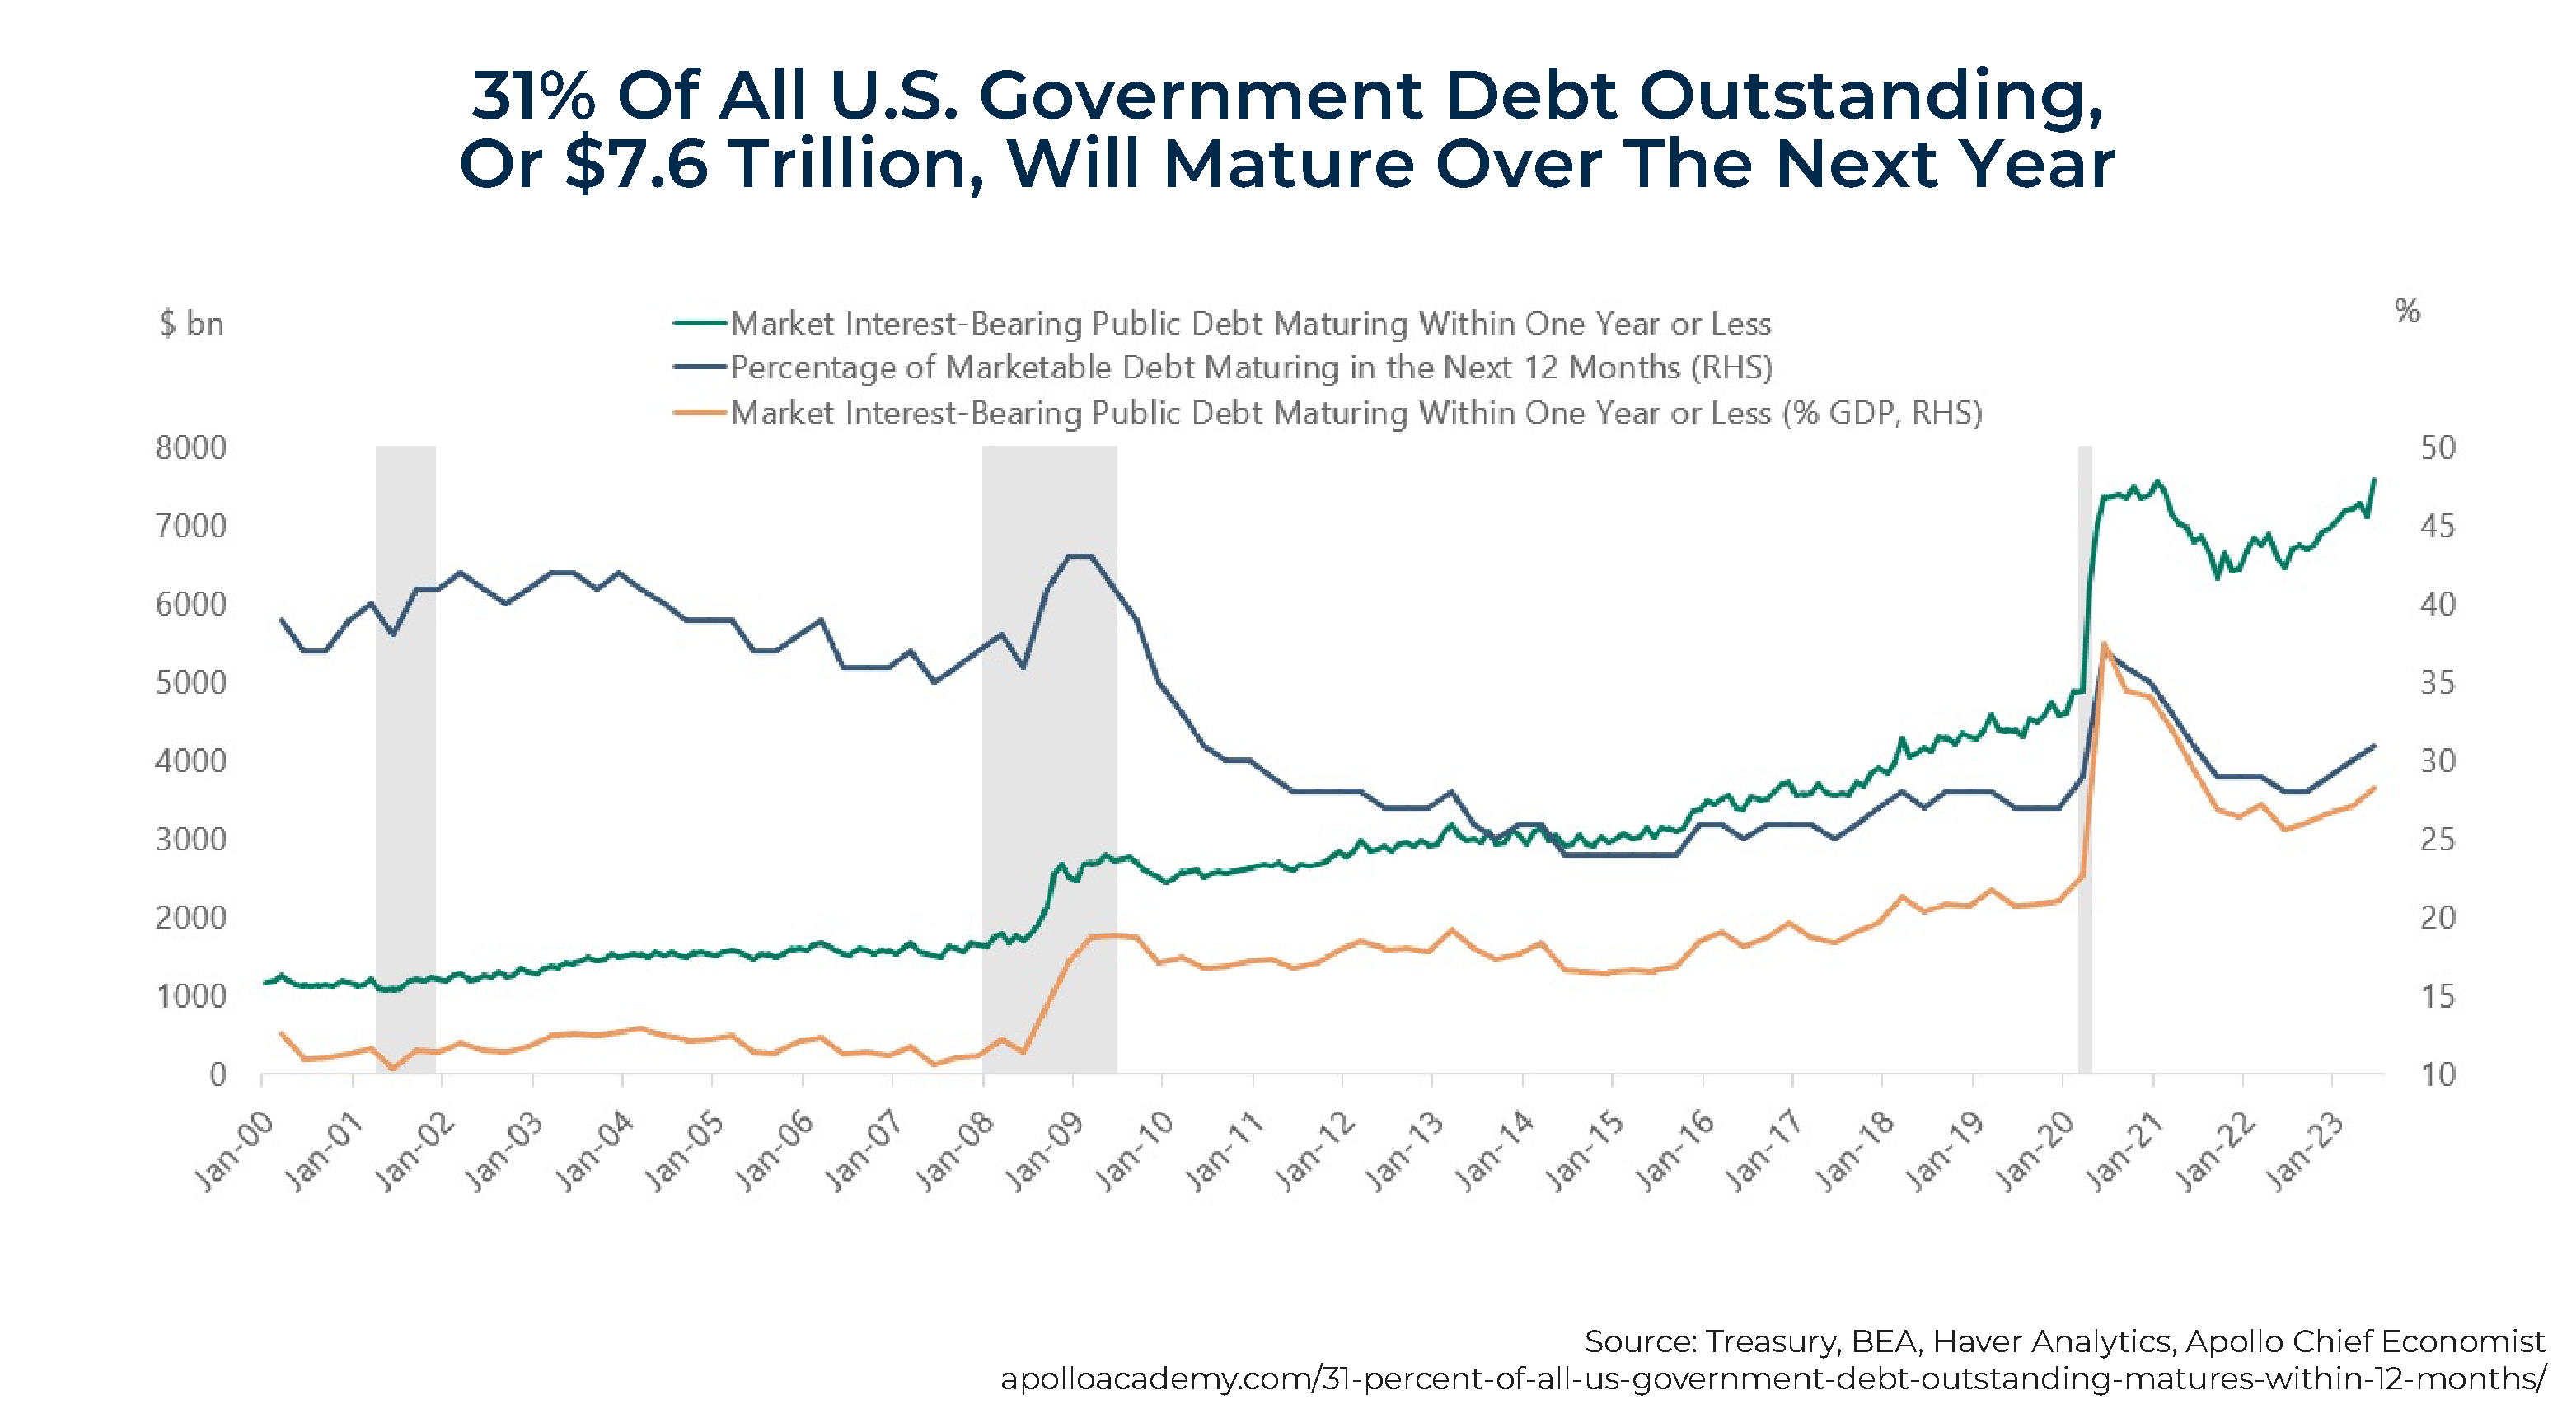
Making an epic error in judgment, the U.S. Treasury unfortunately failed to take advantage of the historically low long-term rates and extend the maturity of our debt. Thus, U.S. interest costs are now rising sharply, exacerbating the fiscal problem we are facing. The failure to extend maturities when rates were at historic lows has resulted in 31% of U.S. government bonds maturing over the coming 12 months, putting upward pressure on rates.
On the other hand, U.S. homeowners were a lot smarter. "At the end of June, about 39 million U.S. homes had a mortgage rate below 4.375%", reports Claire Ballentine in Financial Advisor Magazine. "That was more than 73% of the outstanding mortgages in the U.S."
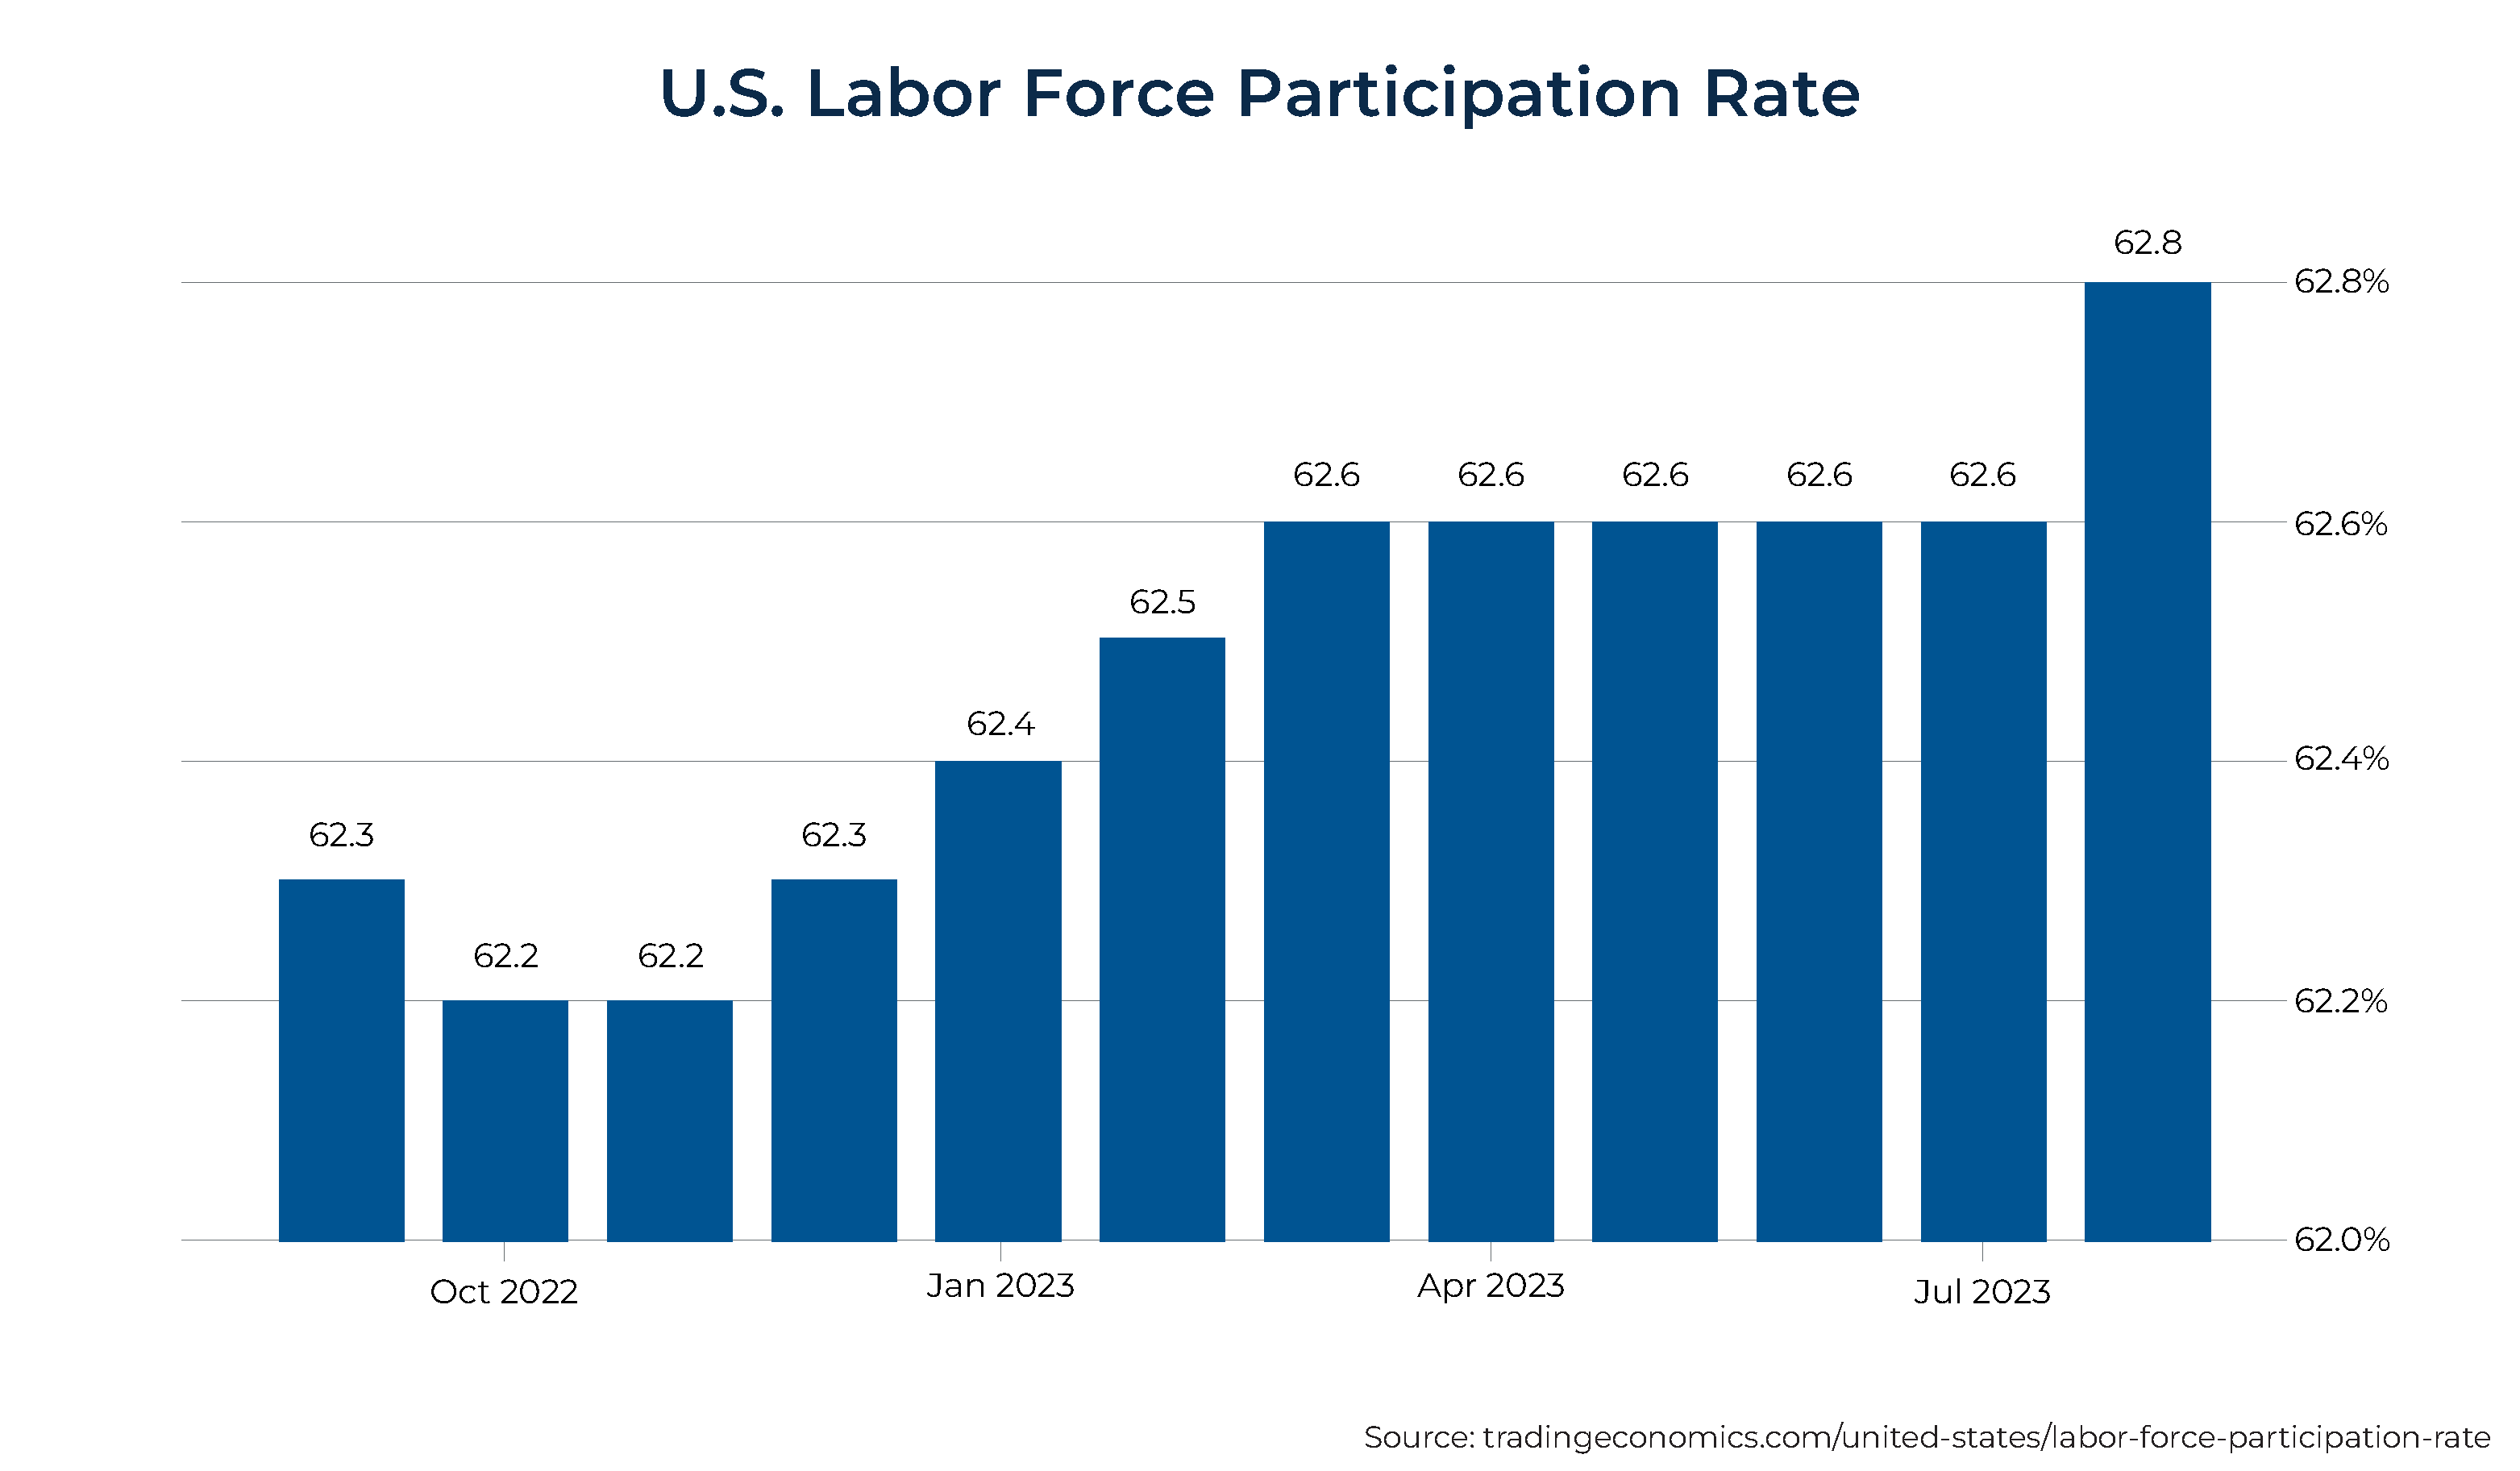
The tight labor market, with unemployment at 3.8%, is yet another reason why a recession has not yet occurred, as employers are reluctant to reduce staff that might be difficult to replace. As of the end of July, there were still 8.8 million job openings versus about 6.4 million unemployed. However, as a sign that the Fed's policy is starting to impact the labor market, the job openings are well down from their peak of 12 million in March 2023. Another good sign is that the labor force participation rate rose in August to 62.8%, the highest since February 2020 when it was 63.3% (which is what caused the unemployment rate to increase despite the economy adding 187,000 jobs in August).
Finally, another explanation is that no sector of the economy had been overbuilt (such as housing or manufacturing). Overbuilding creates the potential for a boom/bust cycle that can cause a recession.
In summary, monetary policy (which works with long lags) has not yet been sufficiently tight to cause a recession, and fiscal policy has been extremely loose, creating more demand for goods and services. Thus, the risk is that the Fed will have to tighten monetary policy further to achieve its goal of keeping rates higher and for longer than the market rightly expects.
Inflation
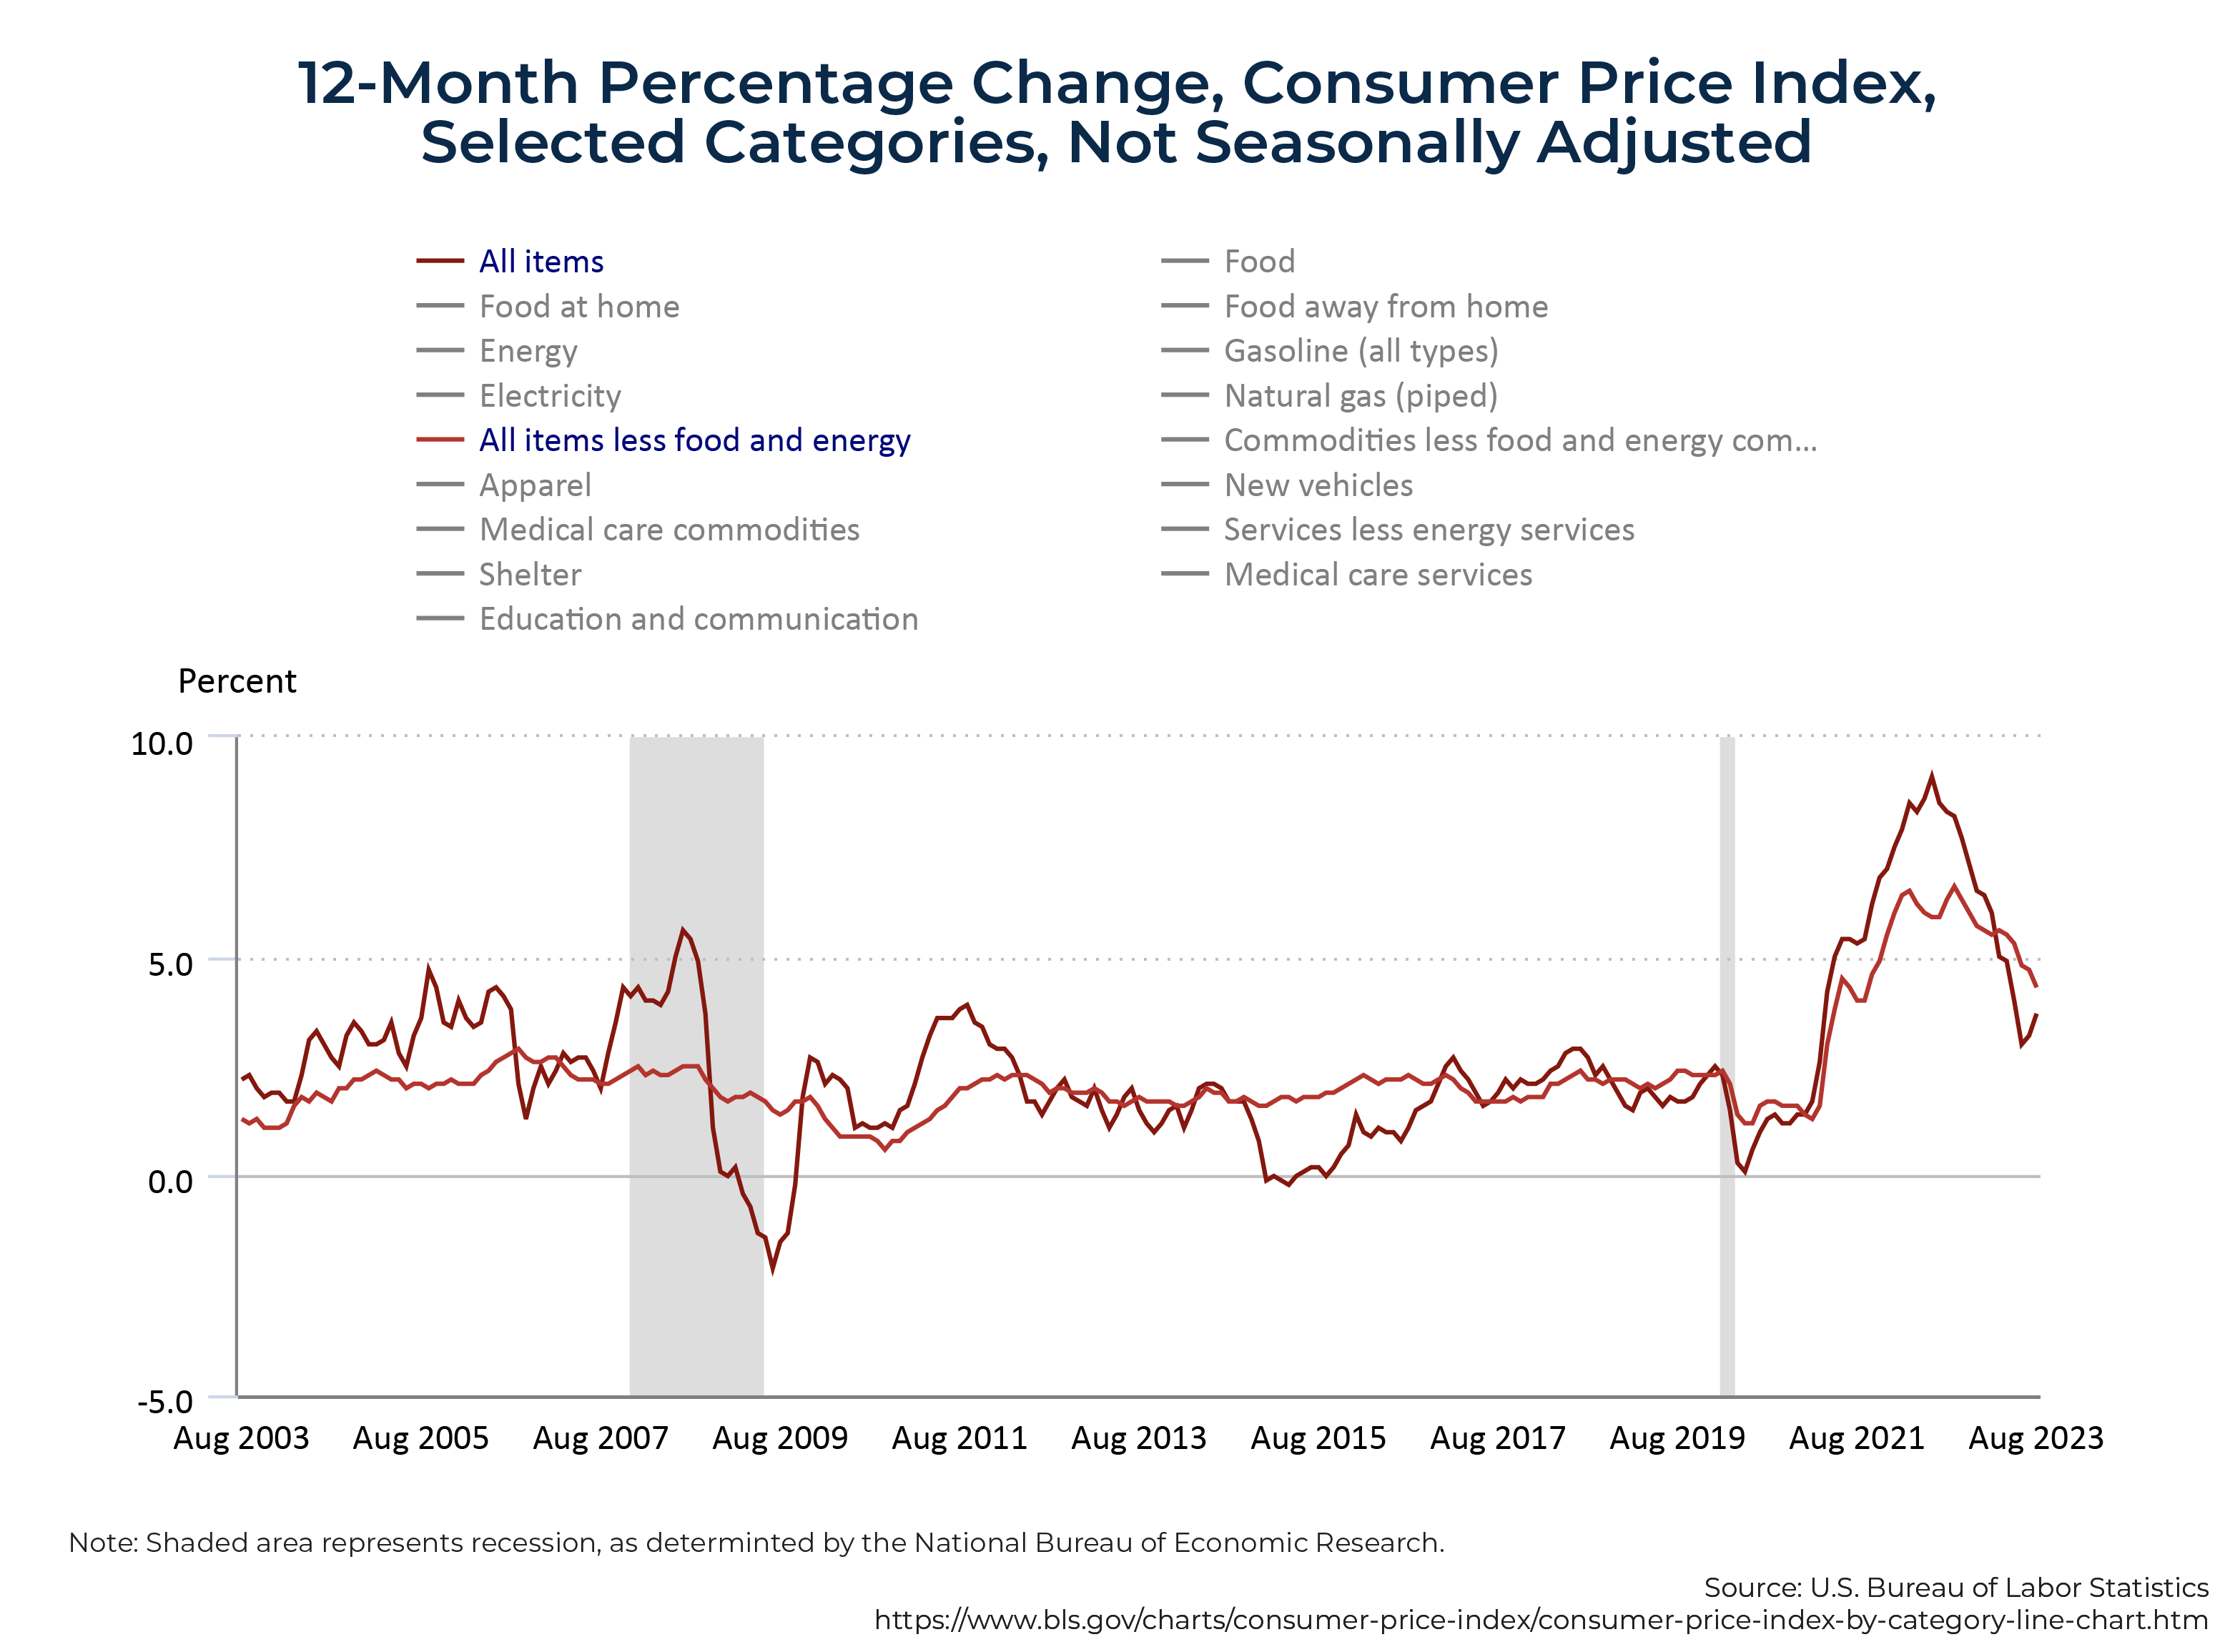
While the rate of inflation has fallen dramatically from its peak of 9.1% in July 2022, it remains well above the Fed's 2% target.
Among the reasons for the persistence of inflation are: The service sector (about 80% of GDP) is strong; the labor market remains tight (unemployment is 3.8%); fiscal stimulus is massive; and while the era of globalization produced deflationary pressures (and stimulated economic growth), the new era of deglobalization is resulting in inflationary pressures (and lower economic growth).
The result is that the Fed is likely to have to remain tighter for longer, increasing the risk of a recession. In addition, the supply of homes is low due to sluggish construction, keeping pressure on prices and rents.
What's Driving Inflation?
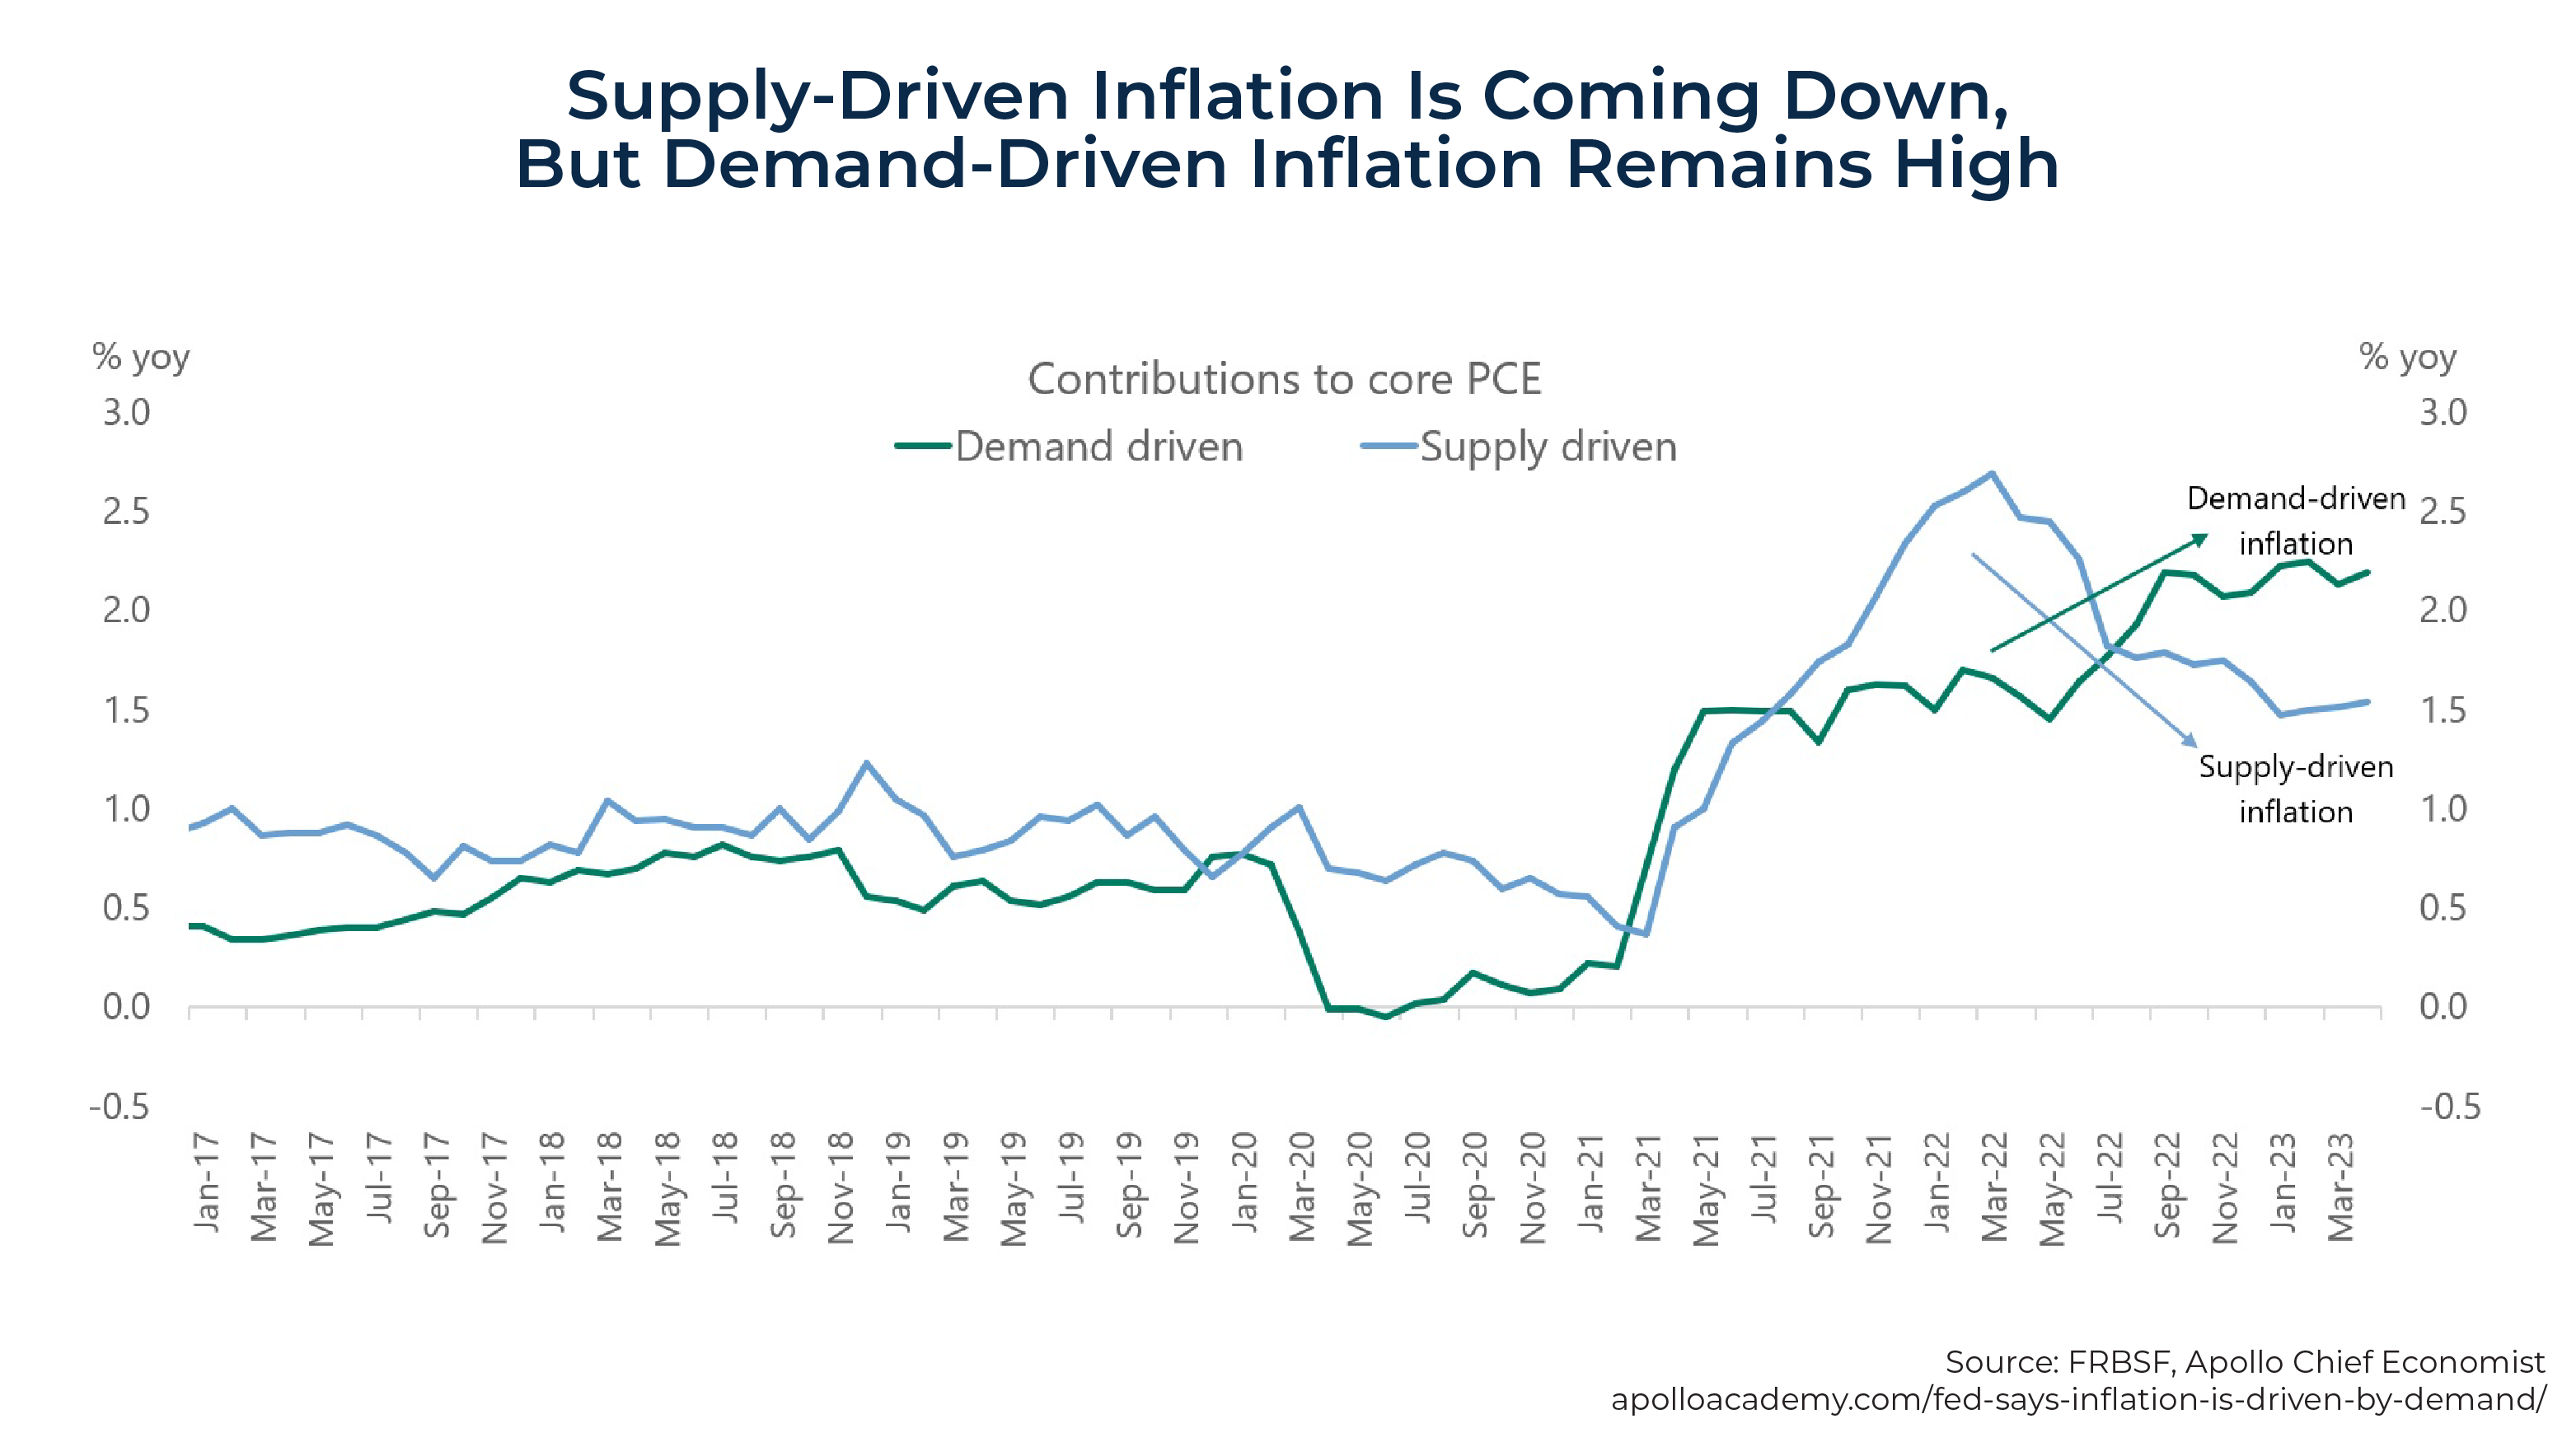
The Fed has calculated how much of inflation is driven by demand and how much by supply, and their latest estimates find that supply is becoming less important and demand inflation remains high and sticky. It identified how big a share of categories of consumer spending experienced a combination of higher prices and higher quantities (demand shock) or higher prices and lower quantities (supply shock). With inflation being driven by demand, more demand destruction is needed in the form of higher rates from the Fed.
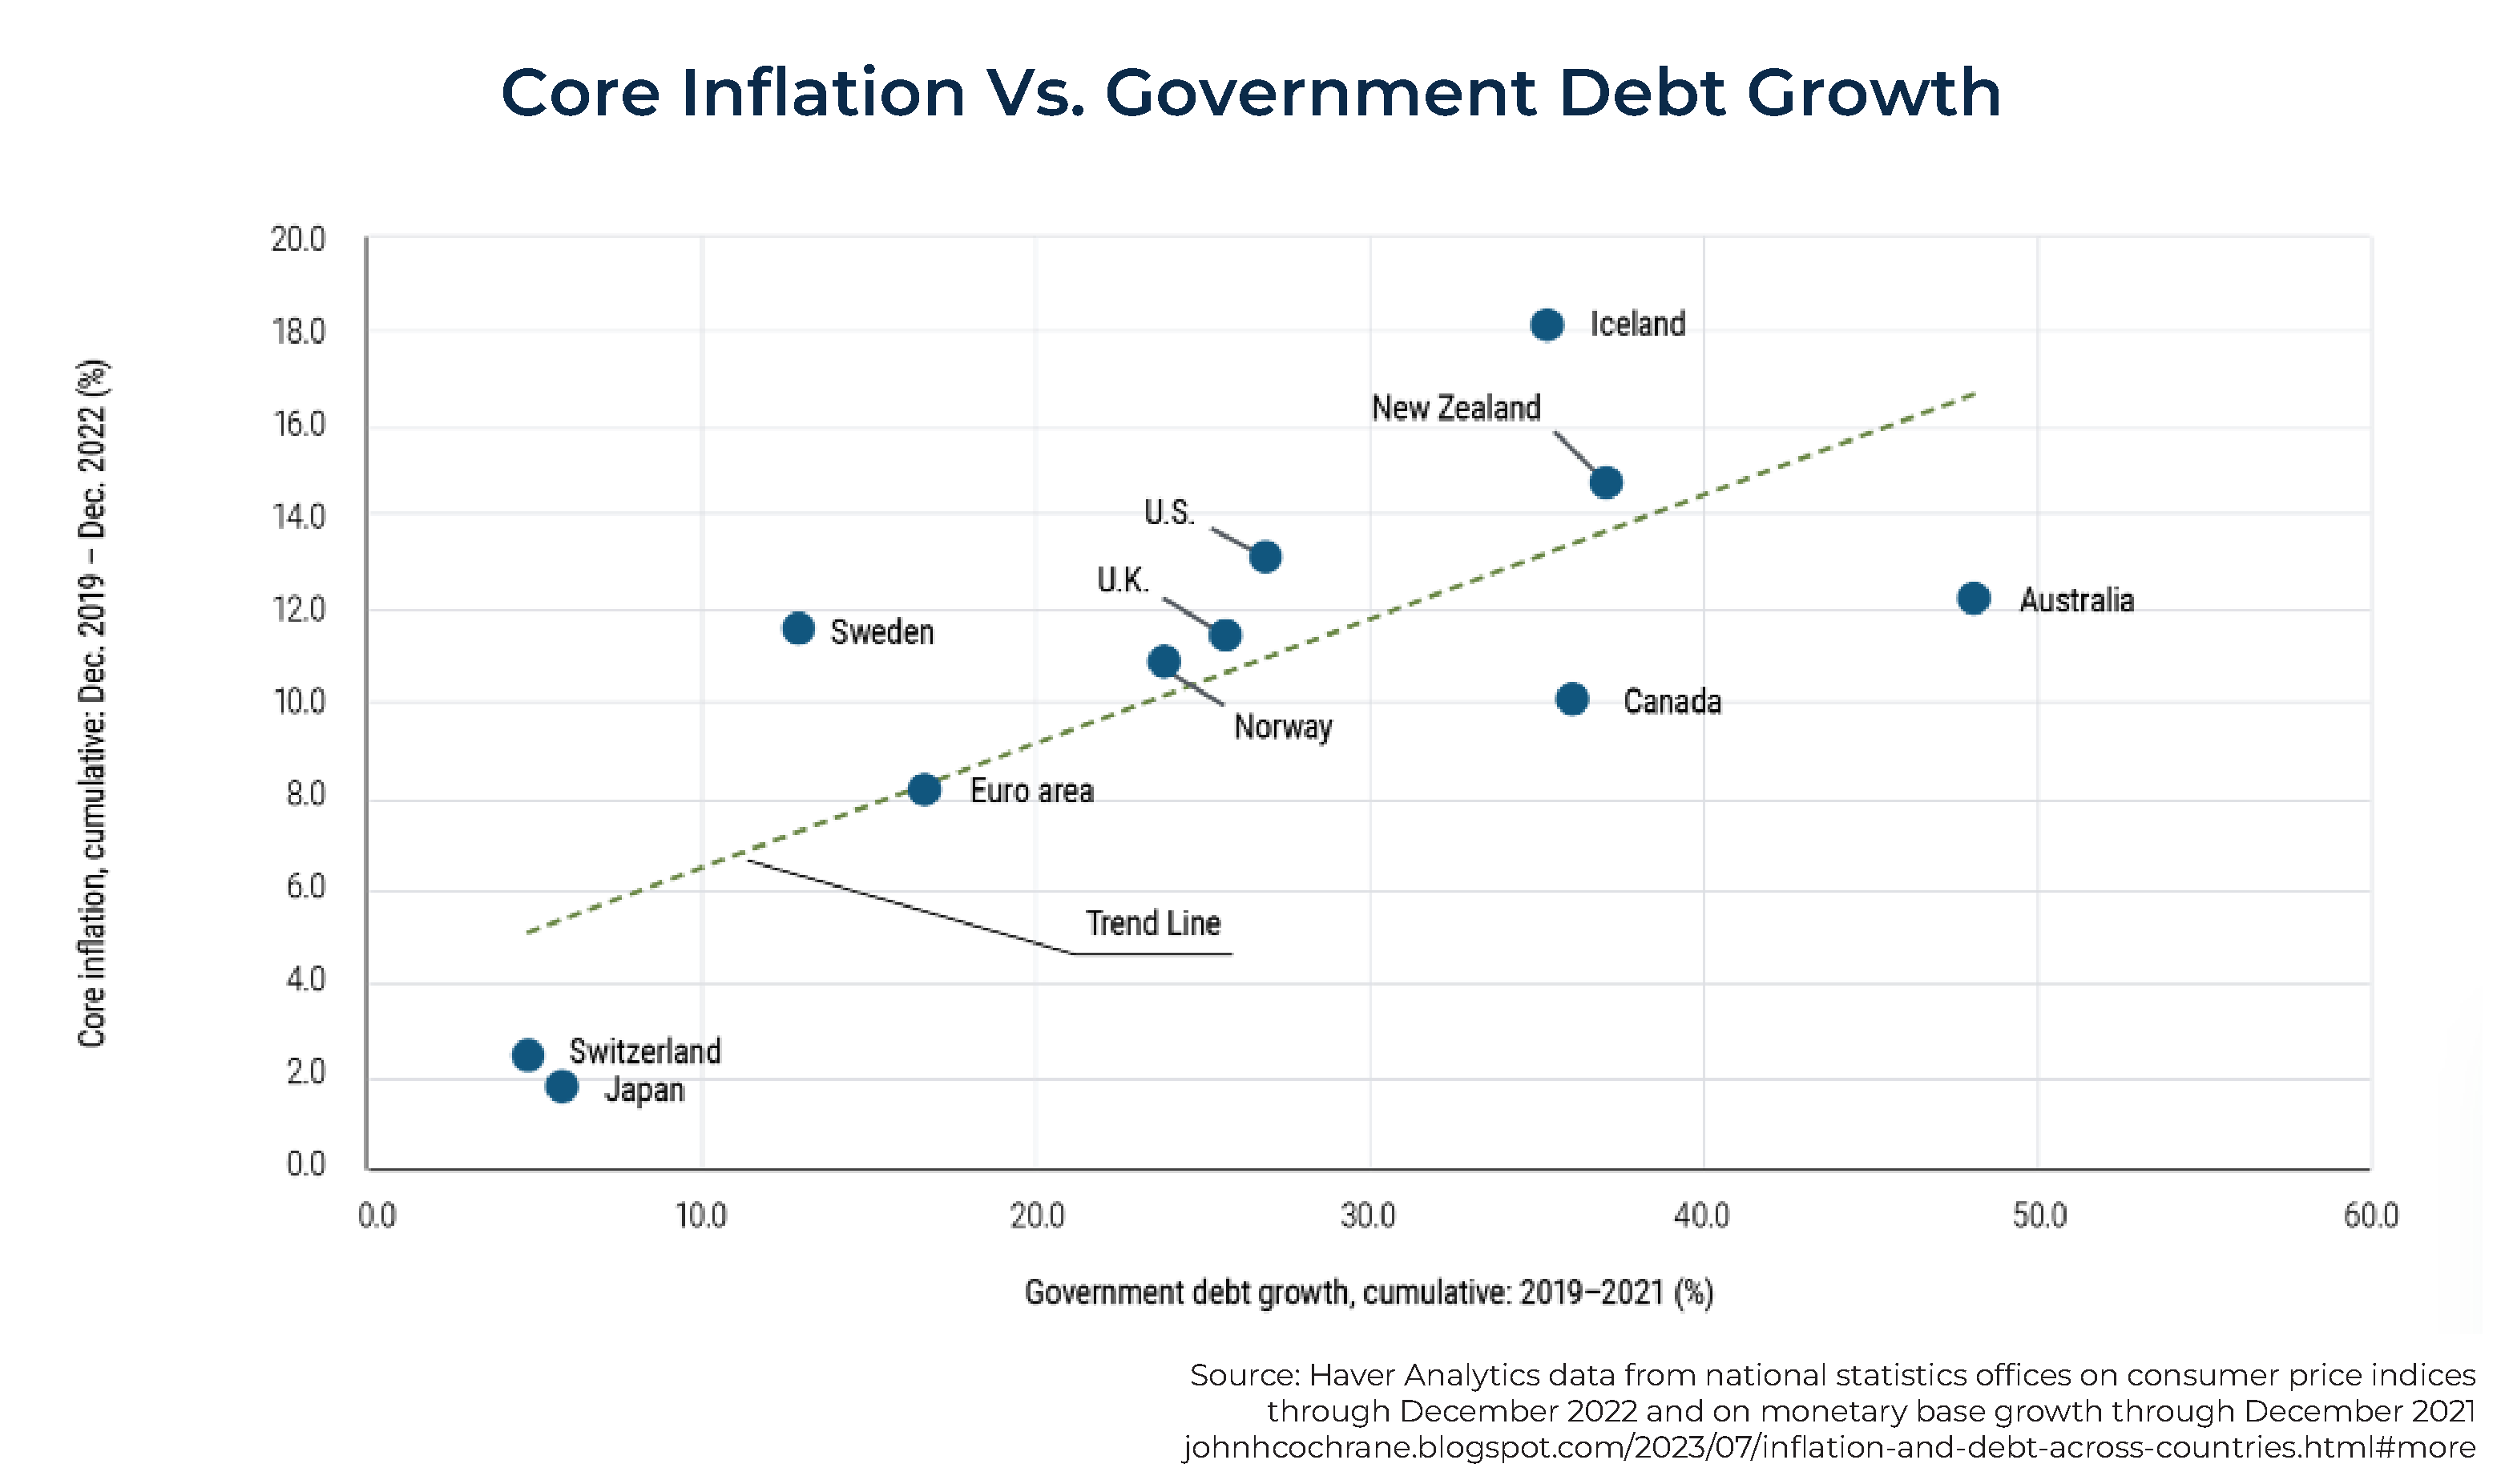
As the following chart indicates, there has been a strong correlation between rising fiscal debt (reflecting fiscal stimulus) and core inflation across the globe. Note how the differences across countries in inflation line up with the size of the COVID-19 fiscal expansion.
Digging into the sources of inflation, we find that one of the biggest contributors to the rate of increase has been auto insurance due to higher costs of cars and repairs (more technology is built into cars). Insurers are imposing steep increases on auto insurance rates: a 40% increase by Allstate in Georgia, a 32% rise sought by Nationwide Mutual Insurance in California, and an 11% bump by State Farm in New York. They are getting big bumps because they have suffered big losses. Car insurance premiums could keep increasing through the end of 2024. "Rates need to rise probably 5 to 10 percent in each of the next couple of years because the loss trends have gone up so much," said Dale Porfilio, chief insurance officer at industry group Insurance Information Institute. Premiums are increasing faster than other inflation-hit items such as rent and food. Car insurance rates increased 19.1% in the 12 months to August, more than 5 times the 3.7% rise in overall inflation.
On the positive side, used car prices, a key measure of inflation, fell 4.2% in June, their biggest monthly drop since the early days of the pandemic. They fell another 1.2% in July and were down 5.6% year-over-year. Rising interest rates and bigger discounts on new cars are sapping demand for used vehicles, which is lowering the prices they fetch at auctions that dealers use to buy and sell previously owned vehicles.
Pricing is also taking a hit because dealers have almost fully replenished inventory on used car lots that were depleted by shutdowns and supply shortages during the pandemic. A prolonged auto strike could quickly change that picture as supply would dry up.
The Growing Government Debt Problem
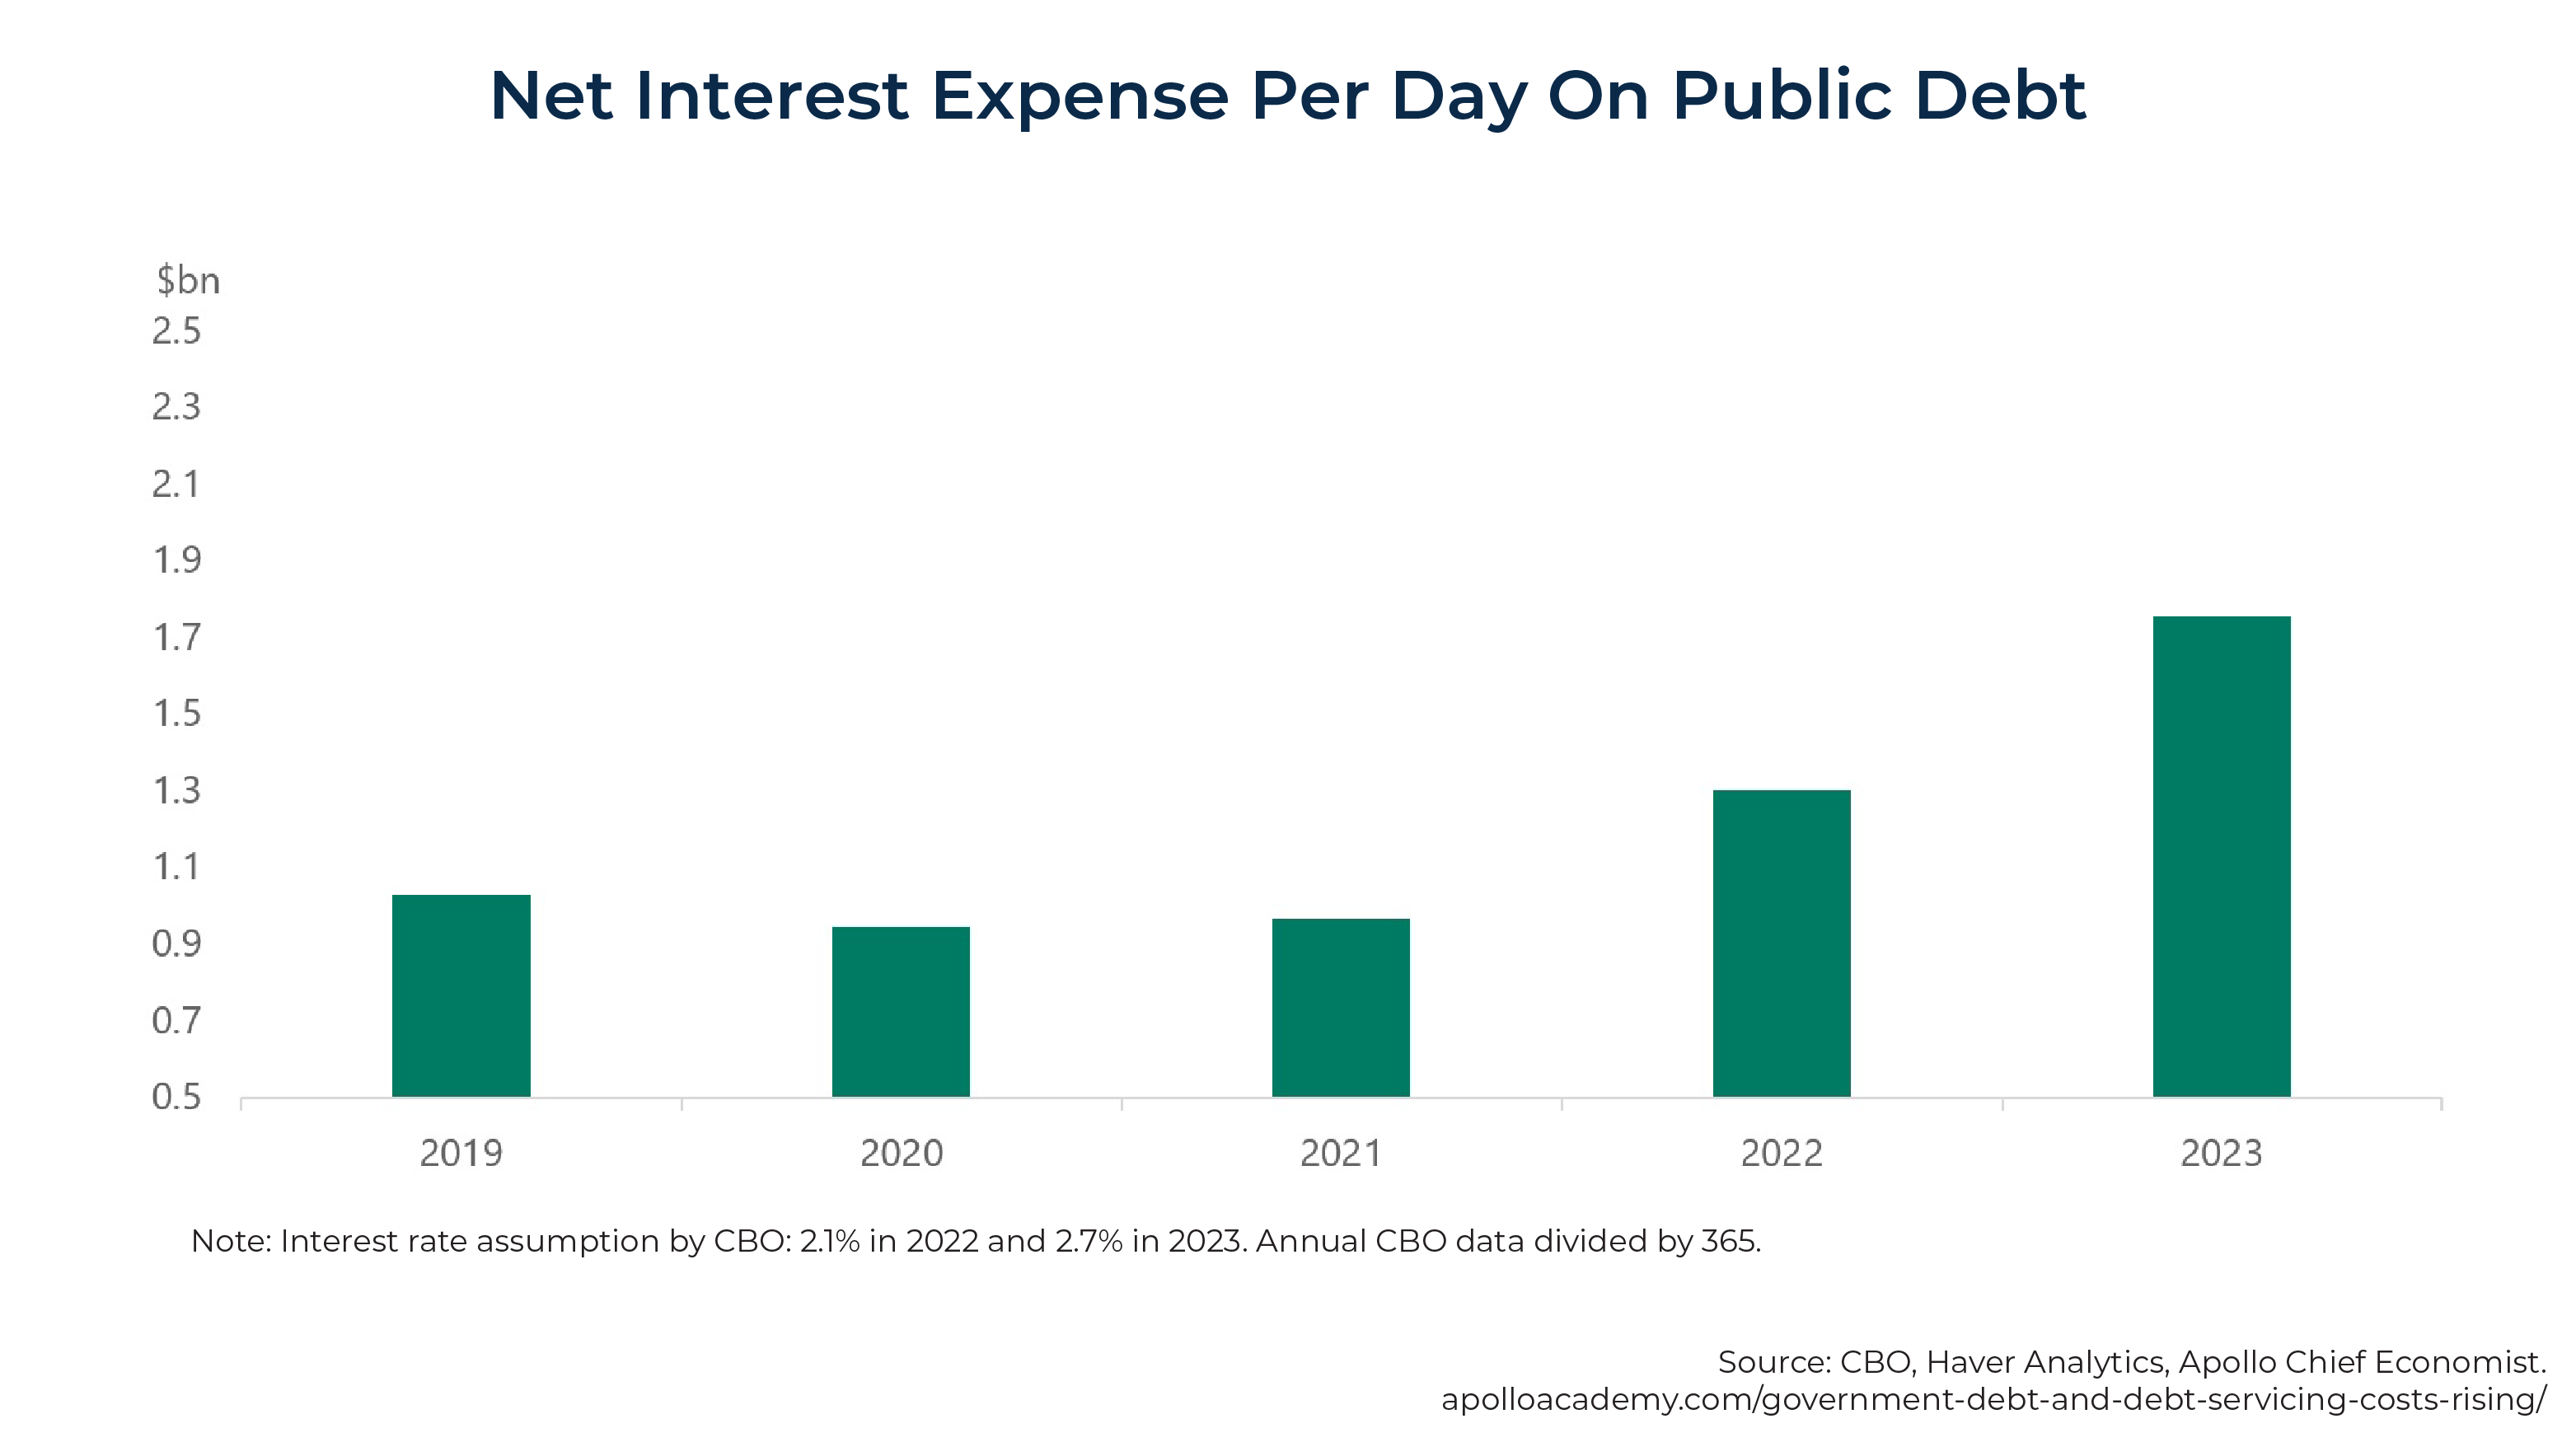
25% of all U.S. government debt outstanding has been added since the beginning of 2020. By the end of July, total public debt had reached almost $33 trillion, an increase of almost $400 billion in just 1 month. And with higher debt levels and higher interest rates, debt servicing costs have increased from $1 billion per day in 2020 to almost $2 billion per day in 2023.
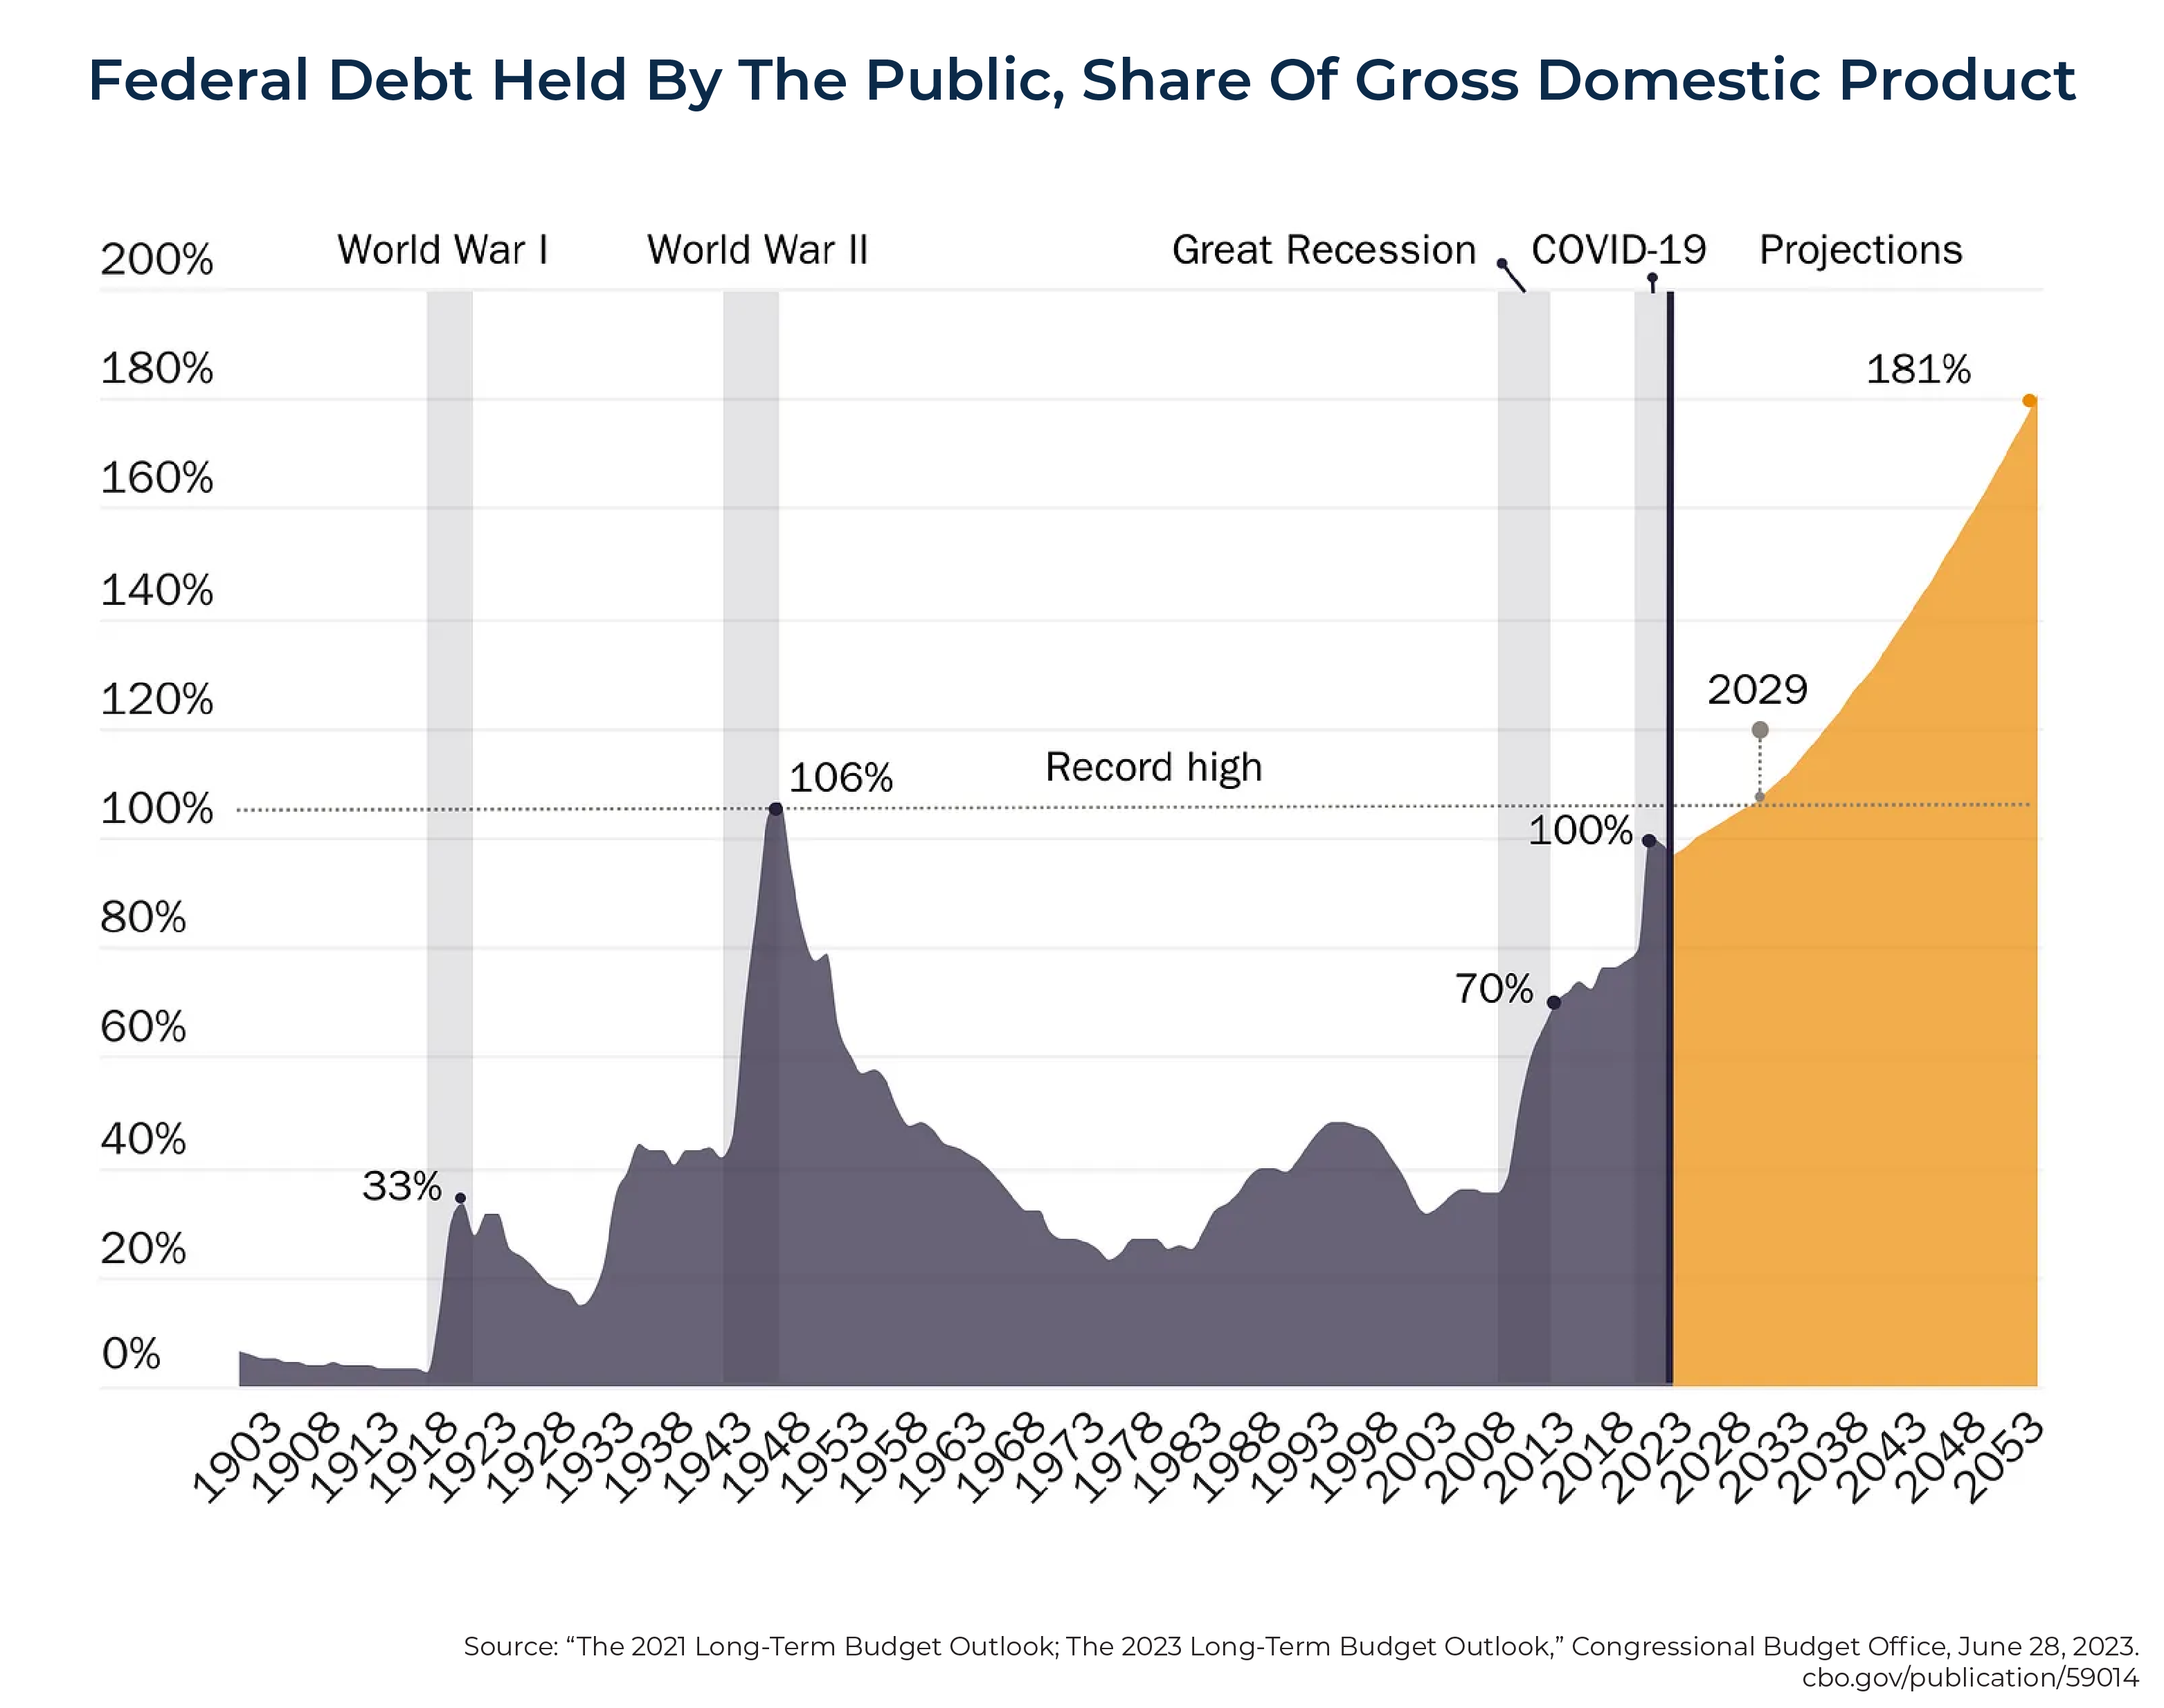
According to the Congressional Budget Office's (CBO) latest long‐term budget outlook, publicly held debt will grow from 98% of GDP to 181% of GDP by 2053. Most economic research finds that excessive public debt reduces economic growth, with dampening effects kicking in when debt reaches around 78% of GDP.
The Cato Institute think tank reports that the country's ever-expanding debt is now an issue of national security and that entitlement reform is a necessity, as the current growth rate of our debt is unstainable. Entitlement spending is driving the unsustainable growth in Federal debt. Between 2023 and 2053, total Federal spending is expected to increase from 24.2% to 29.1% of GDP. That's nearly 1/3 higher than the 30‐year historical spending average (21% of GDP) spanning 1992–2022.
Major entitlements, like Social Security and Medicare, are almost entirely responsible for non‐interest spending growth. In 2023, Social Security and Medicare's combined contribution to the deficit was 2.1% of GDP. By 2053, their annual deficit contribution is expected to be 5.4% of GDP. That's more than half or 54% of the total deficit in 2053 due to spending on Social Security and Medicare (assuming additional borrowing past trust fund exhaustion and no other policy changes).
The authors of the Cato Institute's National Security Implications of Unsustainable Spending and Debt stated:
Delaying responsible fiscal reforms in the face of growing federal debt invites economic and national decline. High and rising U.S. federal debt leads to suppressed private investment, reduced incomes, and increased risk of a sudden fiscal crisis. A weaker economy and growing concerns by international bondholders of U.S. treasuries about the government's ability and willingness to service its debt – without resorting to high inflation – will drive up interest costs and eventually impact America's international standing negatively. … National defense is a core responsibility of the federal government. To maximize Americans' safety and prosperity, prudence should guide both strategy and the budget. A dire fiscal crisis would erode the economic foundation of America's strength, limiting U.S. capacity to defend its vital interests at home and abroad.
The unsustainability of the current fiscal situation led Fitch, on August 1, 2023, to downgrade the U.S. Long-Term Foreign-Currency Issuer Default Rating to AA from AAA. At the same time, it removed its negative watch and assigned a stable outlook. Fitch stated: "The rating downgrade of the United States reflects the expected fiscal deterioration over the next three years, a high and growing general government debt burden, and the erosion of governance relative to 'AA' and 'AAA'-rated peers over the last 2 decades that has manifested in repeated debt limit standoffs and last-minute resolutions." They also cited the underfunding of Social Security, Medicare, and Medicaid (along with the aging population) and the lack of political will to address the problem.
While many criticized the downgrade, saying it was unnecessary, some facts support the move: The U.S. ratio of interest payments to revenue is projected by Fitch to reach 10% by 2025 compared to a 2.8% average for the other AA-rated sovereigns and 1% for the AAA-rated. The simple arithmetic will become nasty if the inflation-adjusted rate on the debt rises above the economy's underlying growth rate, which it seems likely to do. The 2023 deficit of 6.3% of GDP is an indefensible figure when the economy is at full employment – because at full employment, we should be running large primary surpluses, not deficits. The problematic arithmetic of rising rates on a large stock of debt is already kicking in.
The ratings downgrade itself could result in higher interest costs on our debt due to reduced confidence in our ability to repay the debt. In turn, that could lead to sales of Treasury debt by foreign investors, putting upward pressure on interest rates and exacerbating the debt issue, especially if the fiscal problem is not resolved. Unfortunately, the outlook is not good, as Fitch forecasts a fiscal deficit of 6.6% of GDP in 2024 and a further widening to 6.9% of GDP in 2025. These are unsustainable levels. Another problem with rising debt-to-GDP levels is that they would likely limit our ability to respond to future contractions in the economy with fiscal stimulus.
In summary, estimates from econometric studies of highly indebted industrialized economies indicate that the government expenditure multiplier will be positive for the first 4 to 6 quarters after the initial deficit financing and will then turn negative after 3 years. This implies that a dollar of debt-financed Federal expenditures eventually reduces private GDP. In other words, today's stimulus is tomorrow's burden.
Having reviewed the positives and the concerns, and keeping in mind that everything reviewed is well known by the markets (and thus incorporated into prices), what do professional economists forecast for the economy? The consensus forecast should be considered 'the wisdom of crowds'.
Philly Fed's 3rd Quarter 2023 Survey Of Professional Forecasters
The 3rd quarter 2023 survey, released on August 11, projects real GDP will grow 2.1% in 2023, with 1.9% growth in the 3rd quarter and 1.2% growth in the 4th – not a single quarter of negative economic growth, let alone a recession, but just a 'soft landing'. They also forecast that economic growth will remain weak in 2024 (growth of just 1.3%). The forecasters have also slashed their estimate of the risk of a downturn in real GDP in the 3rd quarter to 21.7% compared with the estimate of 45.2% in the prior survey.
Their estimates of the odds of a recession occurring in the following 4 quarters are 34.4%, 37.6%, 35.4%, and 34.4%, respectively. The takeaway is that it is important for investors to treat the mean forecast of 1.3% real growth in 2024 in a probabilistic, not deterministic, way.
The forecasters predict the unemployment rate will increase from its current rate of 3.5% to 3.7% in the 4th quarter of 2023, 3.9% in the 1st quarter of 2024, 4.0% in the 2nd quarter, and 4.1% in the 3rd quarter. The full-year unemployment is forecast at 4.0%.
In terms of inflation, the consensus forecast is for the Core (headline) CPI to fall to 4.1% (3.1%) in 2023 and 2.7% (2.7%) in 2024. While moving in the right direction, that's still well above the Fed's 2% target.
We turn now to the outlook for U.S. equities.
U.S. Equities Outlook
While investors have many reasons to be less than optimistic as most central banks around the globe continue to engage in more restrictive monetary policy to fight the unexpected inflation surge, valuations already reflect that concern. As of September 28, Morningstar showed that Vanguard's U.S. Total Stock Market Fund (VTSMX) had a Price-to-Earnings (P/E) ratio of 19.5. Its Developed Markets Index Fund (VTMGX) had a P/E of about 13.0, and its Emerging Markets Stock Index Fund (VEIEX) had a P/E of 13.2. Value stocks are trading as if we are already in a serious recession. As examples, Avantis' U.S. Small-Cap Value ETF (AVUV) was trading at 9.1 times earnings; its International Small-Cap Value ETF (AVDV) was trading at a multiple of 8.0; and its Emerging Markets Value ETF (AVES) was trading at a multiple of just 8.4. On the other hand, the large-growth stocks are trading at historically very high valuations. For example, the Vanguard Growth ETF (VUG) was trading at a P/E of 29.5.
The Earnings-to-Price (E/P) yield is as good a predictor as we have of future real returns. Thus, a P/E of 29.5 translates (based on its reciprocal) to an expected (not guaranteed) real return of 3.4%; a 19.5 P/E translates to an expected (not guaranteed) real return of about 5.1%; and a P/E of 9.1 translates to an expected (not guaranteed) real return of 11.0%.
For stocks, it doesn't matter to markets whether the future news is good or bad, only whether it is better or worse than expected. The markets appear to be anticipating the worst possible outcomes, at least for value stocks, as valuations are near levels reached at the depth of the Great Recession.
The stock market is a leading economic indicator. As such, markets tend to bottom well before economic indicators such as GDP, payrolls, earnings, housing, peak delinquencies in corporate debt, and household credit. During the Great Recession, while the economy did not bottom until the end of the 2nd quarter of 2009 and the unemployment rate kept rising through October, the stock market bottomed on March 9, 2009.
What will happen to corporate profits, given what seems likely to be a slowdown in economic activity while labor markets remain tight? The current 2023 earnings forecast for the S&P 500 Index is about $221. With the S&P 500 at about 4,460, that's a forward-looking P/E of about 20. If corporate profits get squeezed because of wage pressures and a slower economy, and earnings were to fall (as would likely be the case in a recession), equities could come under significant pressure, especially if the Fed has to raise rates much beyond 5.5% to subdue inflation.
With that said, there are some clouds on the horizon for corporate earnings and, thus, equity returns.
"The Coming Long-Run Slowdown In Corporate Profit Growth And Stock Returns"
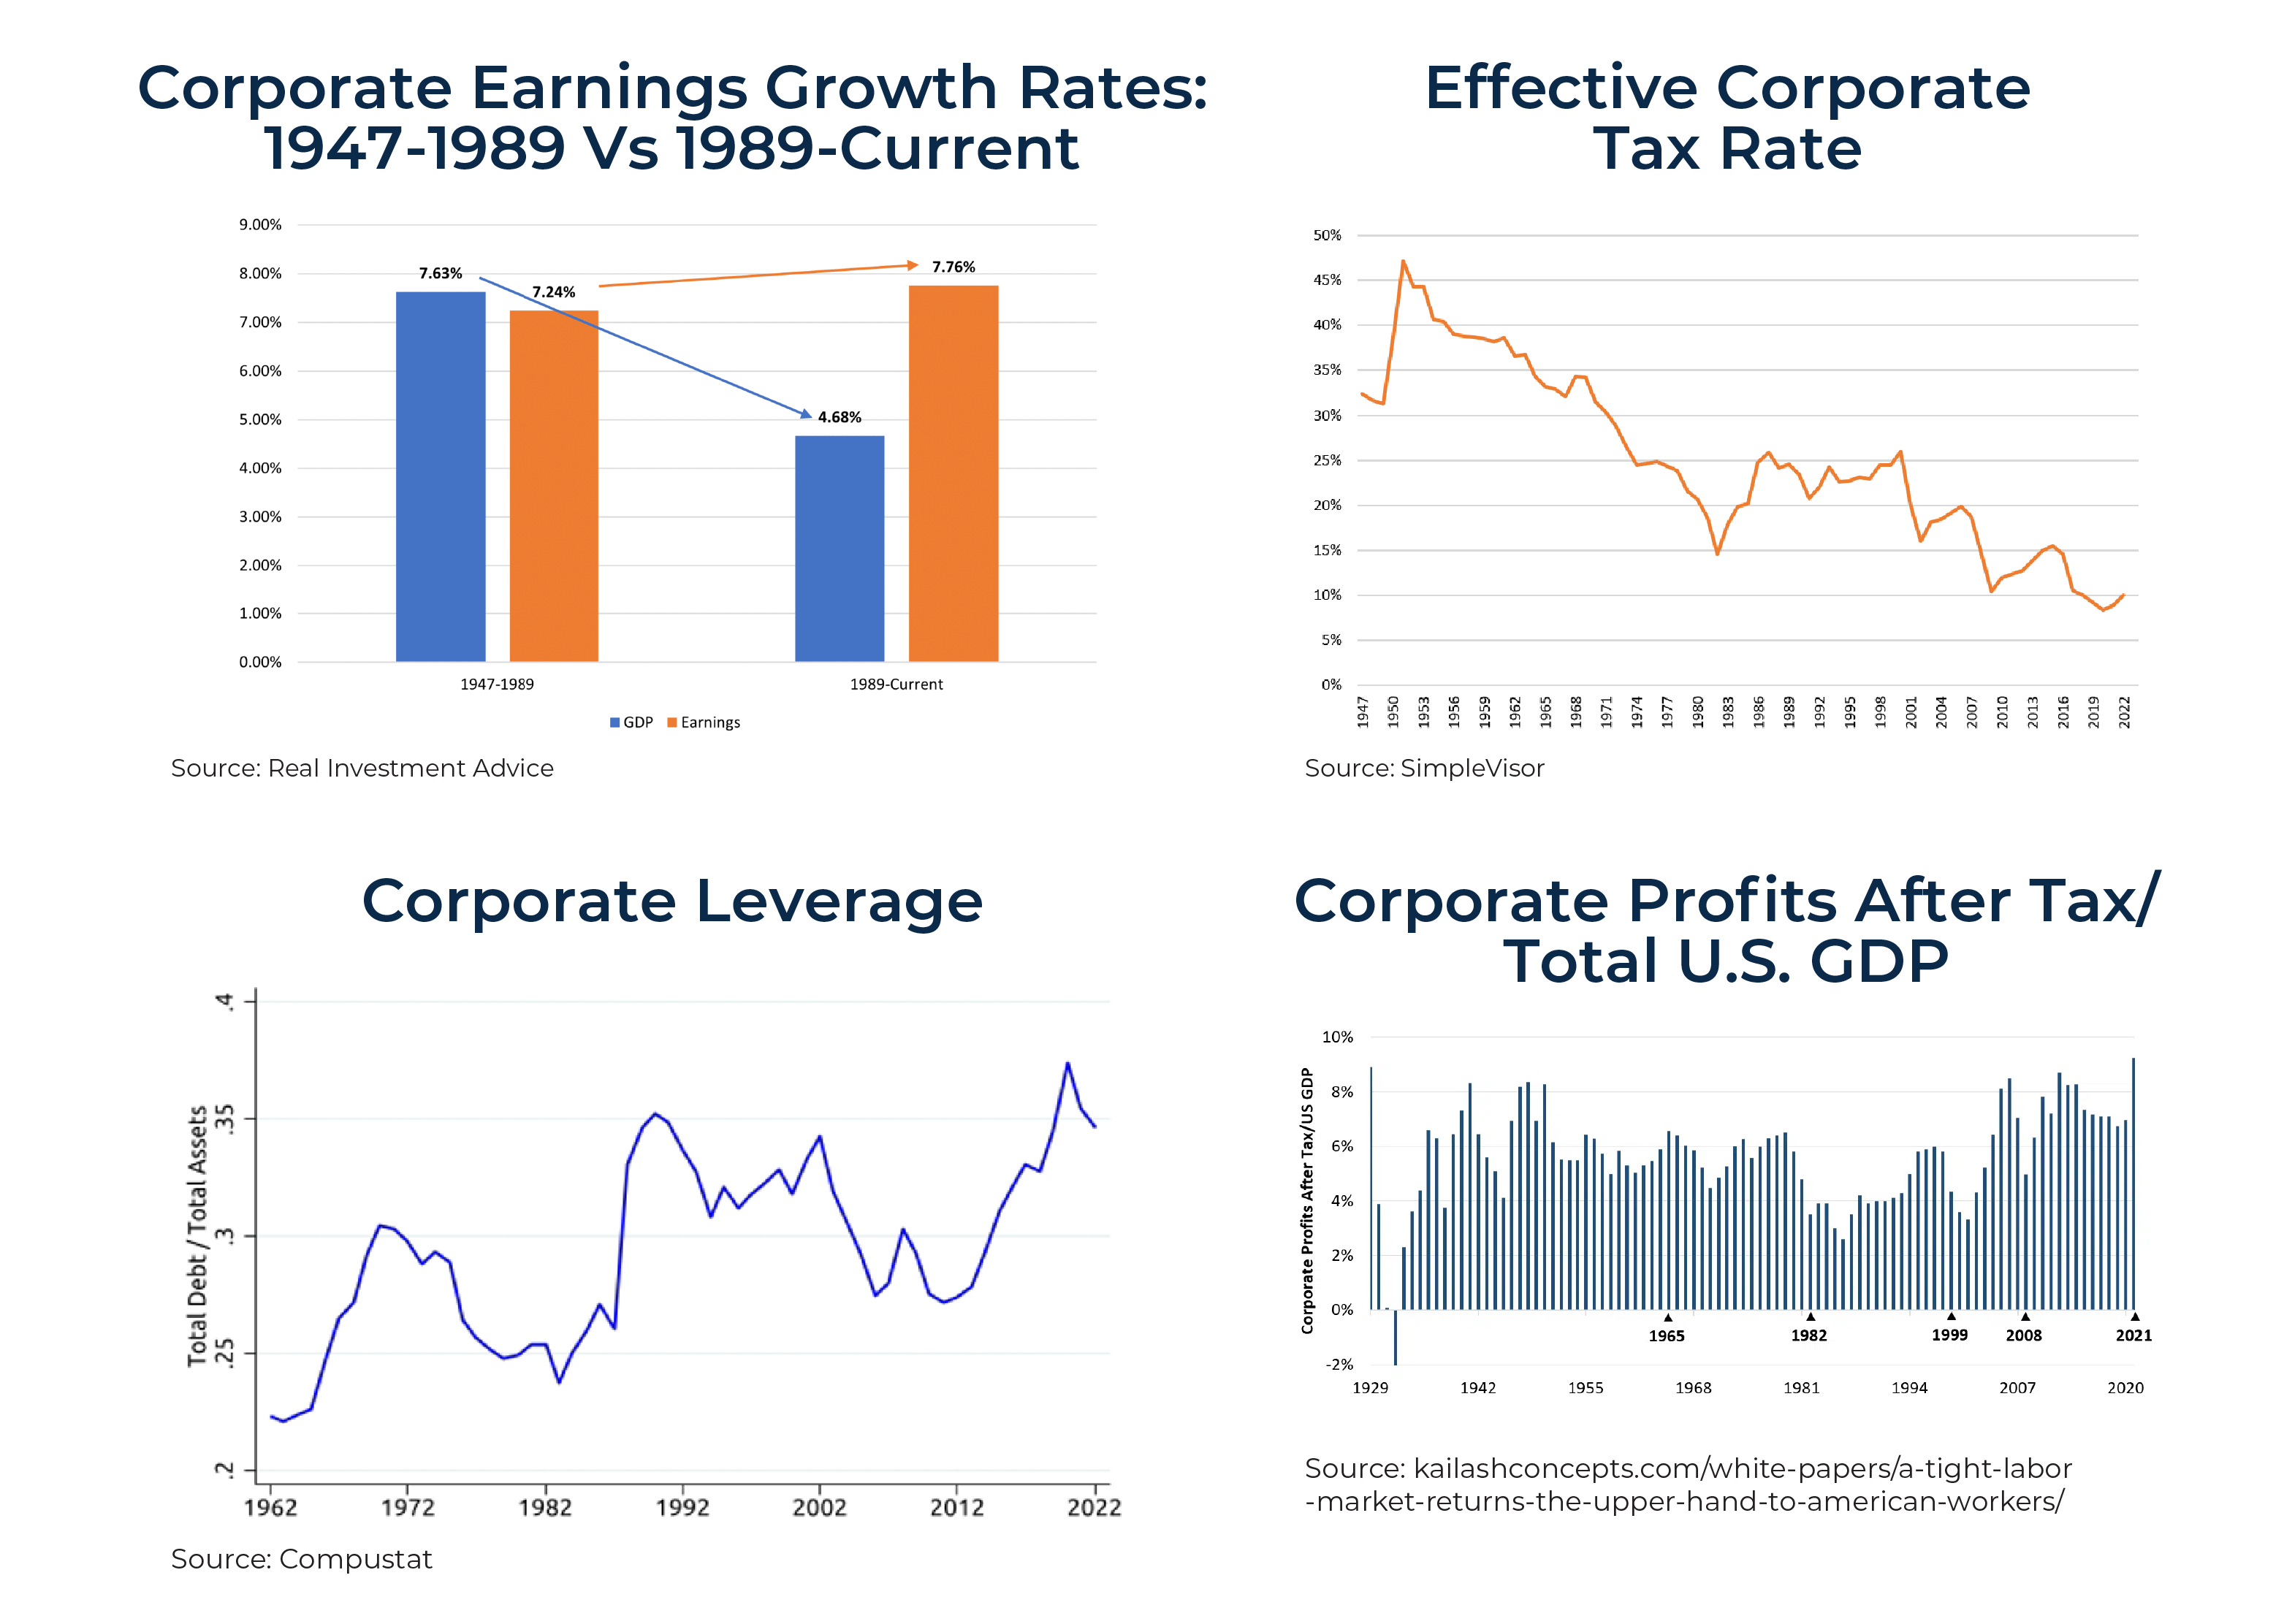
A recent white paper by the Federal Reserve warned of "significantly lower profit growth and stock returns in the future". In that paper, End Of An Era: The Coming Long-Run Slowdown In Corporate Profit Growth And Stock Returns, Michael Smolyansky explained how the interest rate and corporate tax-rate trends for the last 30 years were a strong tailwind for corporate profits. As a result, stocks performed better than would have otherwise been the case.
The graph below shows that despite economic growth shrinking markedly, corporate earnings have grown faster over the last 30 years than in the 40 years before.
Effective Corporate Tax Rate
Corporate profits would have grown by 4.50%, not 7.76%, annually without the boost from lower interest rates, lower taxes, and more leverage (at lower rates). The result is that corporate profits as a percentage of GDP have risen from their historical average of about 7% to over 10% today. In fact, they peaked at 12.25% in June 2022 and dropped to 10.13% by March 2023, as tight labor markets enabled labor to take an increasing share of the GDP, negatively impacting profits.
However, while lower interest and tax rates boosted growth significantly, the ability for that to continue is negligible. Given that Federal deficits will continue to grow faster than the economy, it becomes increasingly unlikely that the government can afford to reduce corporate taxes. In fact, the odds favor raising taxes. And while it is possible that interest rates could fall back to the low levels of the last 10 years, there is little room on the margin for corporations to reduce their effective interest rates meaningfully, especially because many of them already took advantage of the low rates to extend maturities.
Thus, corporate profit growth in aggregate will likely be closer to GDP growth rates in the future, and if tax rates rise, they may even fall below GDP growth. The result likely will be that investors will be unwilling to pay an above-average valuation for what will seem like below-average profit growth. This has implications for valuations, particularly for those of growth stocks.
A concern for investors is that while S&P 500 earnings are currently projected to be about $221, up slightly from 2022's $219, the forecast for 2024 is $248. That would be an increase of about 12% when the forecast for nominal GDP is only about 4% (the Survey of Professional Forecasters projects real GDP growth of 1.3% and inflation of 2.7%). Thus, the market is expecting earnings to grow 3 times faster than the economy at a time when profit margins are coming under pressure due to tight labor markets.
Interest Rate Outlook And The Taylor Rule
In an explanation of the role of John Taylor's contribution to monetary policy research, Apollo Chief Economist Torsten Sløk wrote the following in February 2023:
In 1993, Stanford Professor John Taylor published a paper where he showed that the Federal funds rate has historically been equal to the sum of deviations from the Fed's target for inflation and unemployment. For example, if inflation is above the Fed's 2% target, the Fed funds rate will be higher. And if unemployment is above the Fed's target, the Fed funds rate will be lower.
This relationship where the Fed funds rate can be predicted by inflation and unemployment is called the Taylor Rule, and John Taylor's contribution was to come up with the weights to inflation and unemployment that the Fed has used historically to give the best explanation of the Fed funds rate. The logic with using inflation and unemployment is that those two variables capture the Fed's dual mandate of price stability and full employment.
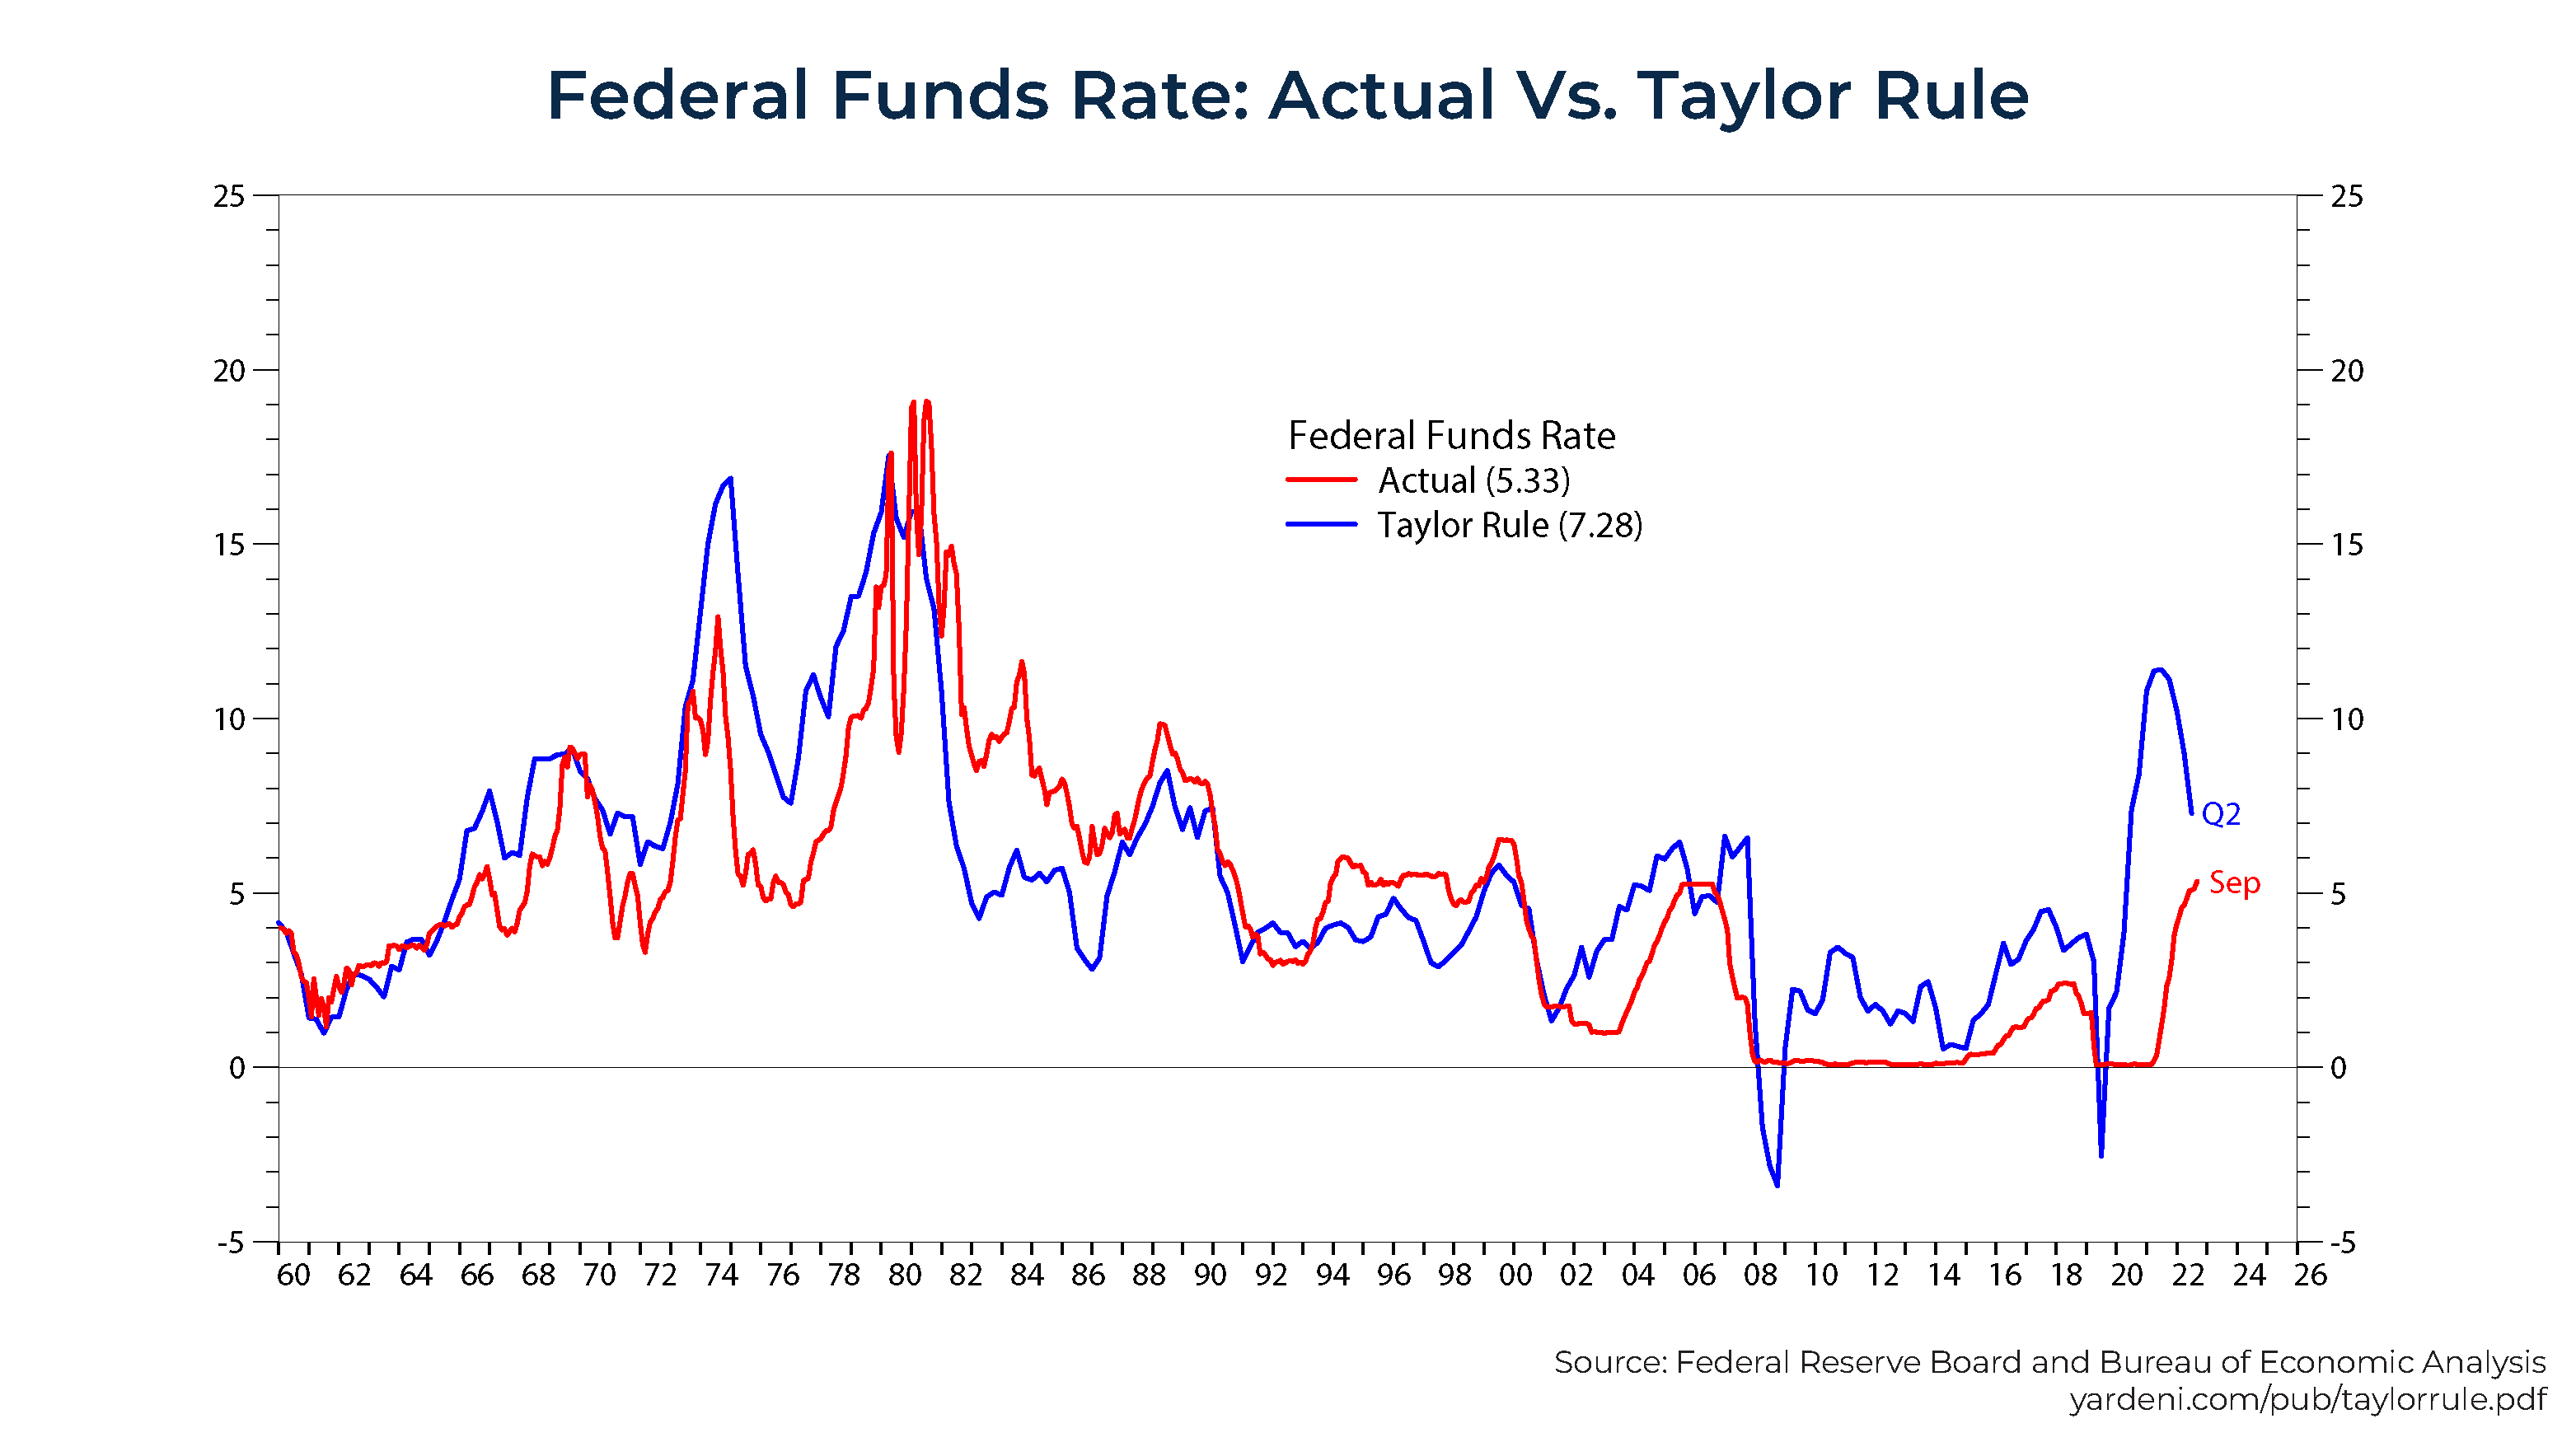
The Fed has used this framework for decades to understand what the Fed funds rate should be, and inserting the current level of inflation and unemployment into the Taylor rule shows that the Fed funds rate today should be 9%. Significantly above the current level of the Fed funds at 4.5%
The bottom line is that the Taylor Rule framework normally used by the Fed for evaluating the stance of monetary policy indicates that it is still significantly behind the curve.
Using more recent data with the Taylor Rule, we can calculate that the Fed funds rate today should be 6.3% based on current inflation and unemployment levels, still well above the current level of the Fed funds rate, increasing the risk that it will have to raise rates further and keep them higher for longer.
Note that in the chart above from Yardeni Research, the graph of the Taylor Rule does not specify the neutral real rate (intercept, referred to as R-star) used (also inflation and output gap data). The R-star level remains heavily debated. In Taylor's original work, the R-star value was 2%. However, estimates were brought in the post-Global Financial Crisis (GFC) era.
Other arguments for interest rates possibly moving higher and/or staying higher for longer are: the Federal Reserve continues to engage in quantitative tightening, reducing its balance sheet by $95 billion a month; the large government budget deficit provides fiscal stimulus to the economy; the Bank of Japan is ending its policy of yield-curve control (suppressing its longer-term yields and pulling down all rates around the world); and there is a significant amount of T-bills outstanding, which need to be rolled into longer-dated Treasury bonds and notes.
It's important to note that higher interest rates aren't bad news for everyone.
Good News from Higher Rates
Higher interest rates are not entirely bad news. For example, millions of Americans have a higher rate on their savings account today than they're paying for their mortgage. Marcus by Goldman Sachs recently raised the interest rate on its high-yield accounts to an all-time high of 4.4%, following the latest hike in the Federal Reserve's key benchmark rate. Other banks offer even higher rates.
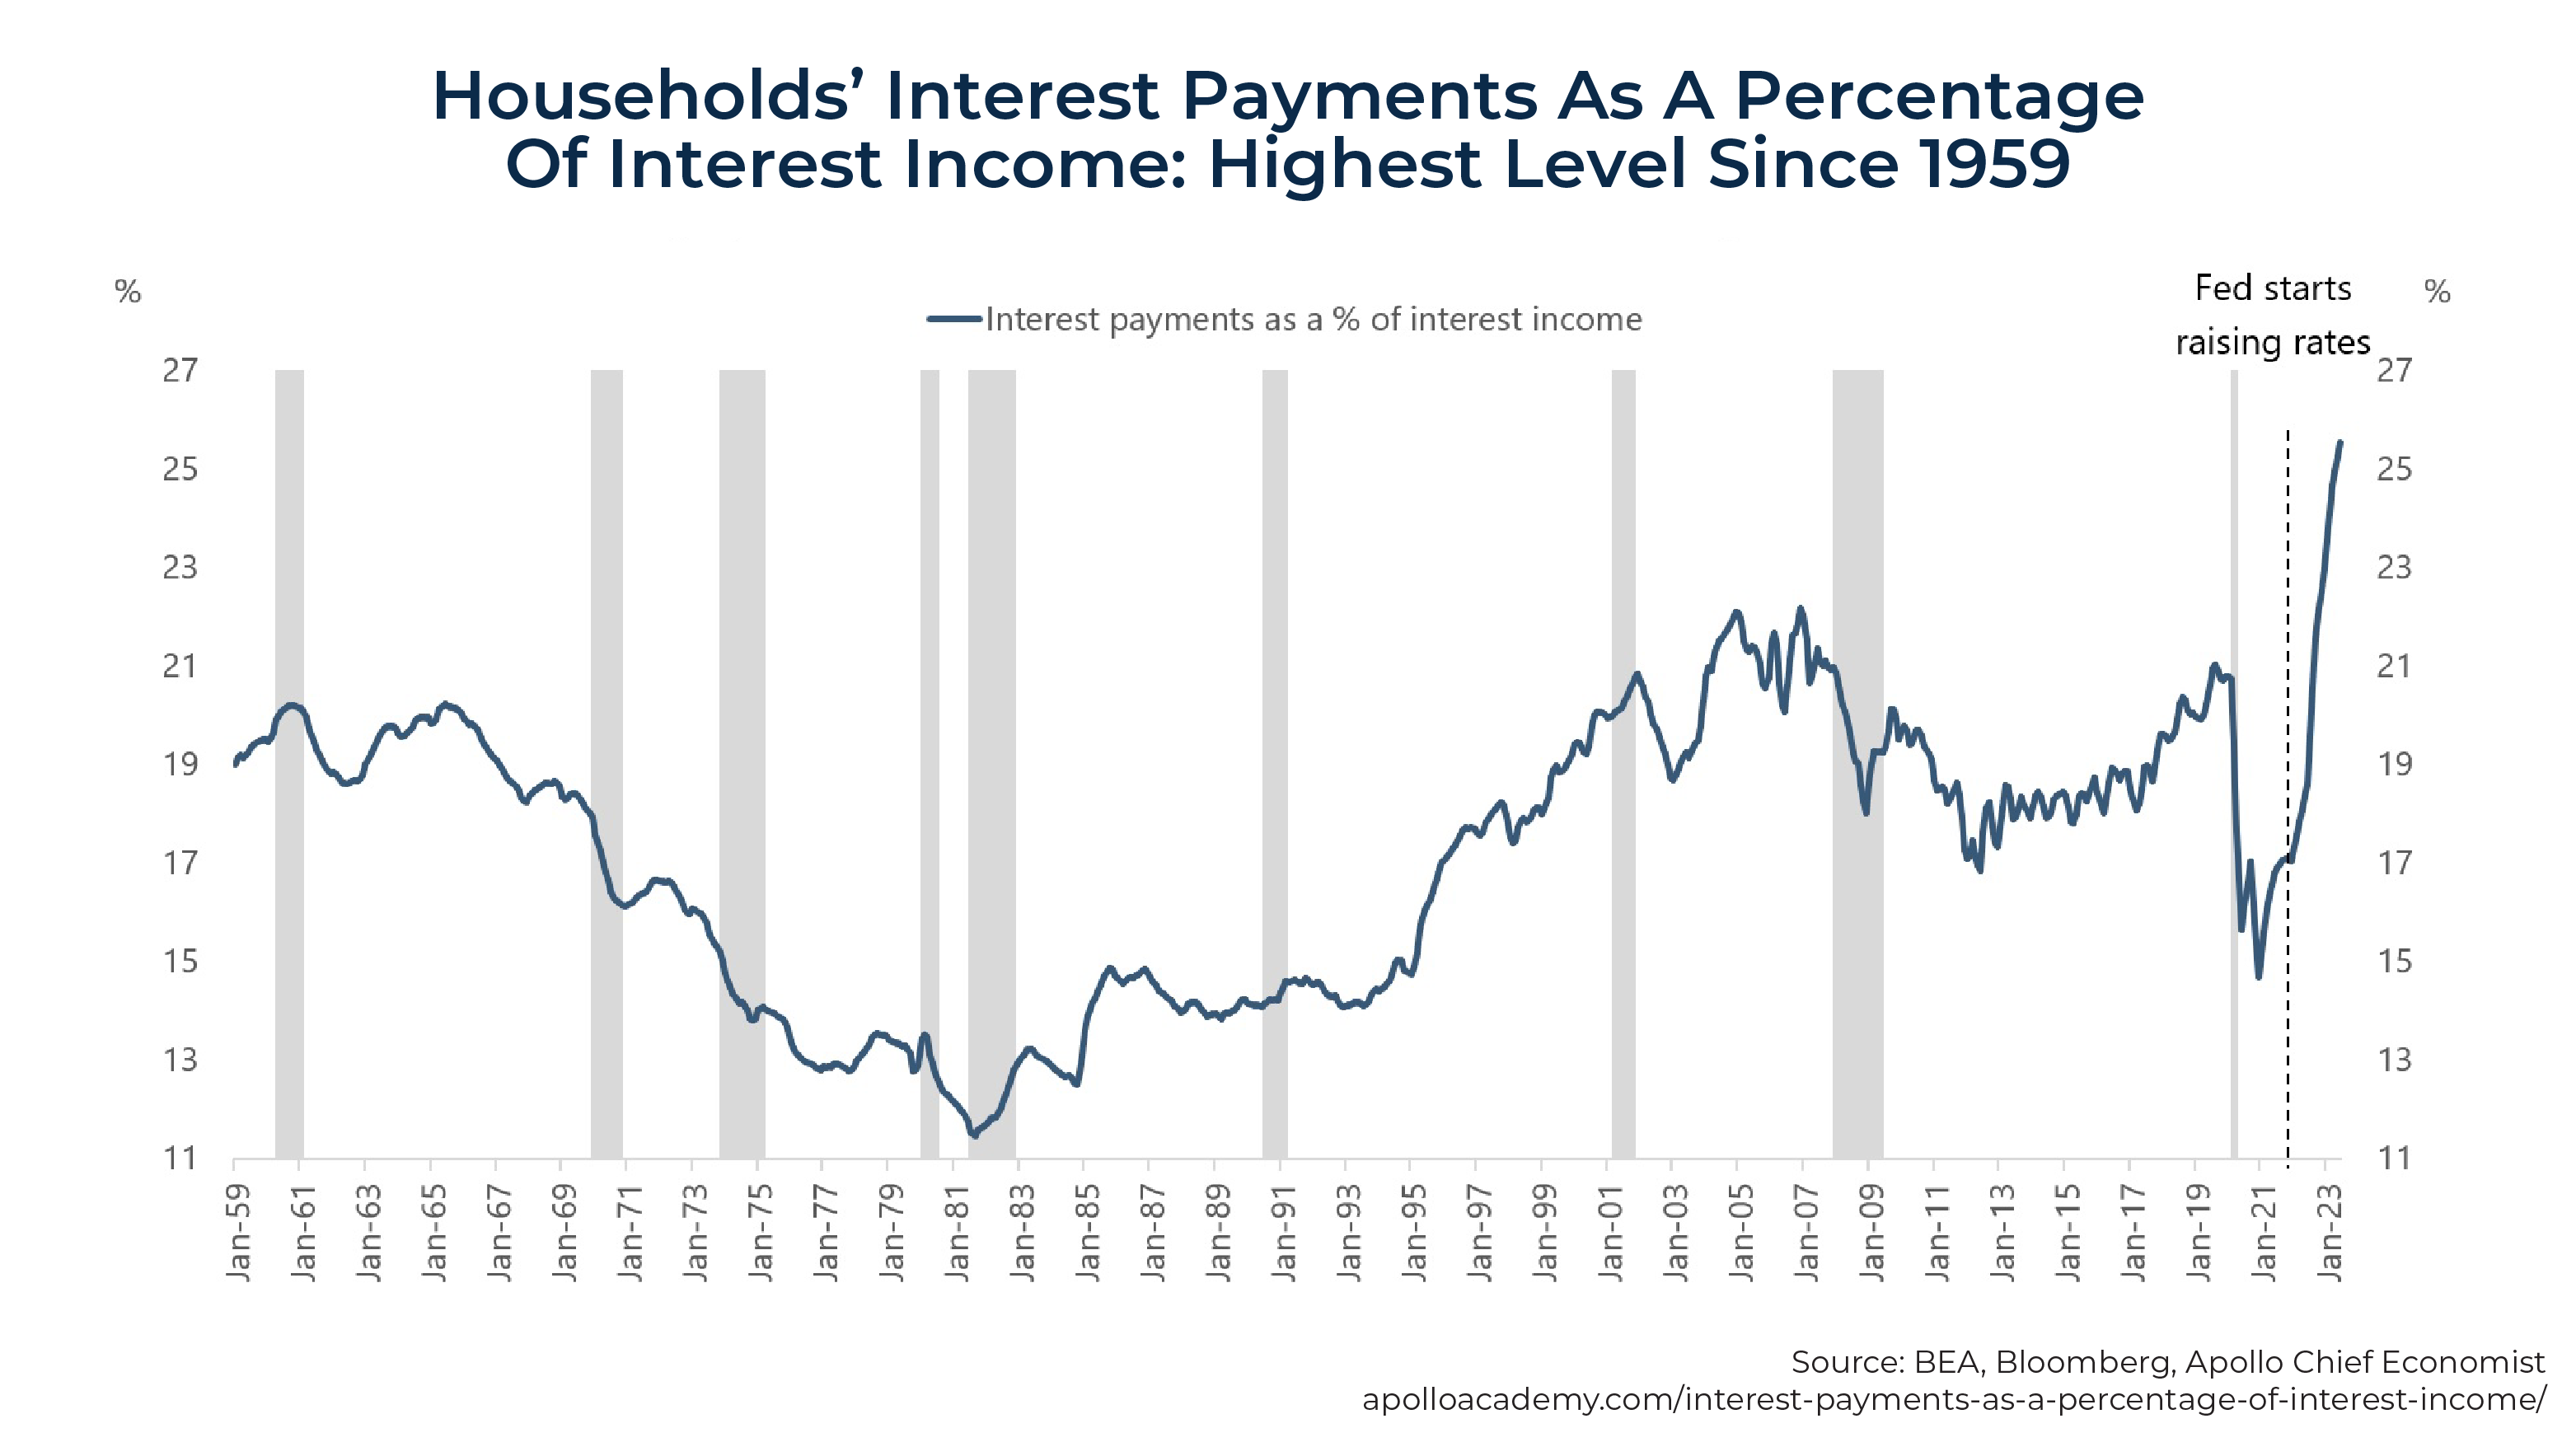
And many elderly homeowners and renters don't have mortgages. As they often rely on savings accounts for income, higher rates are allowing them to keep pace with consumer spending. Unfortunately, dividing households' interest payments with interest income shows that debt servicing costs as a share of interest income are at the highest level since 1959.
While debt servicing costs and interest payments have both increased as the Fed has raised interest rates, debt servicing costs have increased even more.
One benefit from moving away from the Fed's 0% rate policy is that capital is now being allocated more efficiently, and bankruptcy rates for zombie companies will rise sharply as they can no longer finance their operations. This will reduce excess supply and improve the profit outlook in those industries. And higher rates also reduce the risks of speculative bubbles in asset prices.
Summary Of Economic And Market Outlook
The 5 main themes covered were:
- Economy. It's a tale of 2 economies. While the goods sector has been contracting, the services sector remains strong. This is keeping labor markets tight and enabling workers to demand strong wage increases, putting pressure on both inflation and corporate profits. The downside risks to the economic outlook include:
- Households are running out of excess savings.
- Student loan repayments are restarting.
- The potential exists for a government shutdown.
- There could be a prolonged auto strike.
- Delinquency rates, default rates, and bankruptcies are rising for high-yield corporate debt and consumer loans as interest coverage ratios are falling.
- Employment growth is slowing, there are fewer job openings, the workweek is shorter, the quits rate is lower, and wage growth is declining for job switchers.
- The banking sector is tightening lending.
- Oil prices are rising.
- China and European growth is slowing.
- There are higher long-term interest rates.
- The interest cost of Treasury debt is rapidly rising as bonds mature and have to be refinanced.
- Economic nationalism is increasing.
- Inflation. The strong services sector, tight labor markets, continued fiscal stimulus, trend toward deglobalization, years of underinvestment in infrastructure and housing, weak productivity due to working from home, and monetary policy that has yet to turn truly restrictive means inflation is likely to remain higher for longer than the Fed would like.
- Interest rates. The persistence of inflation, significantly higher than the Fed's 2% target, along with the need to finance the large fiscal deficits and to refinance all the debt maturing in the next year, will likely lead to rates remaining higher for longer.
- Access to capital. The problems of the banking system mean that credit conditions will likely continue to remain tight for an extended period. That will make it more difficult for companies to access capital and roll over existing loans when they mature. Investors should expect defaults and losses to increase in sectors that are most susceptible to higher interest rates and the economic cycle. The equity and debt securities of higher-quality companies are likely to perform better in such an environment, and private credit is likely to be a beneficiary.
- Valuations. While valuations of U.S. large growth companies are elevated, and earnings forecasts for 2024 seem aggressive, the valuations of small-value stocks are trading as if the next great recession were already upon us.
There is one final concern we need to cover.
Clouds On The Horizon: Geopolitical Risks
In addition to the geopolitical risks created by the ongoing war in Ukraine, increased nationalism (sometimes in the name of national security) is creating the risk of a 'tit for tat' trade war, which would not only slow global growth but increase inflation (via tariffs and other impediments to trade) and lead to increasing fiscal deficits (through tax incentives granted), increasing the risk of recession. The inappropriately named "Inflation Reduction Act" is a good example, with incentives to favor domestic purchases to which other nations will surely respond. This is a risk investors should not ignore.
What Should Investors Do?
First, be prepared for volatility, especially if Congress is unable to avoid a shutdown of the government at the end of the 3rd quarter and/or trade tensions increase. The surge in deficit spending at a time of overall growth in the economy is likely to shape a fierce debate on Capitol Hill about the nation's fiscal policies as lawmakers face a potential government shutdown this fall and choices over trillions of dollars in expiring tax cuts.
As of September 28, the VIX (a measure of the market's volatility) was trading at about 17, about 15% below its historical average, and up from about 13 just a week earlier. Given all the uncertainty investors are facing, it is surprising that it is trading at such a low level.
There are two ways to address the risks of a portfolio's volatility. The first is to reduce exposure to stocks and longer-term bonds and bonds with significant credit risks while increasing your exposure to shorter-term, relatively safe credit risks. By raising interest rates dramatically, the Fed has made that alternative more attractive than it has been in years. For example, for those concerned about inflation, the yield on 5-year TIPS has increased from about -1.6% at the start of 2021 to about 2.4% on September 28, 2023.
Another way to address the risks is to diversify exposure to risk assets to include other sources of risk that have historically had low to no correlation with the economic cycle risk of stocks and/or the inflation risk of traditional bonds but have also provided risk premiums. The following are alternative assets that may provide diversification benefits. Alternative funds carry their own risks; therefore, investors should consult with their financial advisors about their own circumstances prior to making any adjustments to their portfolio.
- Reinsurance
- The asset class looks attractive, as losses in recent years have led to dramatic increases in premiums, and terms (such as increasing deductibles and tougher underwriting standards) have become more favorable.
- Private middle-market lending (specifically senior, secured, sponsored corporate debt)
- This asset class also looks attractive, as base lending rates have risen sharply, credit spreads have widened, lender terms have been enhanced (upfront fees have gone up), and credit standards have tightened (stronger covenants).
- Consumer credit
- While credit risks have increased, lending rates have risen sharply, credit spreads have widened, and credit standards have tightened.
- Long-short factor funds
- Commodities
- Trend following (time-series momentum)
 As Kevin Grogan and I demonstrated in our book, Reducing the Risk of Black Swans, adding unique risks has historically reduced the downside tail risk associated with conventional stock and bond portfolios.
Postscript: For those interested in the topic, I highly recommend Ray Dalio's The Changing World Order: Why Nations Succeed and Fail.
For informational and educational purposes only and should not be construed as specific investment, accounting, legal, or tax advice. Certain information is based on third party data and may become outdated or otherwise superseded without notice. Third party information is deemed to be reliable, but its accuracy and completeness cannot be guaranteed. Mentions of specific securities should not be deemed as a recommendation. Indices are not available for direct investment. Their performance does not reflect the expenses associated with the management of an actual portfolio nor do indices represent results of actual trading. Information from sources deemed reliable, but its accuracy cannot be guaranteed. Performance is historical and does not guarantee future results. All investments involve risk, including loss of principal. Neither the Securities and Exchange Commission (SEC) nor any other Federal or state agency have approved, determined the accuracy, or confirmed the adequacy of this article. The opinions expressed here are their own and may not accurately reflect those of Buckingham Wealth Partners. LSR-23-560




Leave a Reply