Executive Summary
One way financial advisors can add value for retiring clients is to estimate how much they can spend sustainably during their retirement years without depleting their investment portfolio. Advisors in this position have several options to help them determine a client's initial spending level, from 'static' approaches like the 4% Rule to more dynamic approaches that allow for higher initial withdrawal rates (but introduce the possibility of spending cuts during retirement).
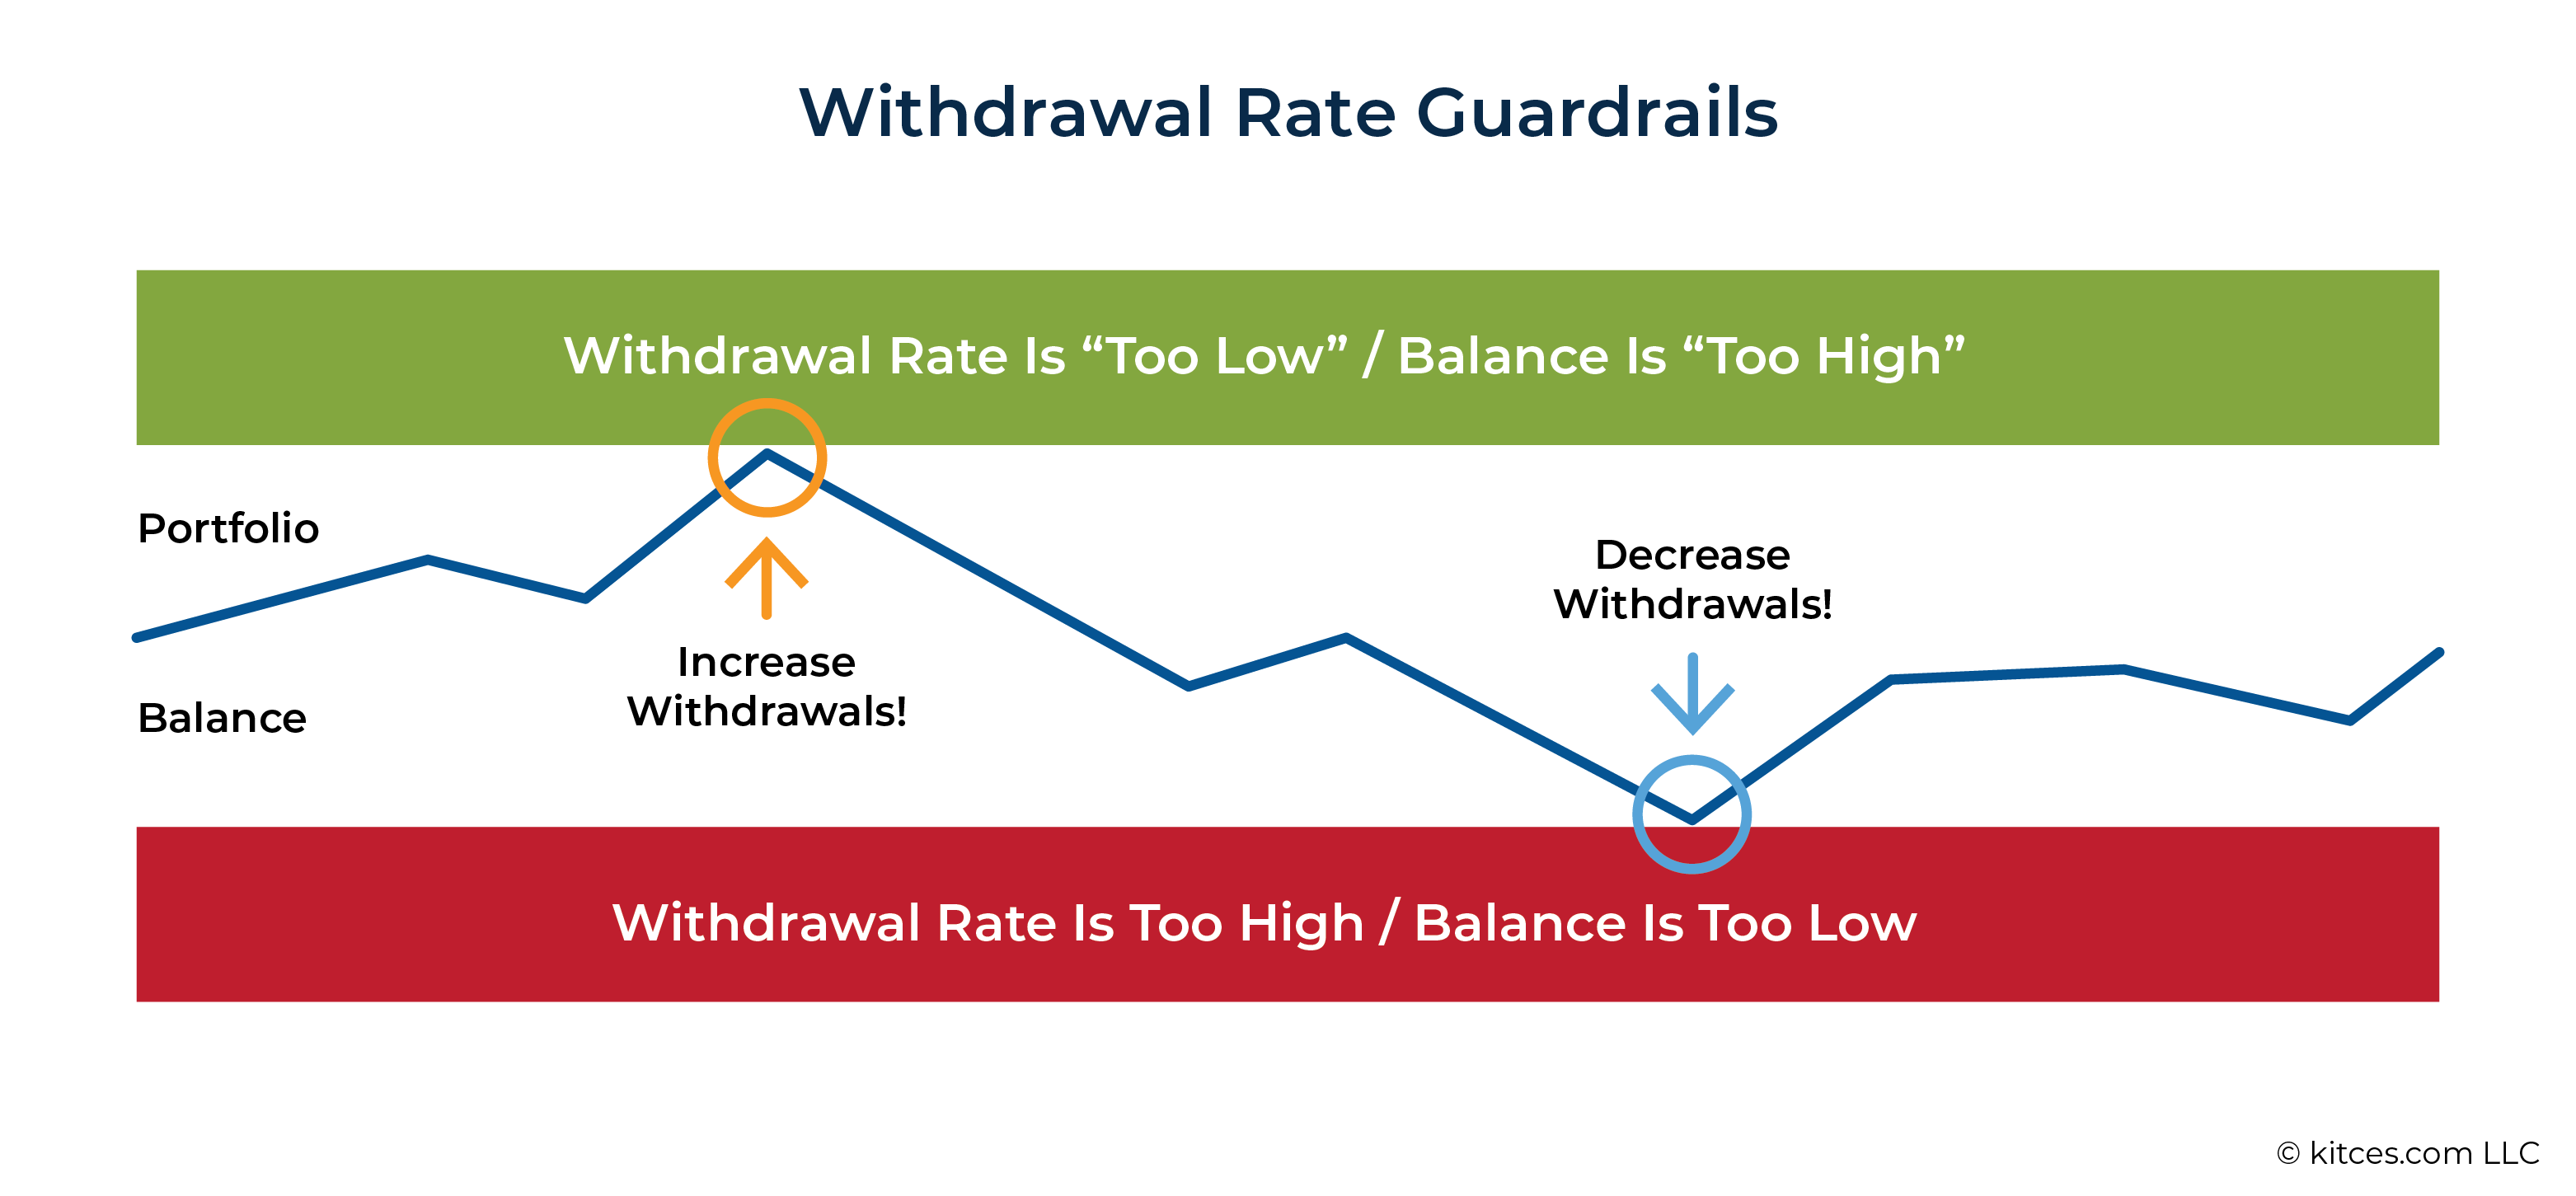
One method introduced by Jonathan Guyton and William Klinger in 2006 is the "guardrails" framework. With this approach, an initial portfolio withdrawal rate is selected and, if market returns are strong (and the withdrawal rate falls 20% lower than the initial rate), dollar withdrawals are increased by 10% (providing more income than would a static withdrawal approach). On the other hand, in a time of weak market returns (that resulted in the withdrawal rate rising 20% higher than the initial rate), dollar withdrawals would be reduced by 10% (to avoid exhausting the portfolio). Compared to static withdrawal strategies, this approach not only provides an explicit plan for adjustments to keep retirees from spending too much or too little, but also gives retired clients an idea of what spending changes they would need to make if a market downturn were to occur.
Nonetheless, Guyton-Klinger guardrails have several serious shortcomings. For instance, this strategy assumes that retirees will target steady withdrawals throughout retirement, whereas portfolio income needs often vary over time (e.g., to cover retirement income needs before claiming Social Security benefits). Perhaps more importantly, this method can result in sharp reductions in retirement income that would be unfeasible for some retirees. Additionally, these income reductions tend to overcorrect for market losses, meaning that far more capital is often preserved than necessary at the cost of severe reductions in the retiree's standard of living.
As an alternative to the Guyton-Klinger guardrails approach, a risk-based guardrails strategy that relies on a financial plan's probability of success, as determined through Monte Carlo simulations, can be used to determine the initial dollar withdrawals and the need for (and magnitude of) upward or downward adjustments. An examination of how a retirement portfolio would have performed using this method reveals that much smaller income reductions would have been required, relative to the classic guardrails system, to prevent exhausting the client's portfolio. For instance, those retiring just before the Global Financial Crisis would have only seen a 3% income reduction from the initial withdrawal rate using risk-based guardrails, compared to 28% for the classic Guyton-Klinger guardrails approach, and those retiring before the Stagflation Era would have experienced a (still painful) 32% reduction, compared to 54% for the original approach!
Ultimately, the key point is that while Guyton-Klinger guardrails have offered a simple yet innovative framework to introduce dynamic spending adjustments during retirement, a future market downturn could leave clients (and potentially their advisors!) surprised at the depth of spending cuts called for by this approach. Instead, implementing a risk-based guardrails system can help mitigate the need for and size of downward spending adjustments while ensuring that a retiree's portfolio supports their lifetime spending needs!
In their 2006 article in the Journal of Financial Planning, Guyton and Klinger developed arguably the most popular "guardrails" framework for retirement income spending to date. Though others have discussed adjustments in retirement before this (and after), Guyton and Klinger's work puts guardrails and spending adjustments on the map as something advisors could actually deliver to their clients. Unlike safe withdrawal rate methodologies that focus primarily on choosing an initial spending level and sticking with it (with adjustments for inflation), "Guyton-Klinger guardrails" gave advisors and retirees a way not just to set a current spending level, but also to plan ahead for spending adjustments.
The popularity of the Guyton-Klinger method is understandable: Its math is easy to execute, and its approach is easy to explain to clients. Unfortunately, however, it suffers from some serious, even fatal flaws. First, as we've argued elsewhere, the method as presented in retirement planning literature doesn't provide any way to deal with fairly common client situations where planned withdrawals are not constant through time because of the timing of non-portfolio income like Social Security benefits. But, perhaps worse, even when tested with plans that do envision 'flat' withdrawal amounts, the method displays very poor performance when tested through historical scenarios.
We'll show below that the Guyton-Klinger framework, if actually followed in real life, produces a much higher risk of dramatic cuts in spending than many advisors realize. If these severe decreases in spending were the only way to avoid the alternative – running out of money in situations when sequences of return are poor – this would be very bad news. Thankfully, there are alternative ways to pursue adjustment-based planning in retirement that produce much better outcomes in the same scenarios. However, these better outcomes will require abandoning the Guyton-Klinger approach.
In other words, while we are grateful that Guyton-Klinger guardrails were a major force in bringing adjustment-based retirement income planning into the mainstream, we argue that a different approach to defining and managing guardrails is needed if we want to deliver good (or even reasonable) income experiences in retirement.
How Guyton-Klinger Guardrails Function
The following 5 parameters make up the core of the Guyton-Klinger guardrail approach to withdrawal adjustments in retirement.
- Initial withdrawal rate: A variety of initial withdrawal rates are possible. For someone in their 60s, this might range from 4%–6%.
- Upper guardrail: If the portfolio withdrawal rate falls 20% lower than the initial rate, increase dollar withdrawals by 10%.
- Lower guardrail: If the portfolio withdrawal rate rises 20% higher than the initial rate, reduce dollar withdrawals by 10%.
- Inflation Adjustments: Adjust withdrawals for inflation. However, if the trailing 12-month return is negative, skip the inflation adjustment.
- Longevity: No lower-guardrail-triggered decreases during the final 15 years of a plan.
The lower guardrail parameter (#3) provides a way to keep a portfolio from being over-burdened by withdrawals and avoids exhausting the portfolio, while the upper guardrail parameter (#2) provides a way to ensure retirees are not overly frugal in their spending, even when they have the resources to spend more.
While withdrawal rates are often expressed in percentages, one of the real strengths of a guardrails framework (whether Guyton-Klinger or any other) is the ability to convert these figures to dollars for a given client's plan. For instance, suppose a retiree has a $1 million portfolio. Using the parameters above, this retiree can easily determine their annual withdrawals, guardrails, and adjustment amounts.
- Initial withdrawal amount: $1 million × 5% (initial withdrawal rate) = $50,000
- Upper guardrail: 5% × (1 – 20%) = 4%; $50,000 ÷ 4% = $1.25 million (portfolio balance that would trigger pay raises)
- Lower guardrail: 5% × (1 + 20%) = 6%; $50,000 ÷ 6% = $833,000 (portfolio balance that would trigger pay cuts)
- Adjustments: $50,000 × 10% = $5,000
-
- Pay raise: $50,000 → $55,000
- Pay cut: $50,000 → $45,000
In comparison to running a Monte Carlo simulation and telling a retiree their probability of success is currently X%, there are some clear communication advantages to a Guyton-Klinger guardrail framework (advantages that Jonathan Guyton notes are important in his own practice). First, it provides an explicit plan for adjustments to keep retirees from spending too much or too little. Second, and perhaps more importantly, it directly addresses one of the biggest fears that many retirees have: What do we need to do during a market downturn?
In contrast to the constant anxiety that a retiree might have while watching their portfolio tick down over time without a guardrails plan – $950,000… $900,000… $850,000… what now?! – a retiree with a guardrails plan knows that their spending reduction comes at $833,000, and they know that this reduction will be $5,000 per year. This clarity helps clients feel that the process of retirement income planning is responsive and that they are in control. Both have positive effects on client risk perception and peace of mind. There is no longer an ambiguous and undefined monster lurking in the future. Clients know what to expect.
Where Guyton-Klinger Comes Up Short
Despite the communication benefits of the Guyton-Klinger approach, it has several serious shortcomings.
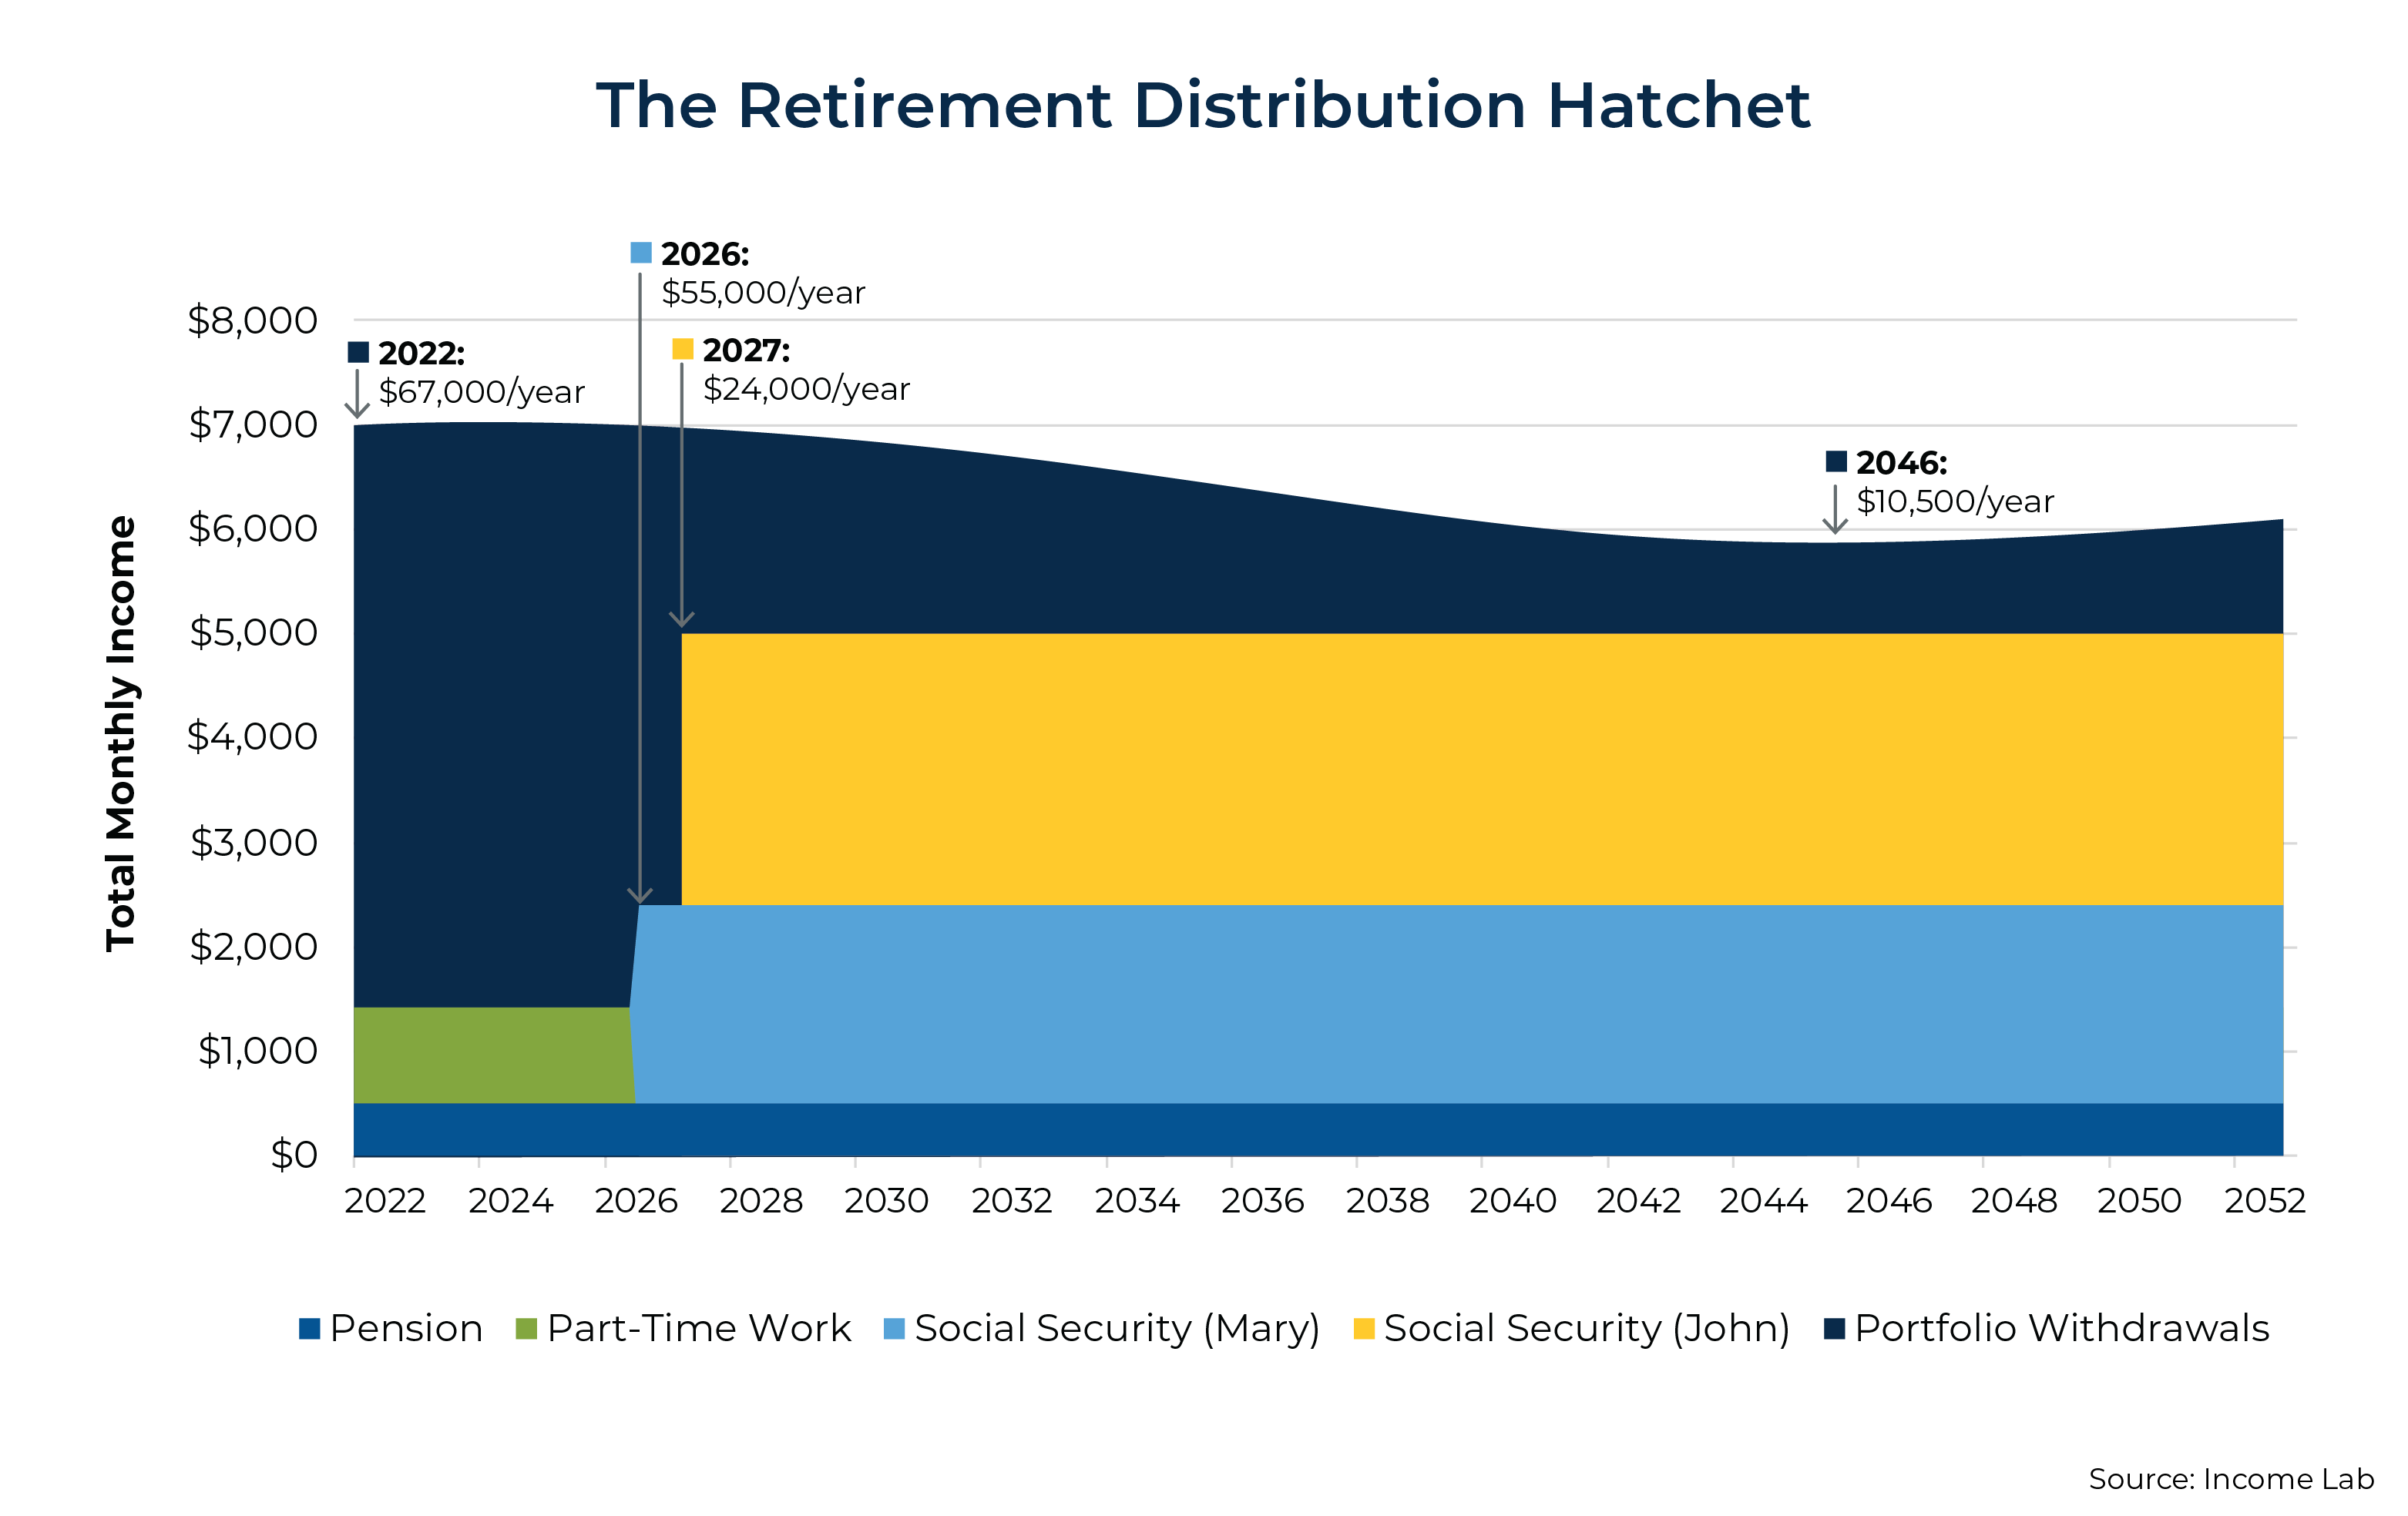
First, the framework assumes that a retiree will target steady withdrawals from their portfolio over their entire plan. But this is often not the case. As we've described before, a more typical retirement distribution pattern could be described as the "Retirement Distribution Hatchet" (illustrated in the next graphic). If a retiree stops working and begins drawing from their portfolio in their early to mid-60s, but delays claiming Social Security for years (perhaps as late as age 70), they would need to pull more heavily from investment portfolios in the earlier years of retirement and then reduce those withdrawals when Social Security and potentially pension income kicks in. This creates the 'blade' of the retirement distribution hatchet. (In his own practice, Guyton addresses this problem by using what he calls "bridge portfolios".)
Furthermore, as famously noted by David Blanchett in his work on the "retirement spending smile," retirees often experience declining spending needs on an inflation-adjusted basis as they age. This forms the arc in the 'handle' of the retirement distribution hatchet shown below.
In this example, assuming an initial portfolio value of $1 million, we see portfolio distributions start out at an apparently heavy 6.7% initial withdrawal rate ($67,000/year), but then drop considerably 5 years later to only $24,000/year once Social Security is fully being claimed by both spouses. Planned withdrawals drop even further to $10,500/year 24 years into the plan when inflation-adjusted spending levels might be bottoming out if following the retirement spending smile. It should be clear that since this plan doesn't include steady portfolio withdrawals, spending adjustments can't be managed using a set of steady withdrawal rate guardrails either.
Unfortunately, however, the problems with the Guyton-Klinger approach run much deeper than its failure to provide a way forward for those who delay Social Security and plan for their spending needs to change with age. Even if a retiree plans to take flat (inflation-adjusted) dollar withdrawals, the framework produces a much higher risk of dramatic cuts in spending than many advisors realize.
Why Retirement Income Risk Matters
When managing retirement income with adjustments – whether using withdrawal rate guardrails or another method – it is important to consider the volatility of income and spending that a client might experience over time. Many retirees are willing to take on some risk of belt-tightening during retirement in exchange for higher current spending. Being so frugal that the chance of having to cut spending is minimized or eliminated would require building a reserve so large that a retiree would likely be leaving a lot on the table at the end of their plan. However, it is still sensible for retirees to be concerned about how frequent and how large cuts might be. Different clients will have different attitudes toward the trade-off between current spending and the risk that spending will have to be scaled back in the future.
Deep Spending Cuts Required By Guyton-Klinger Guardrails During 4 Historical Time Periods
Unfortunately, when tested through tough historical markets, the Guyton-Klinger framework delivers deep spending cuts that many clients would find alarming. We simulated retirees following Guyton-Klinger guardrails going back as far as we can in U.S. history. However, for the purposes of illustration here, we'll focus on 4 key time periods, chosen because they are both iconic and would have put heavy strain on a retirement portfolio: the Global Financial Crisis (beginning retirement in 2007), the Dot-Com Bubble (1999), the Great Depression (1936), and retiring just before (and then through) the Stagflation Era (1965).
We follow the Guyton-Klinger methodology as described above, in each case beginning retirement by withdrawing $43,000/year from a $1 million 60/40 stock/bond portfolio. (This withdrawal level is lower than the 5% withdrawal rate mentioned above, and lower than many of the withdrawal rates used in other work on Guyton-Klinger guardrails. It has a 90% probability of success using historical simulation, so if Guyton-Klinger guardrails perform poorly with this initial withdrawal level, it isn't because we are attempting an overly aggressive withdrawal rate.)
We then step the plan through historical returns and inflation. We apply a 10% spending cut if the withdrawal rate is 20% higher than we started with (i.e., if the withdrawal rate reaches 4.3% × 120% = 5.16%). We increase spending by 10% if the withdrawal rate is 20% lower, down to 4.3% × 80% = 3.44%. We skip inflation adjustments whenever the trailing real return is negative and skip guardrail-triggered decreases when the plan length is less than 15 years.
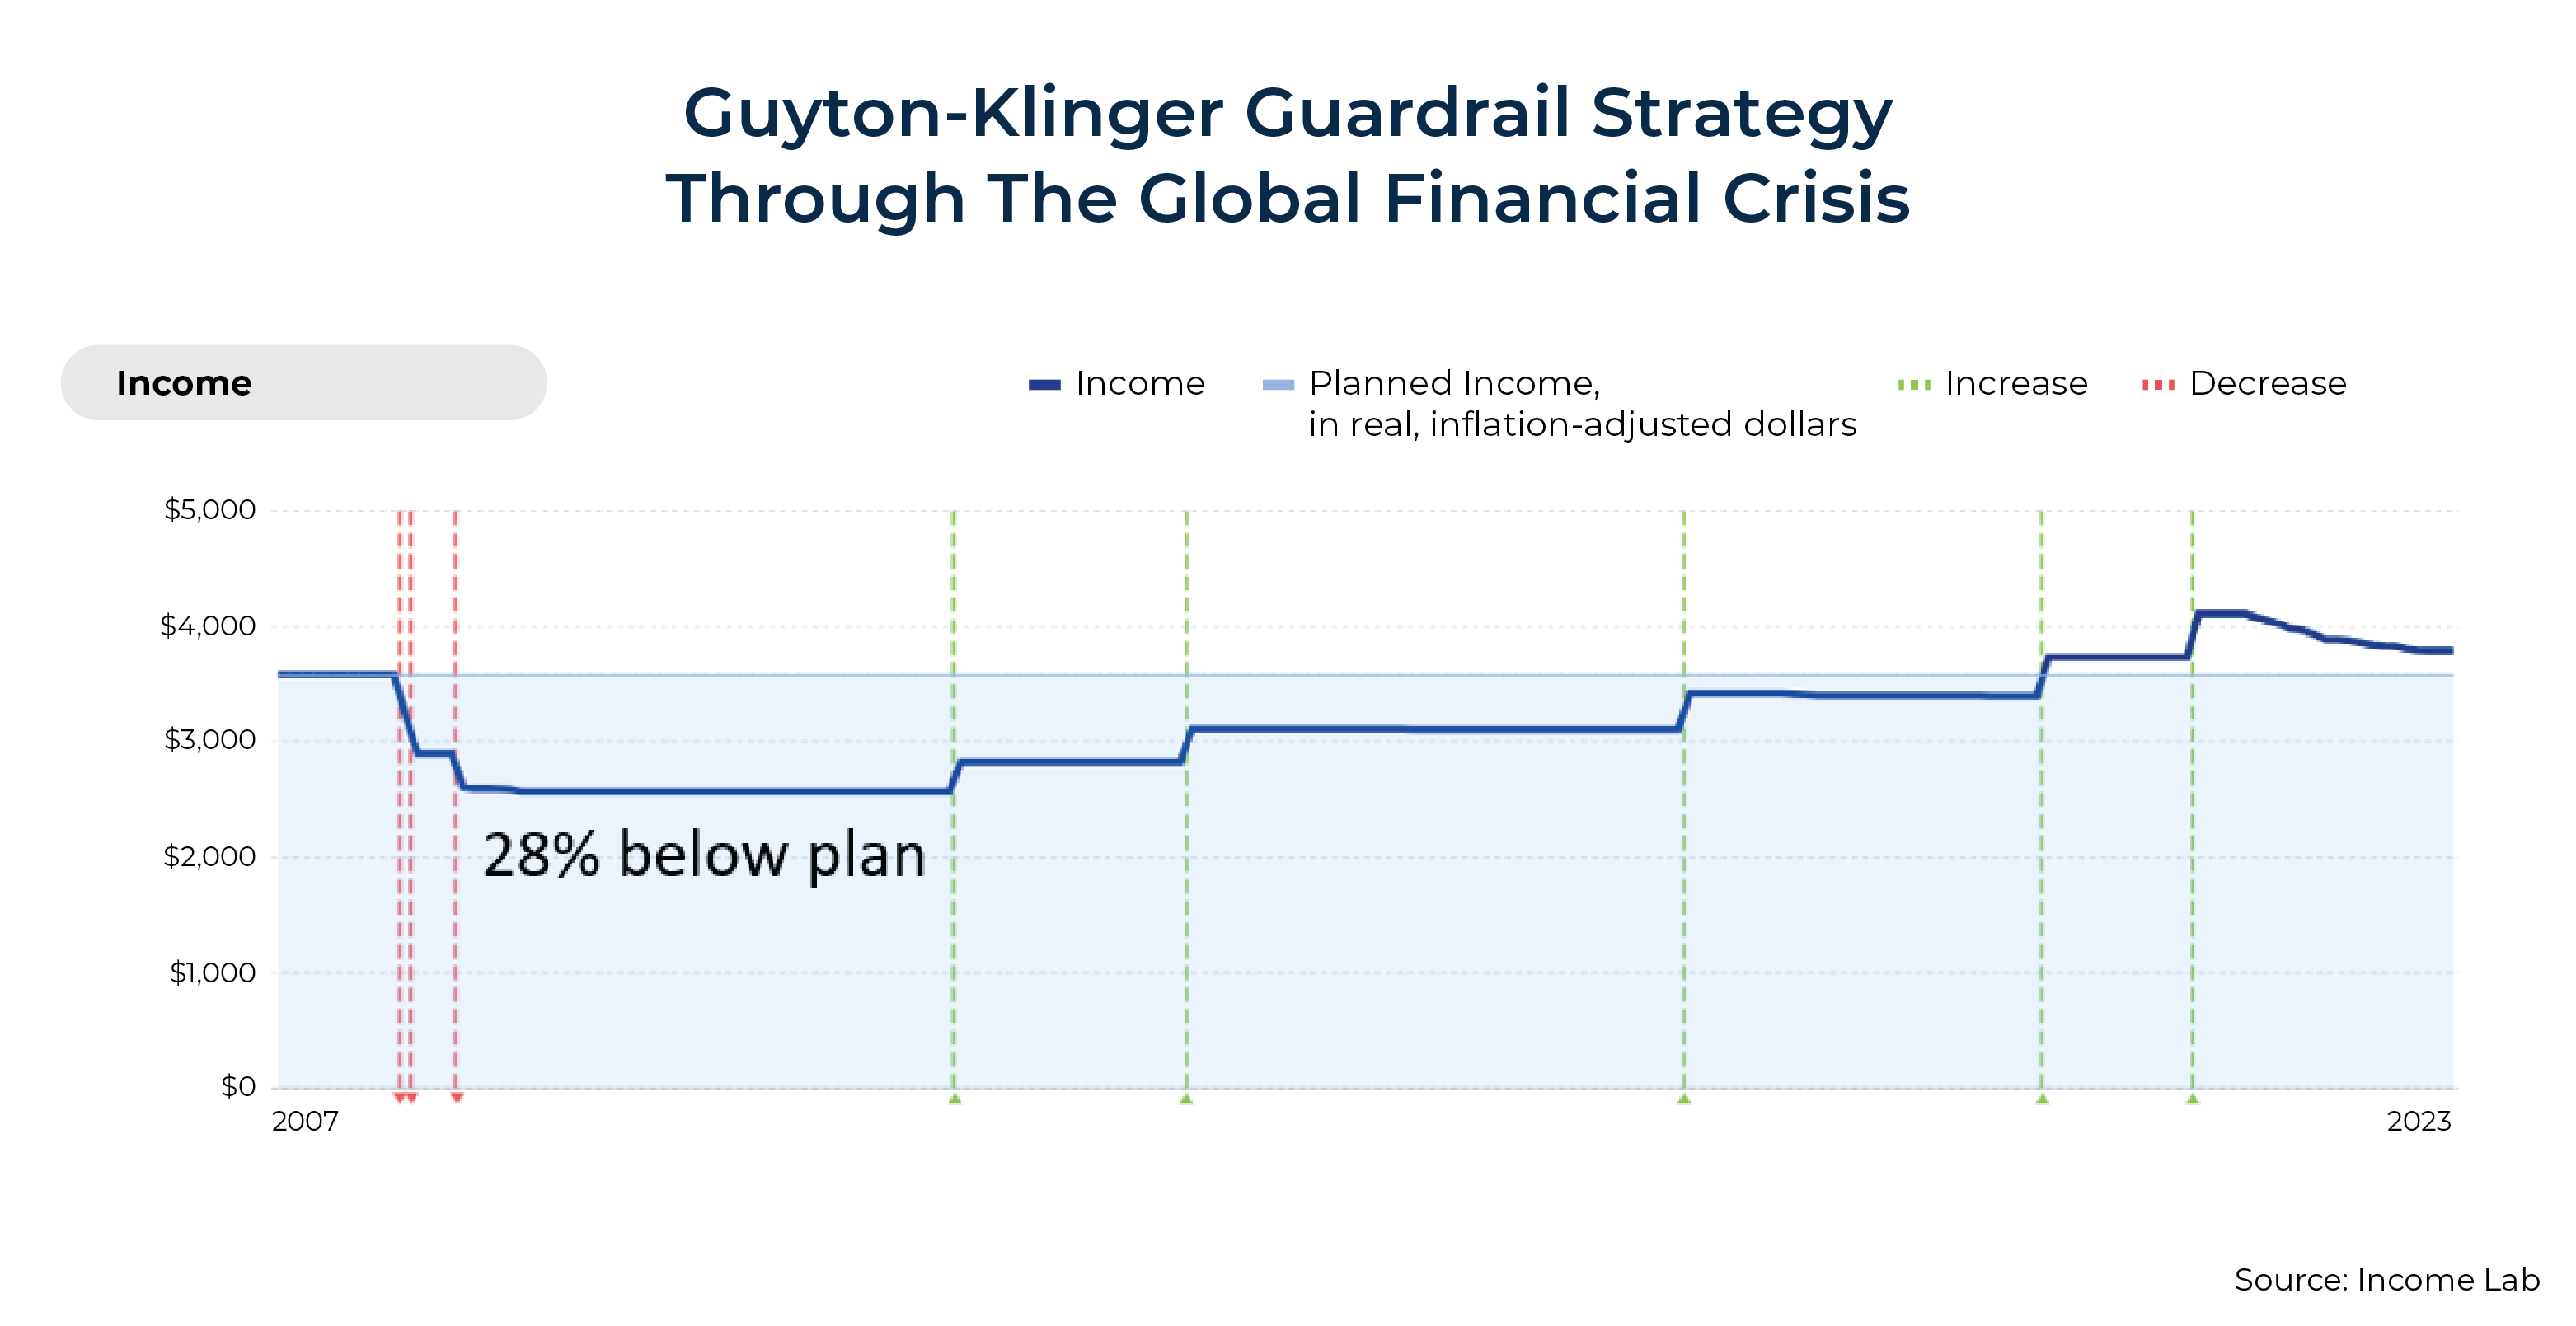
Retirement During The Global Financial Crisis. As shown in the graphic below, Guyton-Klinger guardrails would have called for 3 cuts (marked in red) in rapid succession, dropping inflation-adjusted spending to 28% below the originally planned spending level beginning just before the Global Financial Crisis. While the prolonged bull market after the Global Financial Crisis did provide multiple spending increases (marked in green) after bottoming out, it would have taken over a decade to get back to the initially planned level of inflation-adjusted spending.
Notably, reduced income levels due to skipped inflation adjustments are not marked as decreases in red but are visible as a downward slope in the dark blue income line.
Note that this 'green' period after the worst of the financial crisis is the historical sequence that most advisors who adopted the Guyton-Klinger approach would have lived through. Assuming an advisor adopted Guyton-Klinger after the shock of the Global Financial Crisis, Guyton-Klinger has been very smooth sailing. If this is all an advisor has seen of Guyton-Klinger, why wouldn't they love it?!
Unfortunately, however, this is far from the worst historical simulation.
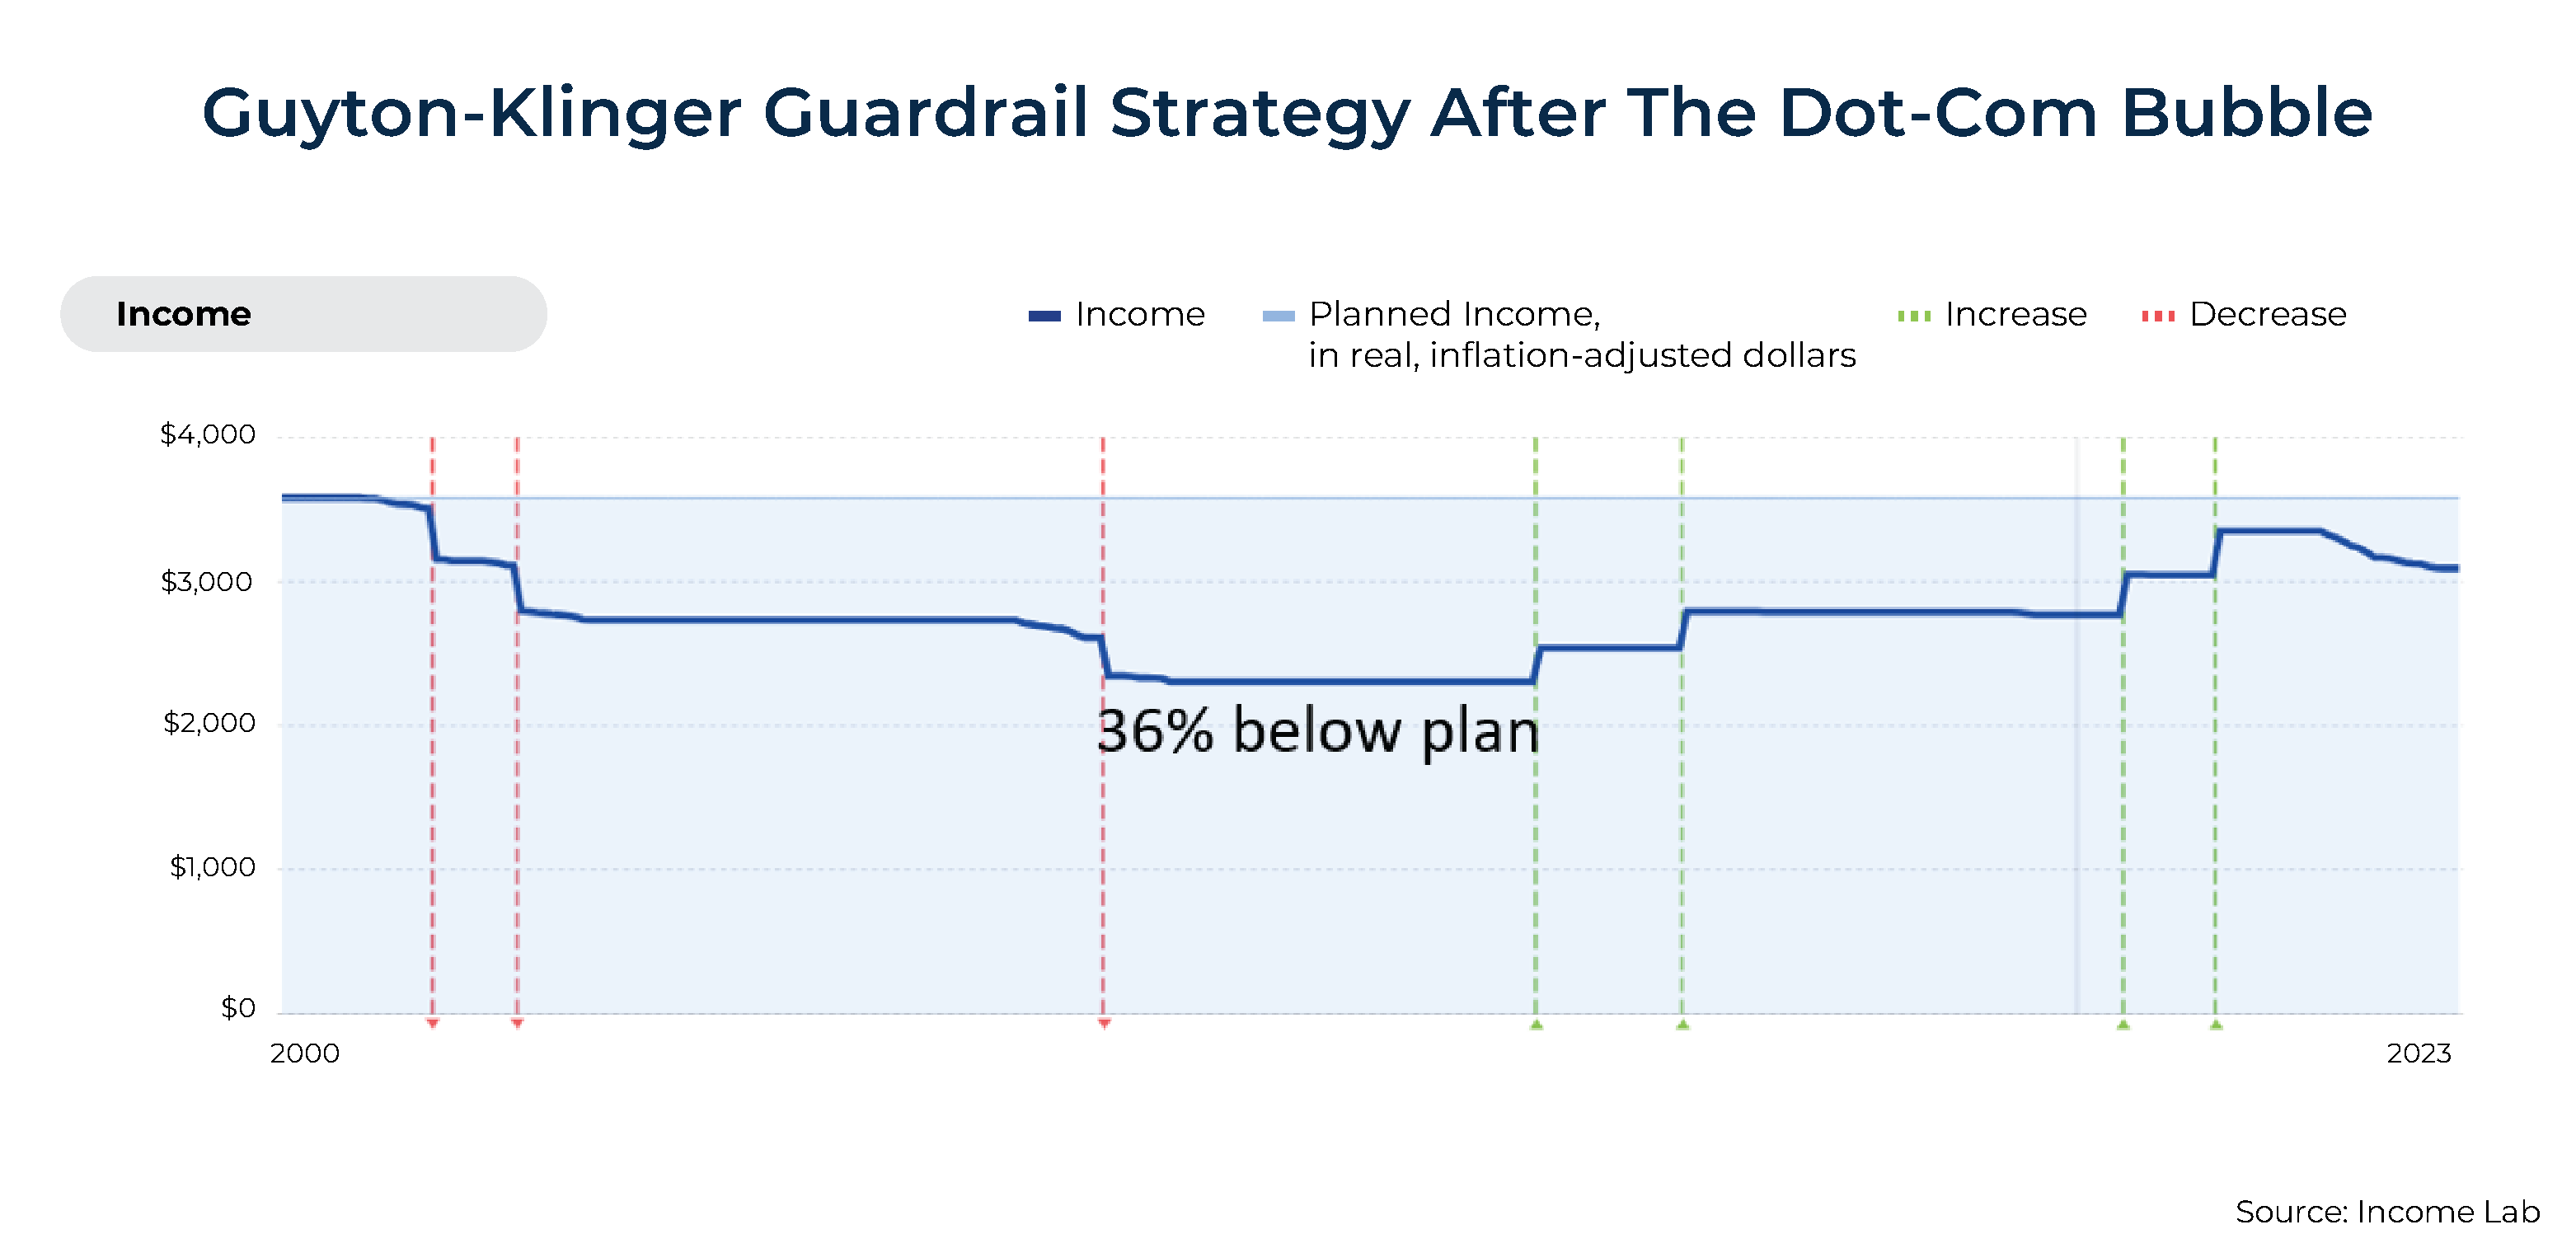
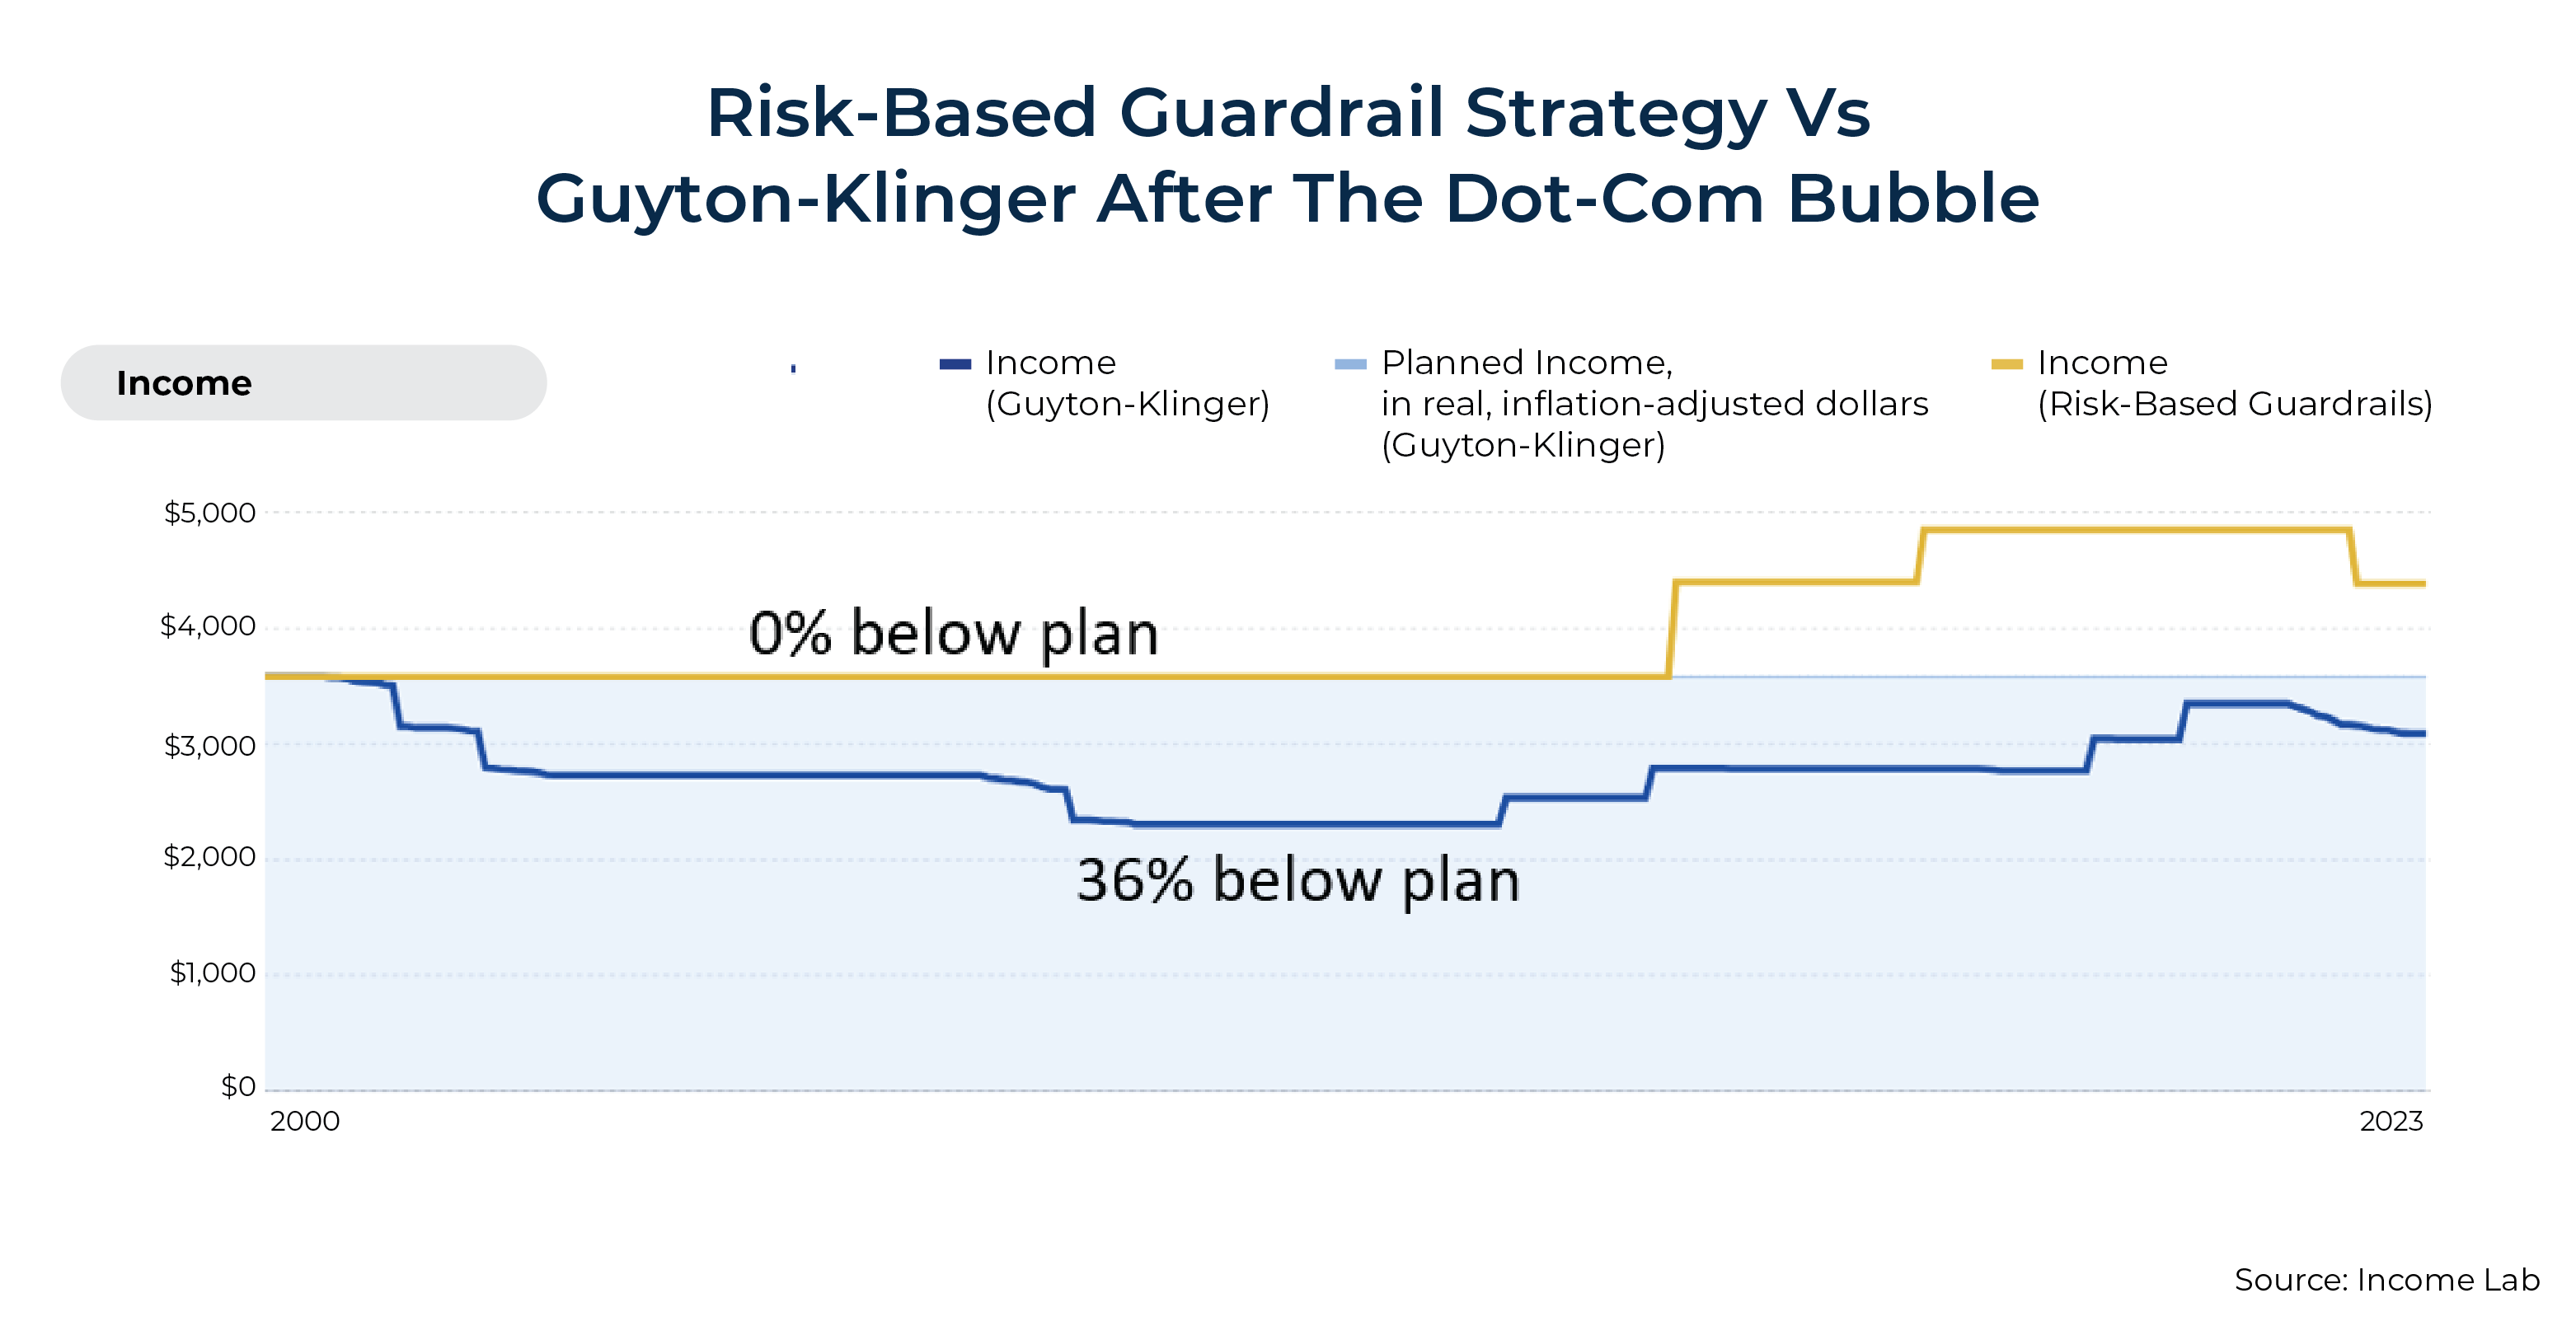
Retirement During The Dot-Com Bubble. A household that retired just before the Dot-Com Bubble burst would have hit its lower guardrail 3 times, ultimately bottoming out at 36% below the planned spending level.
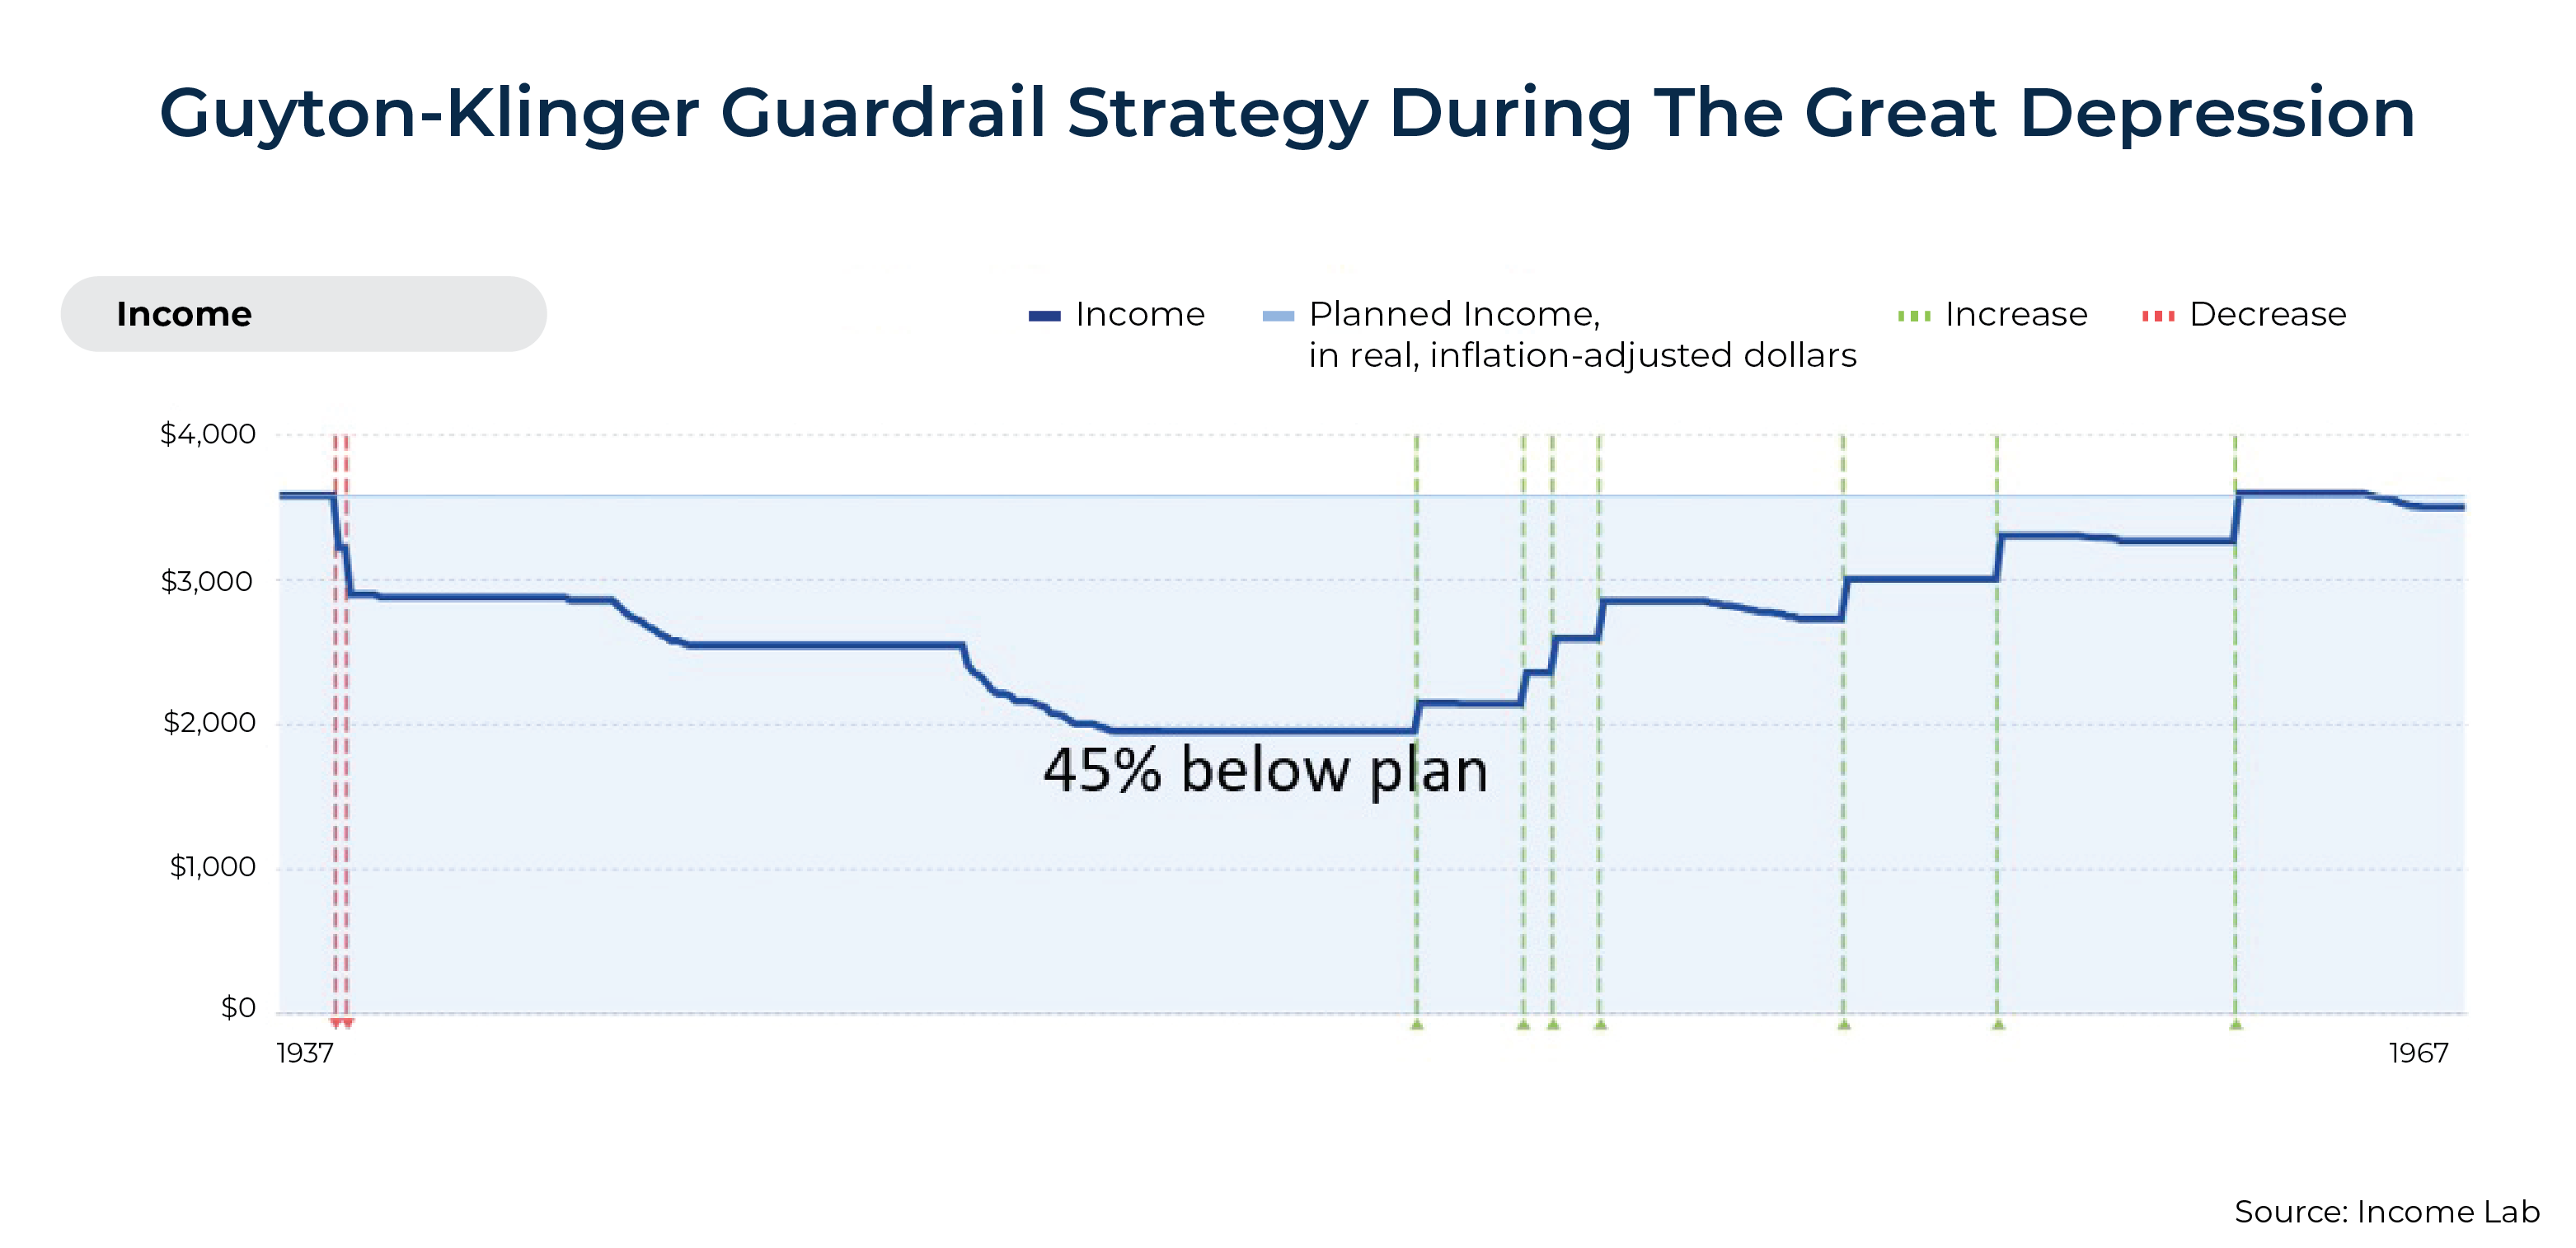
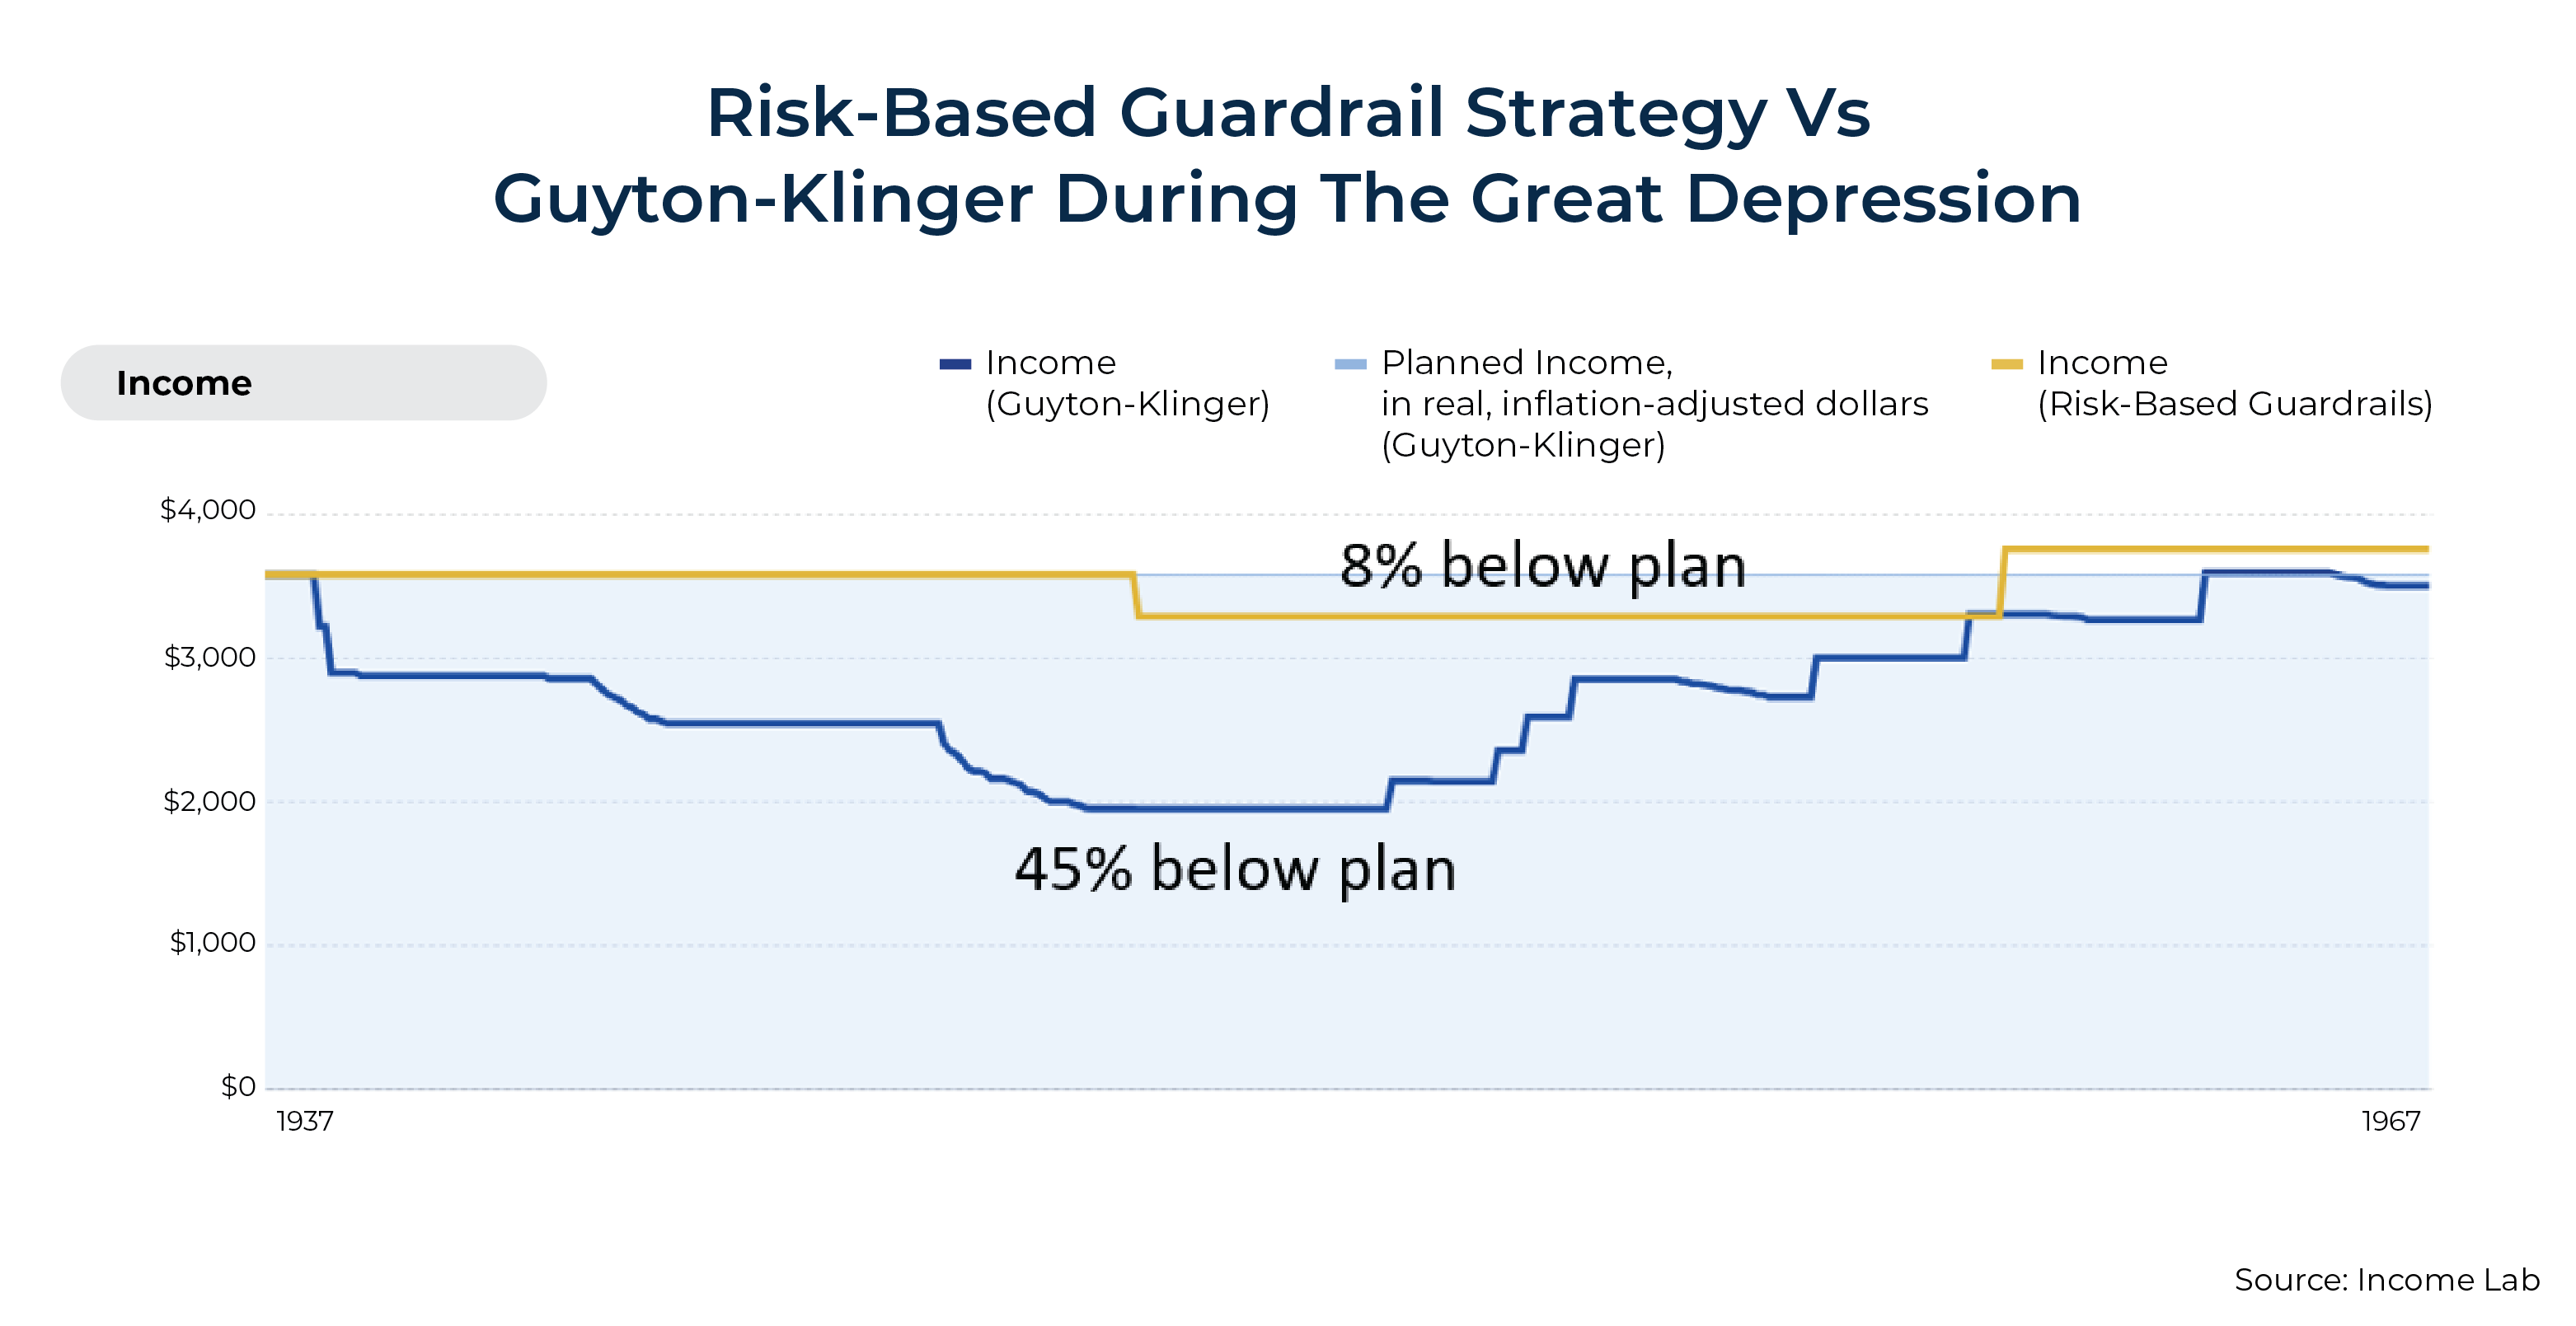
Retirement During The Great Depression. Or suppose our hypothetical household experiences the returns from the middle of the Great Depression (January 1936). In this case, 2 significant cuts and then skipped inflation adjustments (not marked in red as spending decreases in the graph below, but identifiable by the downward-sloping regions in the income line) drove spending down 45% below the initially planned level.
Again, we do see a recovery lifting spending in later years of the plan, but spending during the most active years of retirement is almost cut in half.
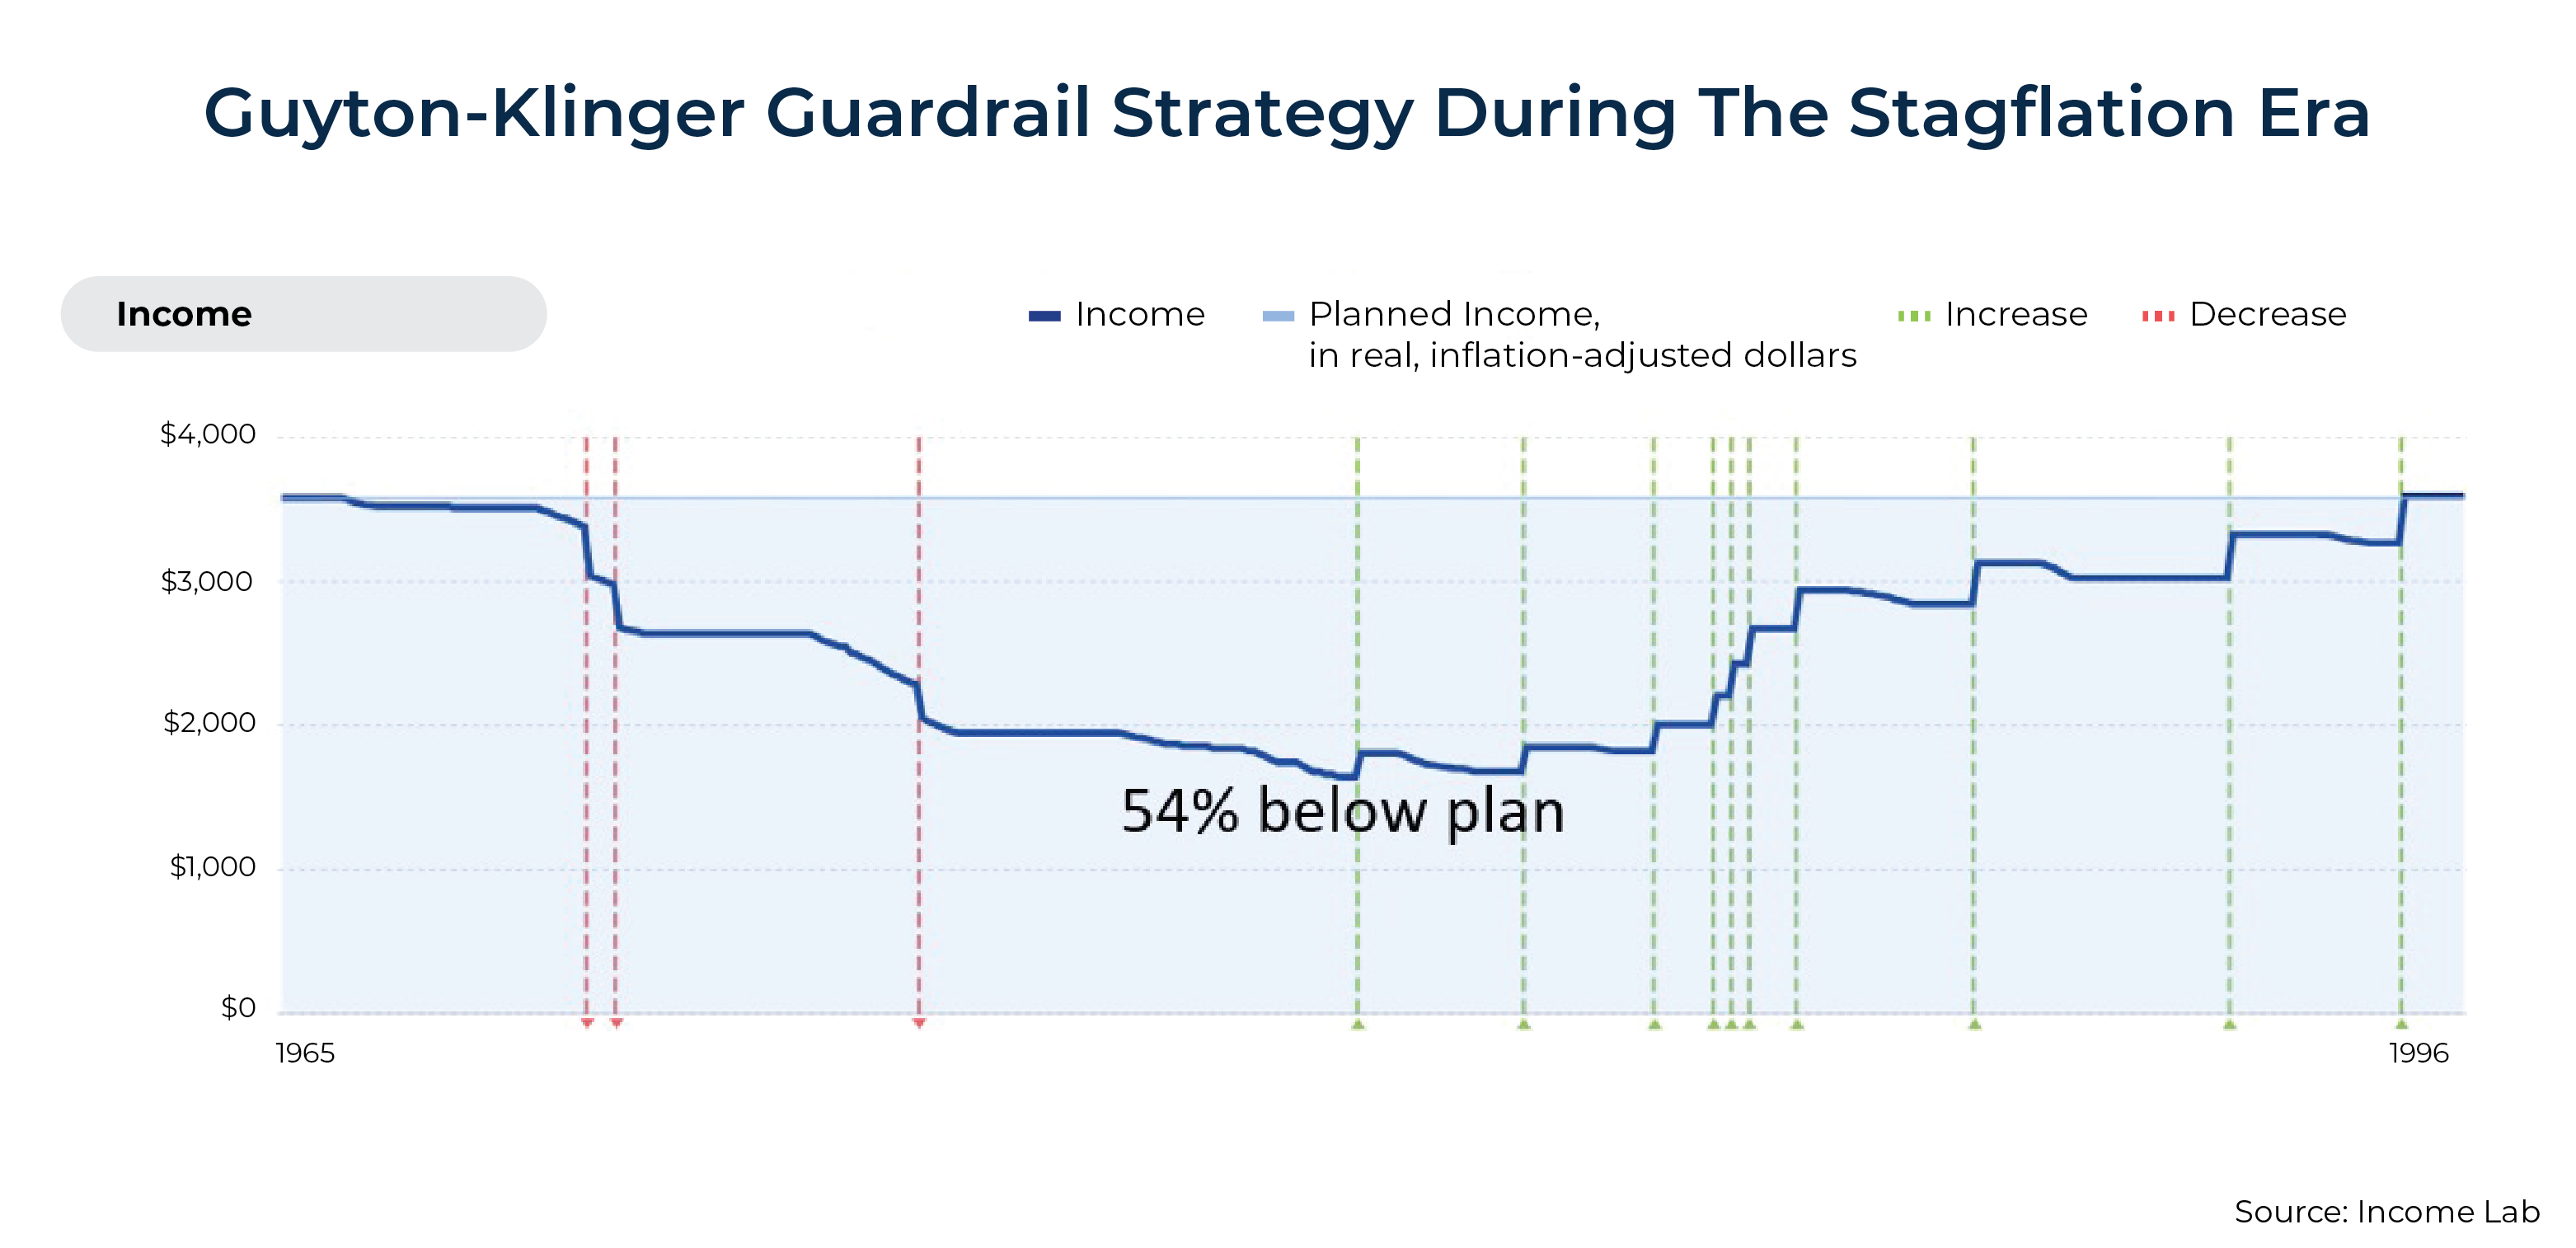
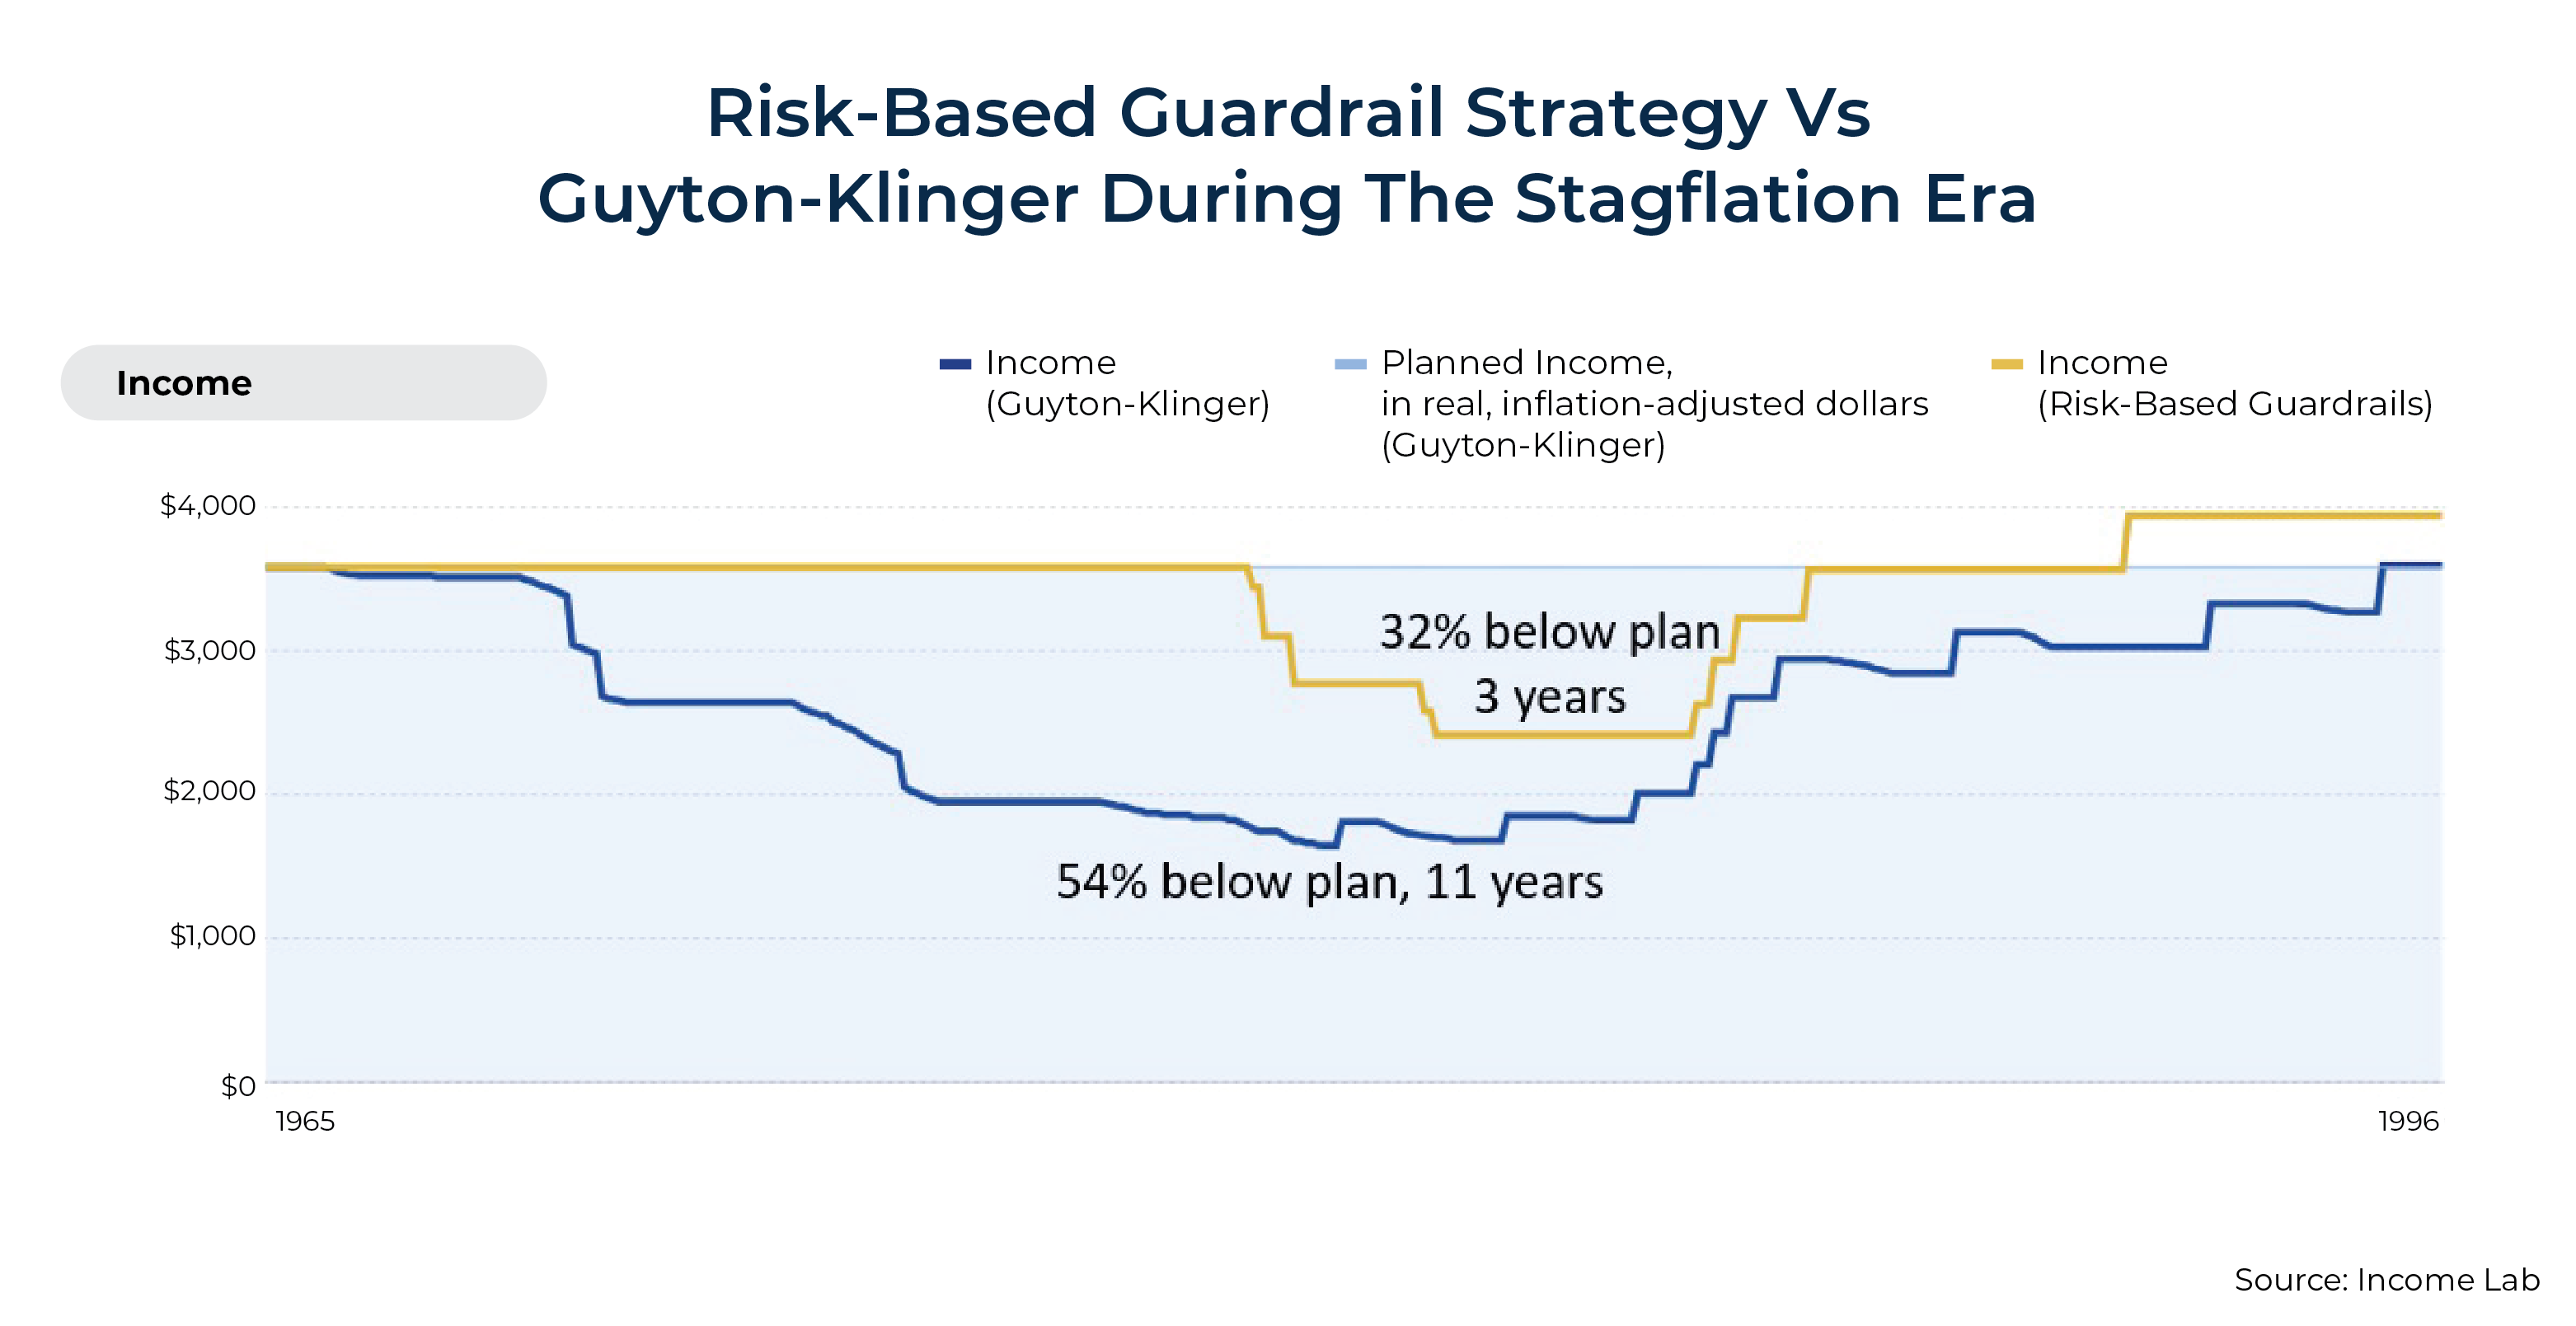
Retirement During The Stagflation Era. Retiring before the Stagflation Era (October 1965) hit this hypothetical household hardest of all, with spending falling to 54% below initially planned spending!
For many retirees, this is simply too much of a hit to their standard of living.
The Evidence Of Extreme Retirement Income Risk Associated With Guyton-Klinger Guardrails
Notably, while the shortcomings of Guyton-Klinger in practice haven't received a lot of industry attention, we aren't the first people to be drawing attention to this problem.
In a series of 2017 blog posts on the EarlyRetirementNow website, founder Karsten Jeske notes results similar to what we report above. His example of a 1966 retiree using Guyton-Klinger guardrails who began retirement with a 4% withdrawal rate ($40,000/year from an initial $1 million portfolio) shows huge reductions in spending starting in year 4 of retirement, bottoming out at $16,400/year in withdrawals – a reduction of 59%!
Jeske also shows that January 2000 retirees, whether they began with 4%, 5%, or 6% withdrawal rates, would all have taken over 50% cumulative pay cuts during retirement.
[With Guyton-Klinger,] You replace the small risk of running out of money with the 4% rule with a moderate risk of large spending cuts throughout many years of your retirement." – Karsten Jeske 2017
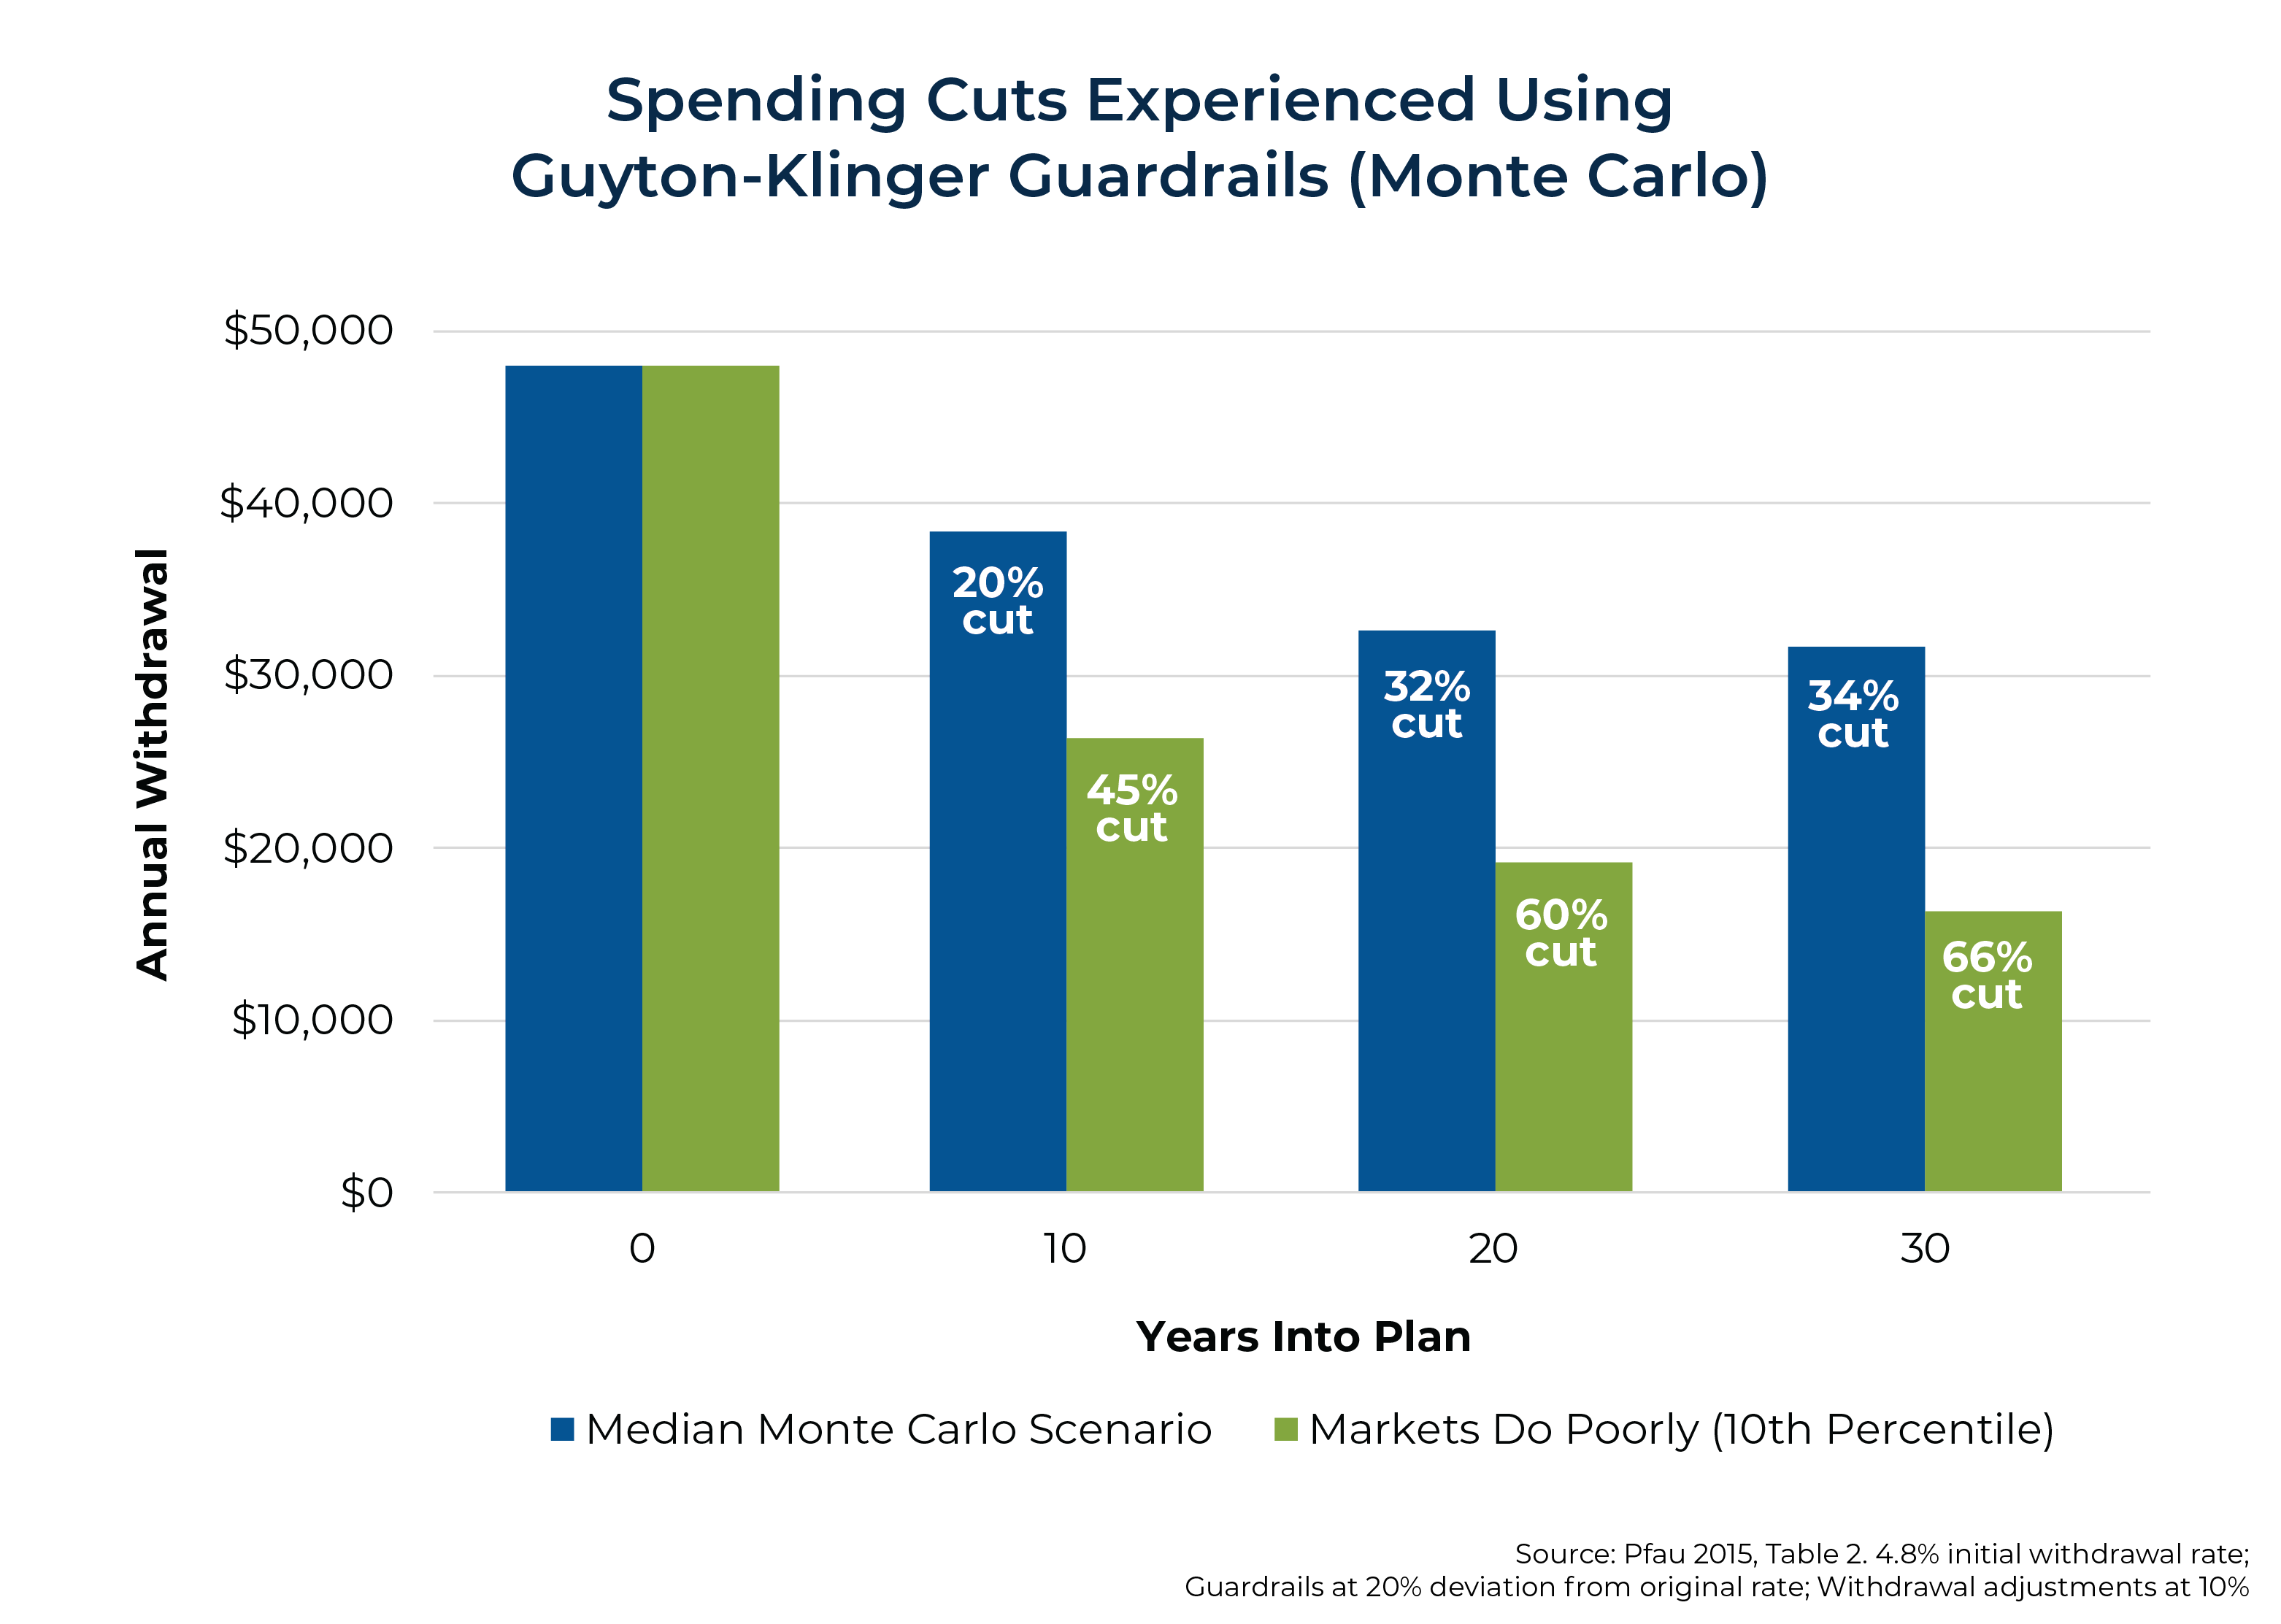
Furthermore, in a 2015 study, Wade Pfau assessed the Guyton-Klinger framework (among many others) via Monte Carlo simulation (in contrast to the historical simulations above) and found similar results: a meaningful chance that those who use Guyton-Klinger guardrails will end up taking substantial pay cuts.
For example, starting with a 4.8% withdrawal rate (higher than in the historical examples above), even the median Monte Carlo scenario (the simulation that gives you a 50% chance things will be better and a 50% chance that things will be worse), the retiree would have a 20% pay cut by year 10, a 32% pay cut by year 20, and be 36% underwater by year 30. Keep in mind that the median scenario is, by definition, the "best guess". So, Pfau's results suggest you should simply expect to take sizable pay cuts when using Guyton-Klinger.
If a retiree is unlucky and faces a set of poor returns, Pfau showed that income could bottom out 66% below the original withdrawal amount. Of course, with higher initial withdrawal amounts, Pfau found even larger pay cuts. A 5.3% initial withdrawal had a 10% chance of a 48% pay cut within 10 years and an 84% pay cut within 30 years!
Whether we're looking at the 54% reduction in real spending in our historical simulation during the Stagflation Era above or the 10% chance of an 84% reduction in spending within Pfau's analysis, it is clear that the retirement income risk of Guyton-Klinger is simply too high for most retirees.
The good news is that since Guyton and Klinger's seminal paper was published in 2006 (following some earlier work by Jonathan Guyton in 2004), the many advisors who adopted Guyton-Klinger or similar distribution-rate-driven guardrails frameworks since then have used it in periods without major and sustained market corrections. Most advisors probably didn't implement Guyton-Klinger for at least several years after the publication of this research, meaning most would have been managing withdrawals in this way only after the 2007–2008 financial crisis. So, it is quite possible that the advisors using Guyton-Klinger have only used it in very good times!
That's the good news. The bad news is that when the Guyton-Klinger method is stress tested through tough periods, it performs very poorly.
Why are these income experiences so poor? The main reason is that the Guyton-Klinger framework triggers withdrawal and spending cuts when they are not needed. It is overly conservative and tends to overcorrect, preserving far more capital than is needed at the cost of severe reductions in the standard of living. (We'll show some examples of this below.) This overcorrection tendency comes from its use of static withdrawal rate guardrails, which can't capture changing risk as a plan changes.
Can We Create Better Guardrails?
Fortunately, we don't need to throw out the guardrails framework that Guyton-Klinger did so much to popularize. By using guardrails defined by risk instead of withdrawal rates, we can capture the benefits of a guardrails framework with much less dramatic income volatility than the Guyton-Klinger framework produces. Not only does this shift from withdrawal rates to risk provide a more holistic approach to spending adjustments that allows us to apply guardrails to unique spending profiles (such as the retirement distribution hatchet discussed above), but it also allows more accuracy in setting the triggers for adjustments, leading to less over-correction and smoother income experiences.
Risk-Based Retirement Income Guardrails
But what are risk-based guardrails? Simply put, we use a methodology that is very similar to the distribution rate guardrails defined above but swap in a metric of risk for distribution rates. Though there are excellent reasons to adopt a language around retirement income risk that rejects success/failure framing, the following set of guardrails uses "probability of success" as a risk measure since this is familiar to many advisors. (Notably, Larry Frank, John Mitchell, and David Blanchett have explored probability of failure as a trigger for adjustment as well.)
Risk-based retirement spending guardrails employ the following parameters to determine withdrawal adjustments in retirement:
- Initial Withdrawal Rate: Begin by spending an amount that has an 80% probability of success.
- Upper Guardrail: If probability of success rises to 100%, increase spending to a level that has 20 points higher risk (80% probability of success).
- Lower Guardrail: If probability of success falls to 25%, decrease spending back to a level that has 20 points lower risk (45% probability of success).
While the upper guardrail above probably seems reasonable, many advisors may find the lower guardrail in this example surprising. Most advisors are comfortable with plans that have a probability of success between 70% and 100%. So why would we let the probability of success get so low before making an adjustment? The answer becomes clearer if we truly make the switch from success/failure framing to risk framing. (Since this is an adjustment plan, we won't be running out of money. We'll be adjusting. So "success" and "failure" aren't really accurate!)
A risk of 50 on a scale of 0 to 100 is simply the point at which the chances that you are overspending are the same as the chances that you are underspending. It's the median. Imagine that you cut spending if the probability of success hits 60%. At that point, it's still more likely than not that you are underspending, so it is hardly reasonable to cut spending. The lower guardrail above allows retirees to wait until they are fairly sure that things are going against them and that they are overspending. It avoids overreactions. While this reasoning helps explain these guardrails, it's also important to note that in a thorough test of possible risk-based guardrail frameworks using machine learning, we found that parameters like those above fared best.
Notably, most advisors probably do have a probability of success threshold at which they would be more likely to suggest spending adjustments to clients. However, many may not be fully aware of what those thresholds are, and most don't use those thresholds to communicate guardrails in dollar terms in advance. Furthermore, managing this sort of adjustment plan across a range of clients and developing stress tests such as those shown here is impossible without specialized software.
Risk-Based Guardrails Vs Guyton-Klinger
To illustrate the ability of risk-based guardrails to better manage retirement income risk, we simulated the risk-based guardrails framework above during the same historical periods used above: the Global Financial Crisis (beginning retirement in 2007), the Dot-Com Bubble (1999), the Great Depression (1936), and just before (and then through) the Stagflation Era (1965).
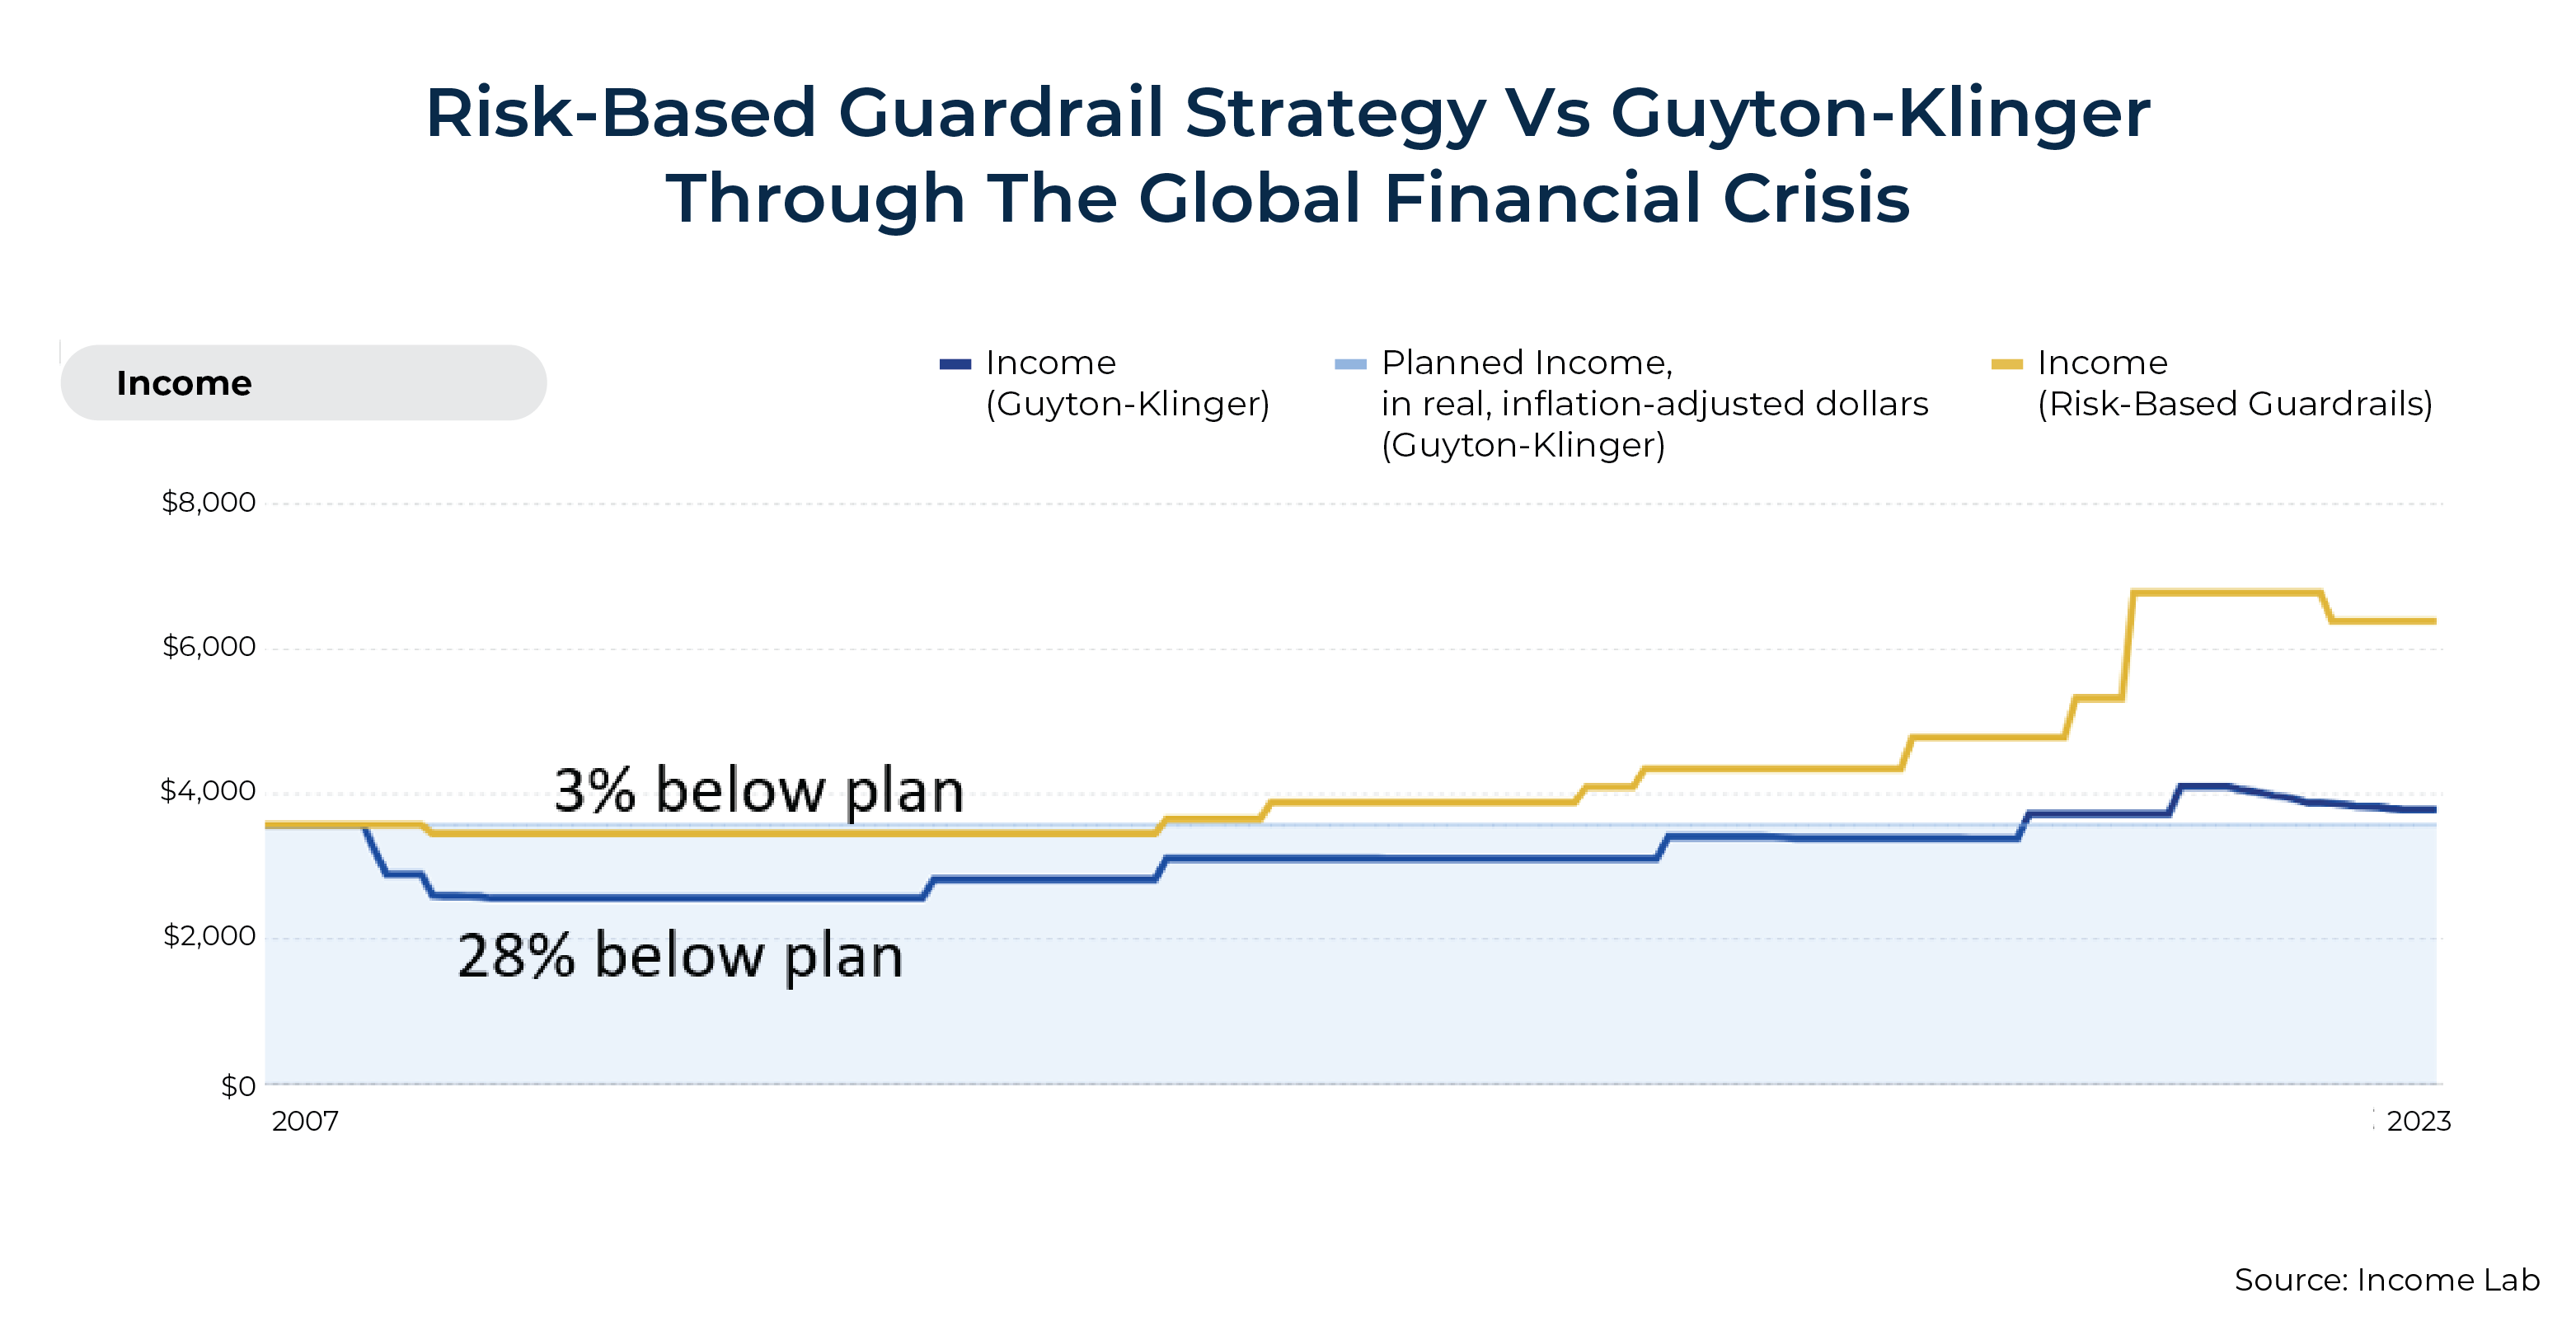
Risk-Based Guardrails Retirement During The Global Financial Crisis. Beginning just before the Global Financial Crisis, instead of a 28% reduction in real spending under Guyton-Klinger, as shown earlier, we see only a 3% reduction in real spending using risk-based guardrails.
Risk-Based Guardrails Retirement During The Dot-Com Bubble. During the Dot-Com Bubble, we see no reduction from the initially planned spending level using risk-based guardrails versus a 36% reduction using Guyton-Klinger.
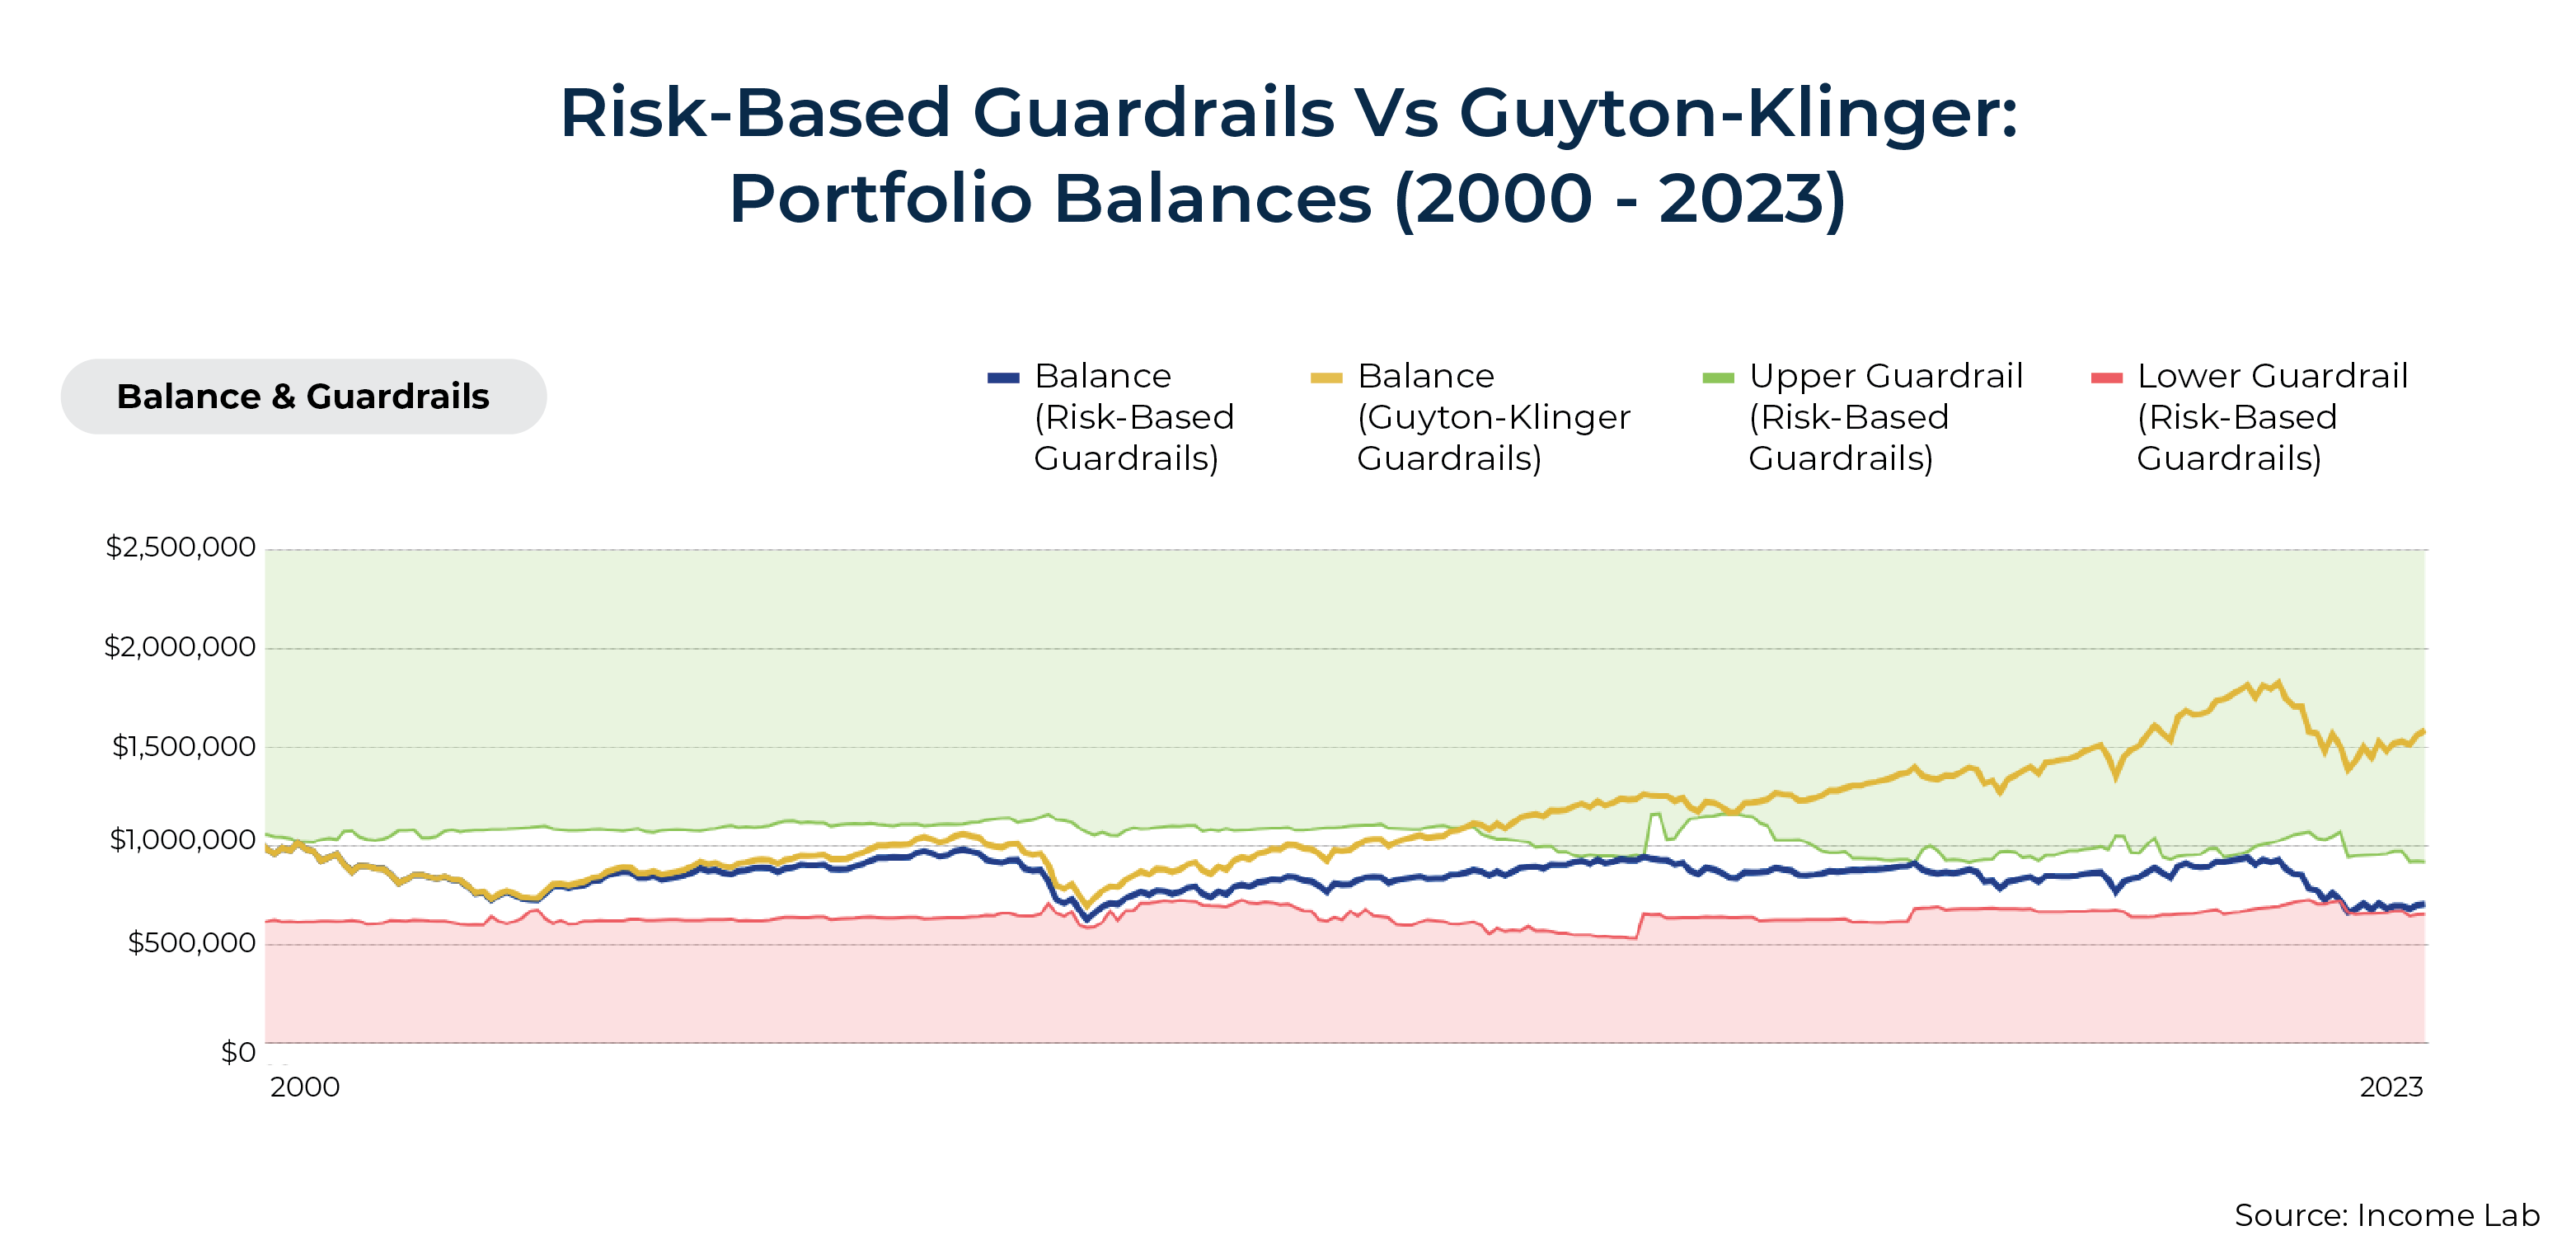
If we compare the portfolio balances for these 2 approaches, we can see how Guyton-Klinger guardrails are overly aggressive in cutting spending. For example, for the Dot-Com bubble, where risk-based guardrails never cut spending, we can see that the portfolio balance is consistently lower from 2002 on compared to the balance seen with Guyton-Klinger guardrails. By 2023, the Guyton-Klinger portfolio, which began at $1 million, still has a $1.59 million balance, while the risk-based portfolio is at $710,000.
This example plan has no legacy goal. However, an additional advantage of risk-based guardrails is that if a client does indeed want to leave behind a portfolio balance for heirs, that goal can be incorporated into the plan and its guardrails.
Risk-Based Guardrails Retirement During The Great Depression. For a retiree retiring during the Great Depression, we see a reduction in real spending of 8% with risk-based guardrails, but this is still far better than the 45% spending hole under Guyton-Klinger.
Risk-Based Guardrails Retirement During The Stagflation Era. And finally, we see a 32% real reduction (for several years) using risk-based guardrails during the Stagflation Era versus a 54% reduction for over a decade under Guyton-Klinger.
Notably, for many retirees, a 32% reduction in real spending may still be too steep and beyond what they would prefer, even if the reduction is expected to last for just a few years. Particularly for retirees without a lot of discretionary income, it simply may not be feasible to make such a drastic cut. (It is, however, worth noting that in more realistic plans that include Social Security and other non-portfolio income sources, as well as the retirement smile, we do not typically see such large cuts in spending during this period.)
However, another advantage of risk-based guardrails is that there is no single set of risk-based guardrails parameters that works for every client. In fact, retirees could review stress tests like those we've looked at here and decide whether the illustrated income experiences through some of the toughest markets in U.S. history would be tolerable. If not, the parameters can simply be adjusted.
One of the primary parameters that is going to drive changes in result is the initial portfolio withdrawal rate. Starting out by spending less is arguably the most effective way to reduce the risk of needing to make future cuts.
There are other parameters that can be adjusted as well. For instance, the thresholds for adjusting spending upward or downward could be modified to reduce the risk of ever needing downward adjustments. In the extreme, a retiree could eschew upward adjustments altogether, allowing instead for good times to build a bigger cushion to guard against bad times.
Furthermore, adding non-portfolio income, especially inflation-adjusted annuities like Social Security, can further reduce risk in a plan and lead to smoother income experiences.
 But, again, the key point is that there is no single set of parameters that works for everyone. Different individuals will have different preferences with respect to the trade-off between current spending and the downside risk to that spending. Perhaps an individual who wants to 'die with zero' and spends 50% or more of their annual spending on discretionary expenses would be entirely comfortable with the risk of a 50% decline in spending. Or perhaps a retiree of very modest means spending 90% of their budget on essential expenses will want to target a strategy with a downside retirement income risk of no more than 10%.
Ultimately, guardrails and adjustments in retirement income planning are as popular as they are today in (large) part because of the simplicity and intuitiveness of Guyton-Klinger guardrails. We think including spending adjustments in retirement planning is a major step forward. However, it is worth acknowledging that there is a lot of retirement income risk inherent to the Guyton-Klinger approach that is often underappreciated. It is understandable that advisors who were likely using Guyton-Klinger guardrails with clients no earlier than 2008 or 2009 may not have experienced some of the tremendous downside risk of the framework, but advisors may want to consider shifting to strategies with more reasonable retirement income risk profiles before the next such period arrives.




Leave a Reply