Executive Summary
The media provides no shortage of articles giving recommendations of how much households should save to afford retirement, from rules of thumb like “save 10% to 15% of your annual income” to more detailed research studies providing "precise" savings guidelines based on age, income level, and targeted retirement income replacement rates. The caveat to all of these tools, though, is that they presume the household has flexible discretionary dollars available to save in the first place.
Yet in reality, most households struggle to save because there is no money left at the end of the month to save in the first place. Because technically their problem isn’t a savings rate that’s too low; it’s a spending rate that’s too high, in one or more categories, that is causing all of the available household income to be consumed before the end of the month is even reached!
And sadly, there is remarkably little guidance available to households about what a prudent spending rate should be in the first place. In some of the largest categories, which tend to be financed with debt – e.g., homes and automobiles – lender guidelines place some restriction on the maximum amount of spending in each of those key categories. With the caveat that lenders don’t lend based on what is prudent for the borrower, but what will result in a permissible level of defaults and losses for the lender. Or stated more simply, borrowing guidelines are based on what the lender believes will extract the maximal amount of interest with an acceptable level of defaults… despite the fact that many of those borrowers will be in over their heads and struggling just to make their repayments!
A somewhat better data set for households to evaluate the prudence of their spending comes from comparing an individual’s spending to the Consumer Expenditure Survey from the Bureau of Labor Statistics, which details what households spend in various categories, segmented by income level (as fixed expenses not surprisingly consume far more of a lower-income household’s budget than those with higher income levels).
Of course, comparing one’s spending by category to average spending rates (by income level) still doesn’t necessarily reveal what is prudent and what a household should spend, especially when recognizing that the national savings rate is already a dismally low 3.2% (which means comparing to CES data in the end simply compares to a national set of households that already are spending “too much” and not saving enough!).
Nonetheless, focusing on spending rates at least puts the focus back on what households can control – what they spend, and what they earn – rather than focusing on or criticizing a savings rate that ultimately is more a result of other decisions than a decision unto itself. And also helps to recognize that, for most middle-income households where spending is challenging, it is actually far better to focus on housing and transportation costs than trying to trim vacations, clothing, lattes and avocado toast from the budget.
But the question still remains: what is a prudent spending rate for typical household expenses, and how do you figure out what is or is not an appropriate amount to spend in the first place (that “lives within your means” and leaves an available dollar amount of savings left over)?
Recommended Savings Guidelines For Retirement
The fundamental principle of retirement, or financial independence more generally, is that you save and save (and invest/grow your savings) to the point that eventually you have enough money saved to pay all your bills and no longer need to work for income.
Of course, how much you need to save depends on the size of your bills – or more generally, what kind of lifestyle you’re trying to fund in retirement – but since most people tend to maintain a relatively stable lifestyle and spend in retirement at least similar to what they did in their working years (minus some employment and commuting expenses but plus some travel and leisure expenses), retirement savings advice is often boiled down to replacing a percentage of your pre-retirement income by saving a percentage of that income on an ongoing basis.
The classic rule of thumb is to try and save about 10% to 15% of your income. Although in reality, that savings threshold is predicated on starting relatively young and having a long time horizon for that savings to be invested and compound. Those who don’t begin saving until later may have to save an even higher percentage. And higher-income individuals – for whom Social Security replaces a smaller percentage of income – may have to save even more, in order to fully replace their income level in retirement.
Thus, publications like the Journal of Financial Planning have featured even more detailed “National Savings Rate Guidelines” that vary the target savings rate as a percentage of income based on the individual’s age and time horizon, their income level, and the percentage of their income that they wish to replace as spending in retirement (recognizing that because pre-retirement wages are fully taxed, and a portion of that income is itself going to savings, even continuing 100% of your pre-retirement spending may only require 60% to 80% of your pre-retirement income as a replacement rate).
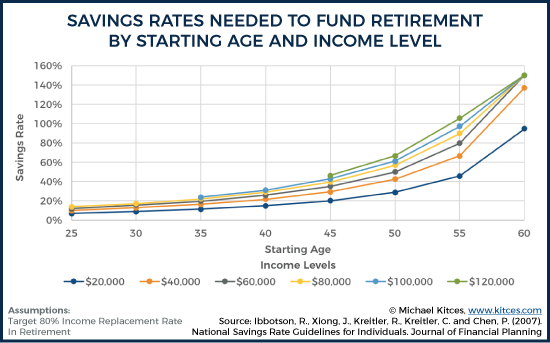
Unfortunately, though, national data shows that the national savings rate is much, much lower than the recommended guidelines (currently hovering just above 3%), which affirms the wide range of other studies suggesting that huge swaths of Americans aren’t saving enough to be prepared for retirement.
In other words, despite pushing out the information of the importance of saving 10% to 15% of income, in practice, most people are struggling to find enough money to save and reach these thresholds at the end of every month and year.
What Really Matters Is Not The Savings Rate But The Spending Rate
Of course, the reality is that in the end, people can only save what they haven’t already spent in the first place. Which means it’s impossible in practice to look at one’s savings rate in isolation without looking at their spending activities as well. After all, if all the household income is already being spent on various household needs, saying, “you need to save more,” is useless and irrelevant advice, because there is no money left to save!
Ideally, households will spend less than they make, which is what provides the “leftover” dollars to be saved. With the added benefit that if you spend less in the first place, you will also need less to retire in the future, because you don’t need as much in retirement savings to support that more modest retirement lifestyle.
The caveat, though, is that a good portion of household spending is relatively fixed and not very flexible, and is necessary to cover the essentials of food, shelter, health care, and perhaps job and transportation. For those households where essentials consume most or all of the household’s income, it may simply not be feasible to spend less than the household makes. On the other hand, once income is high enough to cover those essentials, the remaining expenses are by definition more flexible and discretionary, which means there is at least room to decide to spend less and save more (or not).
In fact, for those who have enough income that there is room for substantial discretionary spending of the money that’s left over at the end of the month, it’s often preferred to automate the savings process – the so-called “pay yourself first” strategy of automatically transferring funds from checking to investments/savings so it’s not there to be tempted to spend.
The key point, though, is that it’s not really the “savings rate” that defines a successful savings path to retirement. It’s actually the spending rate – and having a spending rate that is less than 100% of household income – because functionally most people don’t “choose” what to save per se… they choose what to spend, and then save the limited dollars that may or may not be left over after covering they fixed/essential expenses and any discretionary spending they choose to engage in.
Or stated more simply: you can’t actually choose or control your savings rate because there may not be any money left to save in the first place. But you can choose and control your spending rate (and create the dollars left over that are available to save).
The Spending Rate Is A Function Of Spending And Income
One of the reasons why it’s important and useful to consider a spending rate – as opposed to a savings rate – is that it puts both spending and income into the proper context.
The essence of the spending rate is that the household is healthier when the spending rate is lower. Which, as with any fraction, means either decreasing the numerator (spend less) or increasing the denominator (save more). In other words, you can improve your spending rate (and therefore have more money available to save) by either spending less or simply by spending the same but earning more (or even earning more and spending more as long you don’t spend ALL of the raise!).
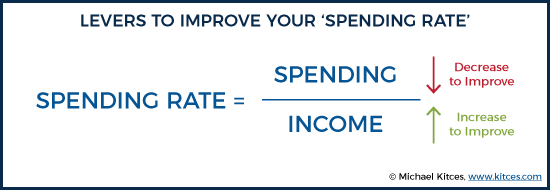
The distinction is important because for households where the fixed spending rate is relatively high (e.g., lower-income households or those in higher-cost-of-living areas), trying to focus on cost-cutting savings isn’t likely to have much impact anyway because there's not a large enough percentage of the budget that is discretionary and flexible to really matter. Instead, trying to earn more – whether by getting or retraining for a new job or industry, putting in extra hours for a promotion, or starting a side-hustle – can have far more immediate and positive impact on the spending rate.
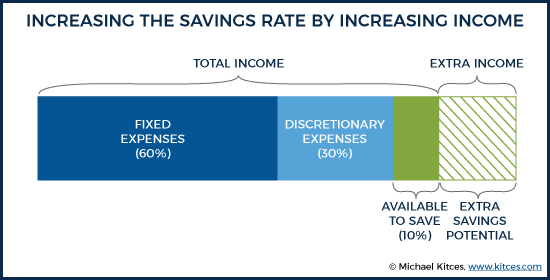
In fact, a notable trend of the so-called “FIRE” (Financial Independence, Retire Early) community is that the approach of extreme early retirement is commonly done as a combination of high-income or increasing earnings potential (e.g., via side-hustles) and frugal living (to keep the spending rate low). Which can lead to savings rates that may be as high as 50% or more. But not because they’re “saving 50% of income,” per se, but because they achieve a high enough income and maintain low enough expenses (especially low fixed expenses) to keep the spending rate low enough to be able to save that much in the end.
Benchmarking Spending Rates And Focusing On What Matters
One of the primary benefits of focusing on a spending rate (rather than a savings rate) when it comes time to improve it is that spending rates – especially when itemized by category of spending – can be benchmarked to what others spend to identify potential areas for improvement.
For instance, the Consumer Expenditure Survey from the Bureau of Labor Statistics (BLS) tracks consumer household spending across a wide range of categories, providing insight into what, exactly, is (and is not) material to the household budget.
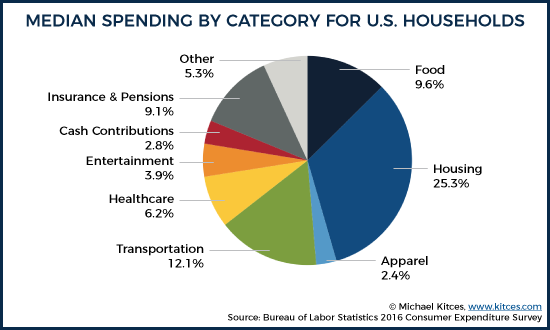
Notably, once the “typical” household spending is viewed this way, it becomes evident how dominant spending on shelter and transportation (i.e., your home and your car) is relative to total spending. Typical “frugal spending” guidance focuses on the famous “latte factor” (how buying fewer Starbucks lattes can add up to substantial savings) or reducing entertainment expenses with a “staycation” instead of a vacation, or tips to reduce spending clothing by buying generic brands or shopping out of season… when in reality those categories (eating out, entertainment, and apparel) each account for only 2% to 5% of total household spending. By contrast, housing and transportation costs alone add up to nearly 40% of household spending.
Of course, the dominance of housing and transportation is driven in no small part by the fact that for many parts of the country, those expenses are both high and relatively fixed (you “must” be able to get to a job and have a reasonably safe place to live in the vicinity of available jobs), which means they become (relatively) less demanding on the household budget as income rises.
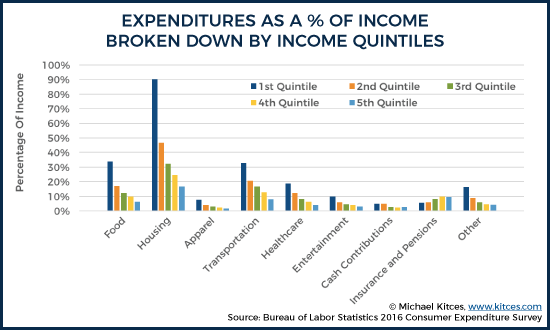
The good news is that, as the data affirms, there are some “economies of scale” on fixed expenses as income rises. Housing costs alone are actually a whopping 90% of the lowest income households and 46% of the next quintile, but only 25% for the second highest income quintile, and 17% of the top income quintile. Similarly, transportation costs are 33% and 21% of income for lower-income households, but only 13% and 8%, respectively, for the top two income quintiles.
Which emphasizes that, while upper-income households have a lot of flexibility in choosing where to allocate discretionary income towards spending or saving (as housing and transportation combined is only 46% and 29% of income, respectively), for middle-income households, those costs are both dominating and the only ones that can materially move the needle. While for lower-income households, income is too low to even cover those household expenses effectively (which are well over 50% and even more than 100% of all household income), necessitating a dip into debt or savings and driving a need for higher income (not spending cuts) to preserve and improve their financial situation.
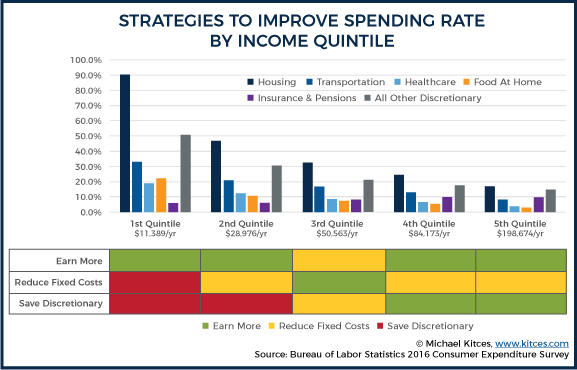
The crucial insight from this data is that the biggest component of spending that is at least potentially flexible is housing and transportation (as taxes, Social Security contributions, and health insurance are not), while categories like apparel, dining, and entertainment are not actually the most effective places to focus for most. In other words, making good decisions about the car and the house matter way more than the lattes and the avocado toast!
Where Are The Prudent Spending Guidelines?
Unfortunately, despite the fact that spending (or the absence of spending which allows for savings) drives the financial outcomes (by maintaining a less-than-100% spending rate), and is literally the quantified measurement of whether the household is “living within its means," especially in the major categories like housing and transportation… there is surprisingly little data available about what a “prudent” spending rate is in the first place, either in the aggregate or especially in the fixed versus discretionary categories.
What little guidance does exist for most households is driven primarily by what lenders have identified as the breaking points that risk a household becoming too financially stressed to be able to make its housing and auto loan debt payments in the first place. Thus the evolution of “rules of thumb” (and still in some cases, actual lending guidelines) for appropriate debt-to-income limits like keeping PITI (principal, interest, taxes, and insurance) payments to no more than 28% of monthly income, and keeping total fixed payments (for not only PITI housing payments, but also credit card and automobile payments, and alimony/child support payments) below 36%.
The caveat, though, is that these aren’t prudent or “recommended” spending amounts. These are the maximum amounts the lender thinks they can extract from the borrower to maximize the lender’s interest payments without taking unnecessary write-offs and defaults! And these guidelines actually assume there will be a default rate. How prudent does a 28% housing or 36% total DTI ratio seem when it’s assumed to have “only” a 95% probability of success (because the lender has decided to set their guidelines assuming a 5% default rate)? Not to mention that for a portion of the 95% who don’t actually default and go bankrupt, they may eventually pay the loan off, but not without a substantial amount of stress and difficulty (and likely a substantial amount of accrued interest) along the way just trying to barely make ends meet (with no savings) while they repay the loan!?
Another option is to look to at the aforementioned Consumer Expenditure Survey data, which has real data about what households actually spend. Still, though, the BLS data simply describes what households are doing, in an environment where it’s already been recognized that the national savings rate is dangerously low. It doesn’t give prescriptive guidance about what is prudent and what households should be doing to have a prudent spending rate (by category)!
Especially recognizing that what seems “prudent” to spend within your means itself can vary substantially by income. After all, a “luxurious” $1,200/month car payment for an affluent household may seem exorbitant to most, but is “just” over 3% of spending for a family with $500,000 of income (whereas the average household spends barely half that amount on transportation, and it’s almost 14% of their income!)
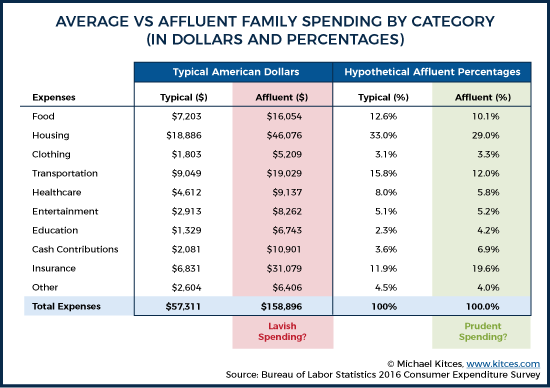
The bottom line, though, is simply to recognize that the real key to saving isn’t actually the “saving” itself, but setting reasonable and prudent spending guidelines – ideally derived from something beyond just what a lender is willing to loan out (in full anticipation that some people will be in over their heads and be unable to pay it back!). Which again raises the question – what should households spend, and what is a recommended and prudent spending rate? Or stated more simply, what does it really mean to “live within your means”?


Leave a Reply