
Executive Summary
Financial planners seem to increasingly agree we may be in a "new normal" - an environment where returns are lower, due to a combination of high market valuation, low interest rates, debt deleveraging, and the associated lower economic growth. Accordingly, it has become increasingly popular to reduce long-term return projections for clients from their historical standards. Yet the reality is that while returns may be reduced for the next decade, it doesn't necessarily mean clients will experience low returns for the entirety of their multi-decade retirement, just as those who retired in prior low-return environments like the 1970s may have had a bad decade of returns but an average or even above-average 30-year result. A better alternative may be to model retirement as a sequence of "investment regimes" - extended periods of time that have specific risk and return expectations, followed by subsequent periods of time that have their own expectations. For instance, instead of reducing 30-year returns, clients might look at the impact of having an average return of 5% for the first half of their return, and 15% for the second half, reflecting the market cycles seen throughout history. Could this actually represent a better way to project the risks and opportunities of retirement and develop appropriate spending recommendations?

The inspiration for today's blog post was a recent discussion I had with another planner regarding how do to retirement projections for clients in the midst of this difficult investment environment. "With the 'new normal' return environment," he said, "I'm running all my long-term retirement projections with a bond return of 2% and a stock return of 6%" and planning accordingly. Traditional retirement projections are just too rosy.
"Is that really accurate over the next 30+ years, though?" I replied. "I realize the next 10-15 years may be bad, but really bad return environments are normally followed by good ones. Isn't there a risk you're being unduly harsh about the client's truly long-term return by lowering the whole 30 years?"
"I don't know what else to do," he answered. "And it just seems too unrealistic to use long-term average returns in today's investment world."
Understanding Secular Market Cycles
As discussed recently, markets go through long-term "secular" cycles - extended periods of time of below- or above-average returns as market valuations expand and contract. Over the past century, these market cycles have led to a substantial long-term return for equities, although the reality is that virtually all of the cumulative gains of the markets were made in only about half the years, spanning four secular bull market cycles of expanding multiples. The rest of the time, the market was declining or just treading water, often for 10-20 years at a time, as shown in the chart below from Crestmont Research.
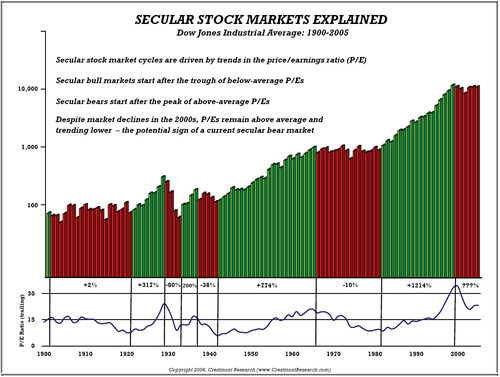
Notably, for someone living in the midst of a red zone, like the 1970s, the reality is that the long term return for the client can still be quite positive. For instance, the average annual compound growth rate of the S&P 500 from 1969 to 1999 on a total return basis was over 13% per year (even though the long-term average is closer to "only" 10%!)! However, that's only because it was barely above 0% for the first decade, and then hugely positive over the last two decades, as the secular bull market (the green zone) kicked in, delivering extraordinary equity returns for the 1980s and 1990s (to make up for the dismal returns of the 1970s and late 1960s).
The reason this matter is that, as the chart shows, today's retirees are living in the midst of another red zone - implying that returns may be poor for the coming decade, but not necessarily indicating that returns will be bad for the next thirty years; in fact, as the preceding example pointed out, it's actually possible that those retiring in the midst of a red zone could still have an above average long-term return, despite having an anticipated bad start.
Varying Expectations Through Market Regimes
Another way to look at secular bull and bear market cycles is to characterize them as different investment "regimes" that are characterized by their own expected returns and expected volatility (as the building blocks for portfolio design), which remain stable within that environment/regime until markets transition to a new regime (e.g., transition from a red zone to a green zone, or vice versa).
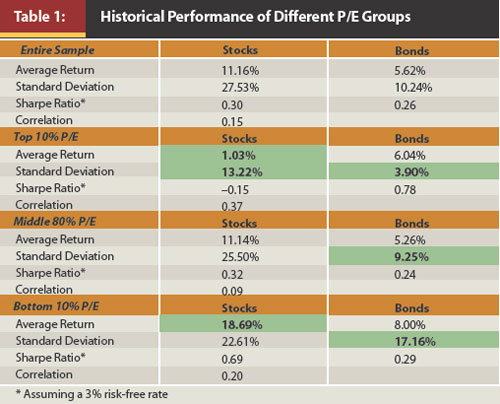
We demonstrated a version of this regime characterization in our Journal of Financial Planning article last year, "Improving Risk-Adjusted Returns Using Market-Valuation-Based Tactical Asset Allocation Strategies" where we showed the expected return and/or volatility were statistically significantly different depending on the market's starting valuation (and per Crestmont's research, starting valuation levels is the primary defining characteristic of the red versus green secular market cycles). The chart below, reproduced from the aforementioned article, shows the average return and volatility over the subsequent 5 years (the numbers shaded in green were statistically significant compared to the average).
Regime-Based Retirement Projections
Given the reality that return (and volatility) expectations vary by market regime/valuation environment, the ideal way of projecting retirement should be showing how the client's retirement goes in light of the starting regime and how it may change over time.
For instance, using the chart above, if the client was knowingly retiring in a high-valuation environment, it might be most appropriate to show a reduced average return for the next 5 years, then a period of average returns as market valuation normalized, and then ultimately a period of high returns at some further point down the road as market valuation ultimately hits the bottom 10% of P/E ratios. Ultimately, the long-term average might come out to be similar to what the 30-year average of the markets would have been anyway; but by showing the lower return / moderate return / higher return market sequence, the projection would better reflect the true sequencing risk of the client's retirement.
An even simpler way to adapt might be to further expand the next generation of Monte Carlo analysis by running a projection where the first half, when valuations are high, has an average return of 5% (representing secular bear market red zones) and the second half, when valuations are low, has an average return of 15%; the returns would then vary given a standard deviation of 20% (or perhaps varying standard deviations for the two valuation regimes). The end result, again, would be an a long-term plan that may still lead to long-term average returns, but do so with a return sequence that is more representative of the retirement risks the client faces.
Some research remains to determine exactly what the parameters of the regimes should be, and different planners will likely have their own opinions (just as different planners have varying views about what long-term return and volatility expectations to use in the first place). Nonetheless, the fundamental point is that illustrating a sequence of low-return/high-return regimes - that may average out to an appropriate long-term care, but accounting for the sequencing risk - may represent a far more accurate way to project the risk of a client's retirement plan, rather than arbitrarily reducing the 30+ year returns, which may over-estimate the reduction in long-term returns, under-estimate the reduction in short-term returns, and fail to accurately model the sequencing risk.
So what do you think? If there was a tool that allowed for regime-based retirement projections, would you use it? What kinds of return assumptions would you use if you could break retirement into 10-15 year segments and assign risk/return expectations to each, rather than only changing the whole return projection? Would this be a helpful tool for communicating the issues and concerns with clients? Is it more accurate to project the "new normal" of low returns followed by a "new new normal" of the above-average returns that will likely follow?

Michael,
Good analysis, and I am a big believer in secular cycles and such. However, there are a few real challenges to forecasting this way:
1) We have absolutely no idea how long each future (or current) secular cycle will last.
2) We don’t know the magnitude of the cycles
3) There is no way of knowing how the client’s needs, risk tolerance, and age will pay into asset allocations that far in the future (age matters if the secular cycles are off by several years, and extended poor returns could change the client’s risk tolerance down the road).
4) It is quite possible that instead of getting wild secular swings as we have seen in the past , that we experience a “muddle-through” sideways market for an extended period of time.
I agree that using long-term averages won’t work right now (for the foreseeable future). And I also agree that at some point there will likely be a significant market drop followed by secular market growth. But to try and forecast the timing, magnitude of returns, and asset allocation of a portfolio that far into the future seems like quite a stretch.
I don’t think your representation of the 1960’s and 1970’s as a bad time for retirees is entirely accurate. The Dow Jones is not exactly representative of a diversified portfolio. Is that a dividend adjusted Dow Jones chart or just price level?
Looking at a diversified portfolio that includes international stocks and bonds (which a retiree will most definitely have some exposure to bonds) you end up with somewhere between 6-12% annualized returns. Depending on the exact time period of the 1960’s and 1970’s you use.
Eric,
Given that inflation rose from 3% to 10% from the mid-1960s to the early 1980s, “just” getting 6%-12% annualized returns barely generated ANY real return (i.e., on an inflation-adjusted basis), and would still compound out to a radical dollar shortfall relative to the Jeremy Siegel 6.6%-real-return-stocks-for-the-long-run projection that our industry has historically used. The chart here shows real returns, specifically to strip out the illusion of higher returns in the 1970s that was actually driven primarily by rising inflation (which increased nominal earnings and nominal dividends but still lost ground on a real return basis).
On a price-only basis, the numbers would actually be radically worse. The Dow went from 1,000 in 1966 to 1,000 in 1981; eroded by 15 years of rising inflation would actually be radically worse than “just” a -10% cumulative real return. Dividends are what “saved” this time period to being only -10% cumulative on a real return basis.
And even if we’re going to project returns on a nominal basis, that still doesn’t change the fact that the two decades that followed (and the two decades that preceded it) were radically higher, and that projecting long-term average returns would have as egregiously understated returns and safe spending in the 1950s and 1980s as it overstated in the 1970s.
If a diversified portfolio would have given better returns, that only emphasizes the point. That means returns would have been STILL BETTER by dramatically reducing exposure to equities over the time period and owning even MORE of the non-equities asset classes, and then adding them back in the early 1980s after equity valuations hit the single digits.
As I’ve noted in the past, diversification is still no excuse to own an overvalued, high-risk, poor performing asset class: https://www.kitces.com/blog/diversification-should-not-be-an-excuse-for-blindly-owning-bad-investments/
Respectfully,
– Michael
Mike
It seems regime change is really market timing – which has not had the best of track records.
Better to tranche by objective. For example: x period for y duration (transition period) whereby 50% is from passive sources. Active retirement for x period (100% passive) Less than active retirement subsequent period.
Yes, the longer till the objective commences the duration – historically the more one can take more sequence of rate of return risk
By I wonder if better to define per objective than try to time the market per se…
jim
Mike
Obviously, I wasn’t communicating. Yes, the P/E adjustment which you have done in your modified withdrawal rates – is a useful adjustment. That is not my point.
The focus has become – as usual – on which one what kind- rather than the objective or tranche which can be achieved with ‘less risk’ at the expense of lower rate of return (something which is anathema to AUM inherently) Mike)
Case in point. Oil man with royalties they alone fund the his slow down and retirment goals. And yes, there is big risk here – no different than the closed held owner whose illiquid non income producing business -gives him the impression he is rich (even though he is not independent of his independent business)
But in the totality – accounting for diversification – to go which one one kind – rather than preservation – which may in part be but ‘insurance’ (hedging) – keeps the focus on the goal rather than % in this or that
In a Warren Beatty movie he played a hairstylist – classic line ‘I’ve cut so much hair, I’ve lost my concept.’
And herein is the point: 90%++++ is spent regardless of (winking bsing about life planning when its just eye candy) on which one what kind (stock, bond etc etc) and the focus is really managing assets rather than goals too often at the expense of the goals.
Mission/Vision – primary Goals second, allocation within tranches etc third, which one what kind fourth.
Reality – the other way around.
Michael,
Thanks for the writeup on this subject. Always a challenge to illustrate and evaluate history to help clients prepare for future uncertainty.
Updated Crestmont Research chart available here:
http://www.crestmontresearch.com/docs/Stock-Secular-Explained.pdf
Regards,
Mark Snodgrass
Yes, I would use such software! I am a MoneyTree Golden Years user and feel very hemmed in by the inability to dictate investment return regimes in the Monte Carlo.
Michael, I’ve added this ground breaking post to my CAPE Research Catalog (www.pe10ratio.com)
Thanks,
Kay
Another well thought and interesting article, Michael.
One question, Robert Shiller says PE ratios are now 33% above historic norms. Does this put us in the top 10% high PE ratio do you know? Today’s PE ratio at 22 roughly.
There was also an article by Craig Israelsen in various interest rate environments that showed bonds with consistent positive returns, except for 1994 basically (yes 2008 too but I wouldn’t attribute that year to the interest rate cycle.) Israelsen’s article actually complements your JFP article where bonds had rather consistent positive returns.
So, my point. If we’re in a top 10% PE ratio environment with forward equity returns to be below average potentially, and we have a history of bonds at least providing positive returns, if not extraordinary, you could then run a Monte Carlo with the first 10 years of retirement overweighted in bonds, and then say the next 20 back to a normal allocation depending on risk tolerance.
I think that would be a very effective software tool to use and realistic to boot.
Anyway, good stuff as always. I appreciate all who contribute comments too. Definitely gets the thinking juices flowing.
Because it has been 11 years since this article was published, I think it’s interesting (and hopefully useful) to look back and see how well the assumptions hold up.
From where I sit, neither the assumption of 6% forever or the assumption of a “‘new normal’ of low returns followed by a ‘new new normal’ of the above-average returns that will likely follow” looks very close at all. The 5 year period after August 2012 (call it 2013-2017) saw an average S&P 500 return (CAGR) of about 16%, and the 5 year period after that (2018-2022) saw an average S&P 500 return (CAGR) of about 9%. For the whole period since the article was published (2013-2022), CAGR has been about 12.5%, so there has been no period of “new normal” of low returns since the article was published.
In my book, Software Estimation: Demystifying the Black Art, I cite research from software estimation and other fields that shows that, the more subjectivity creeps into an estimate (aka forecast), the more error tends to creep in as well. In general, the most accurate estimates/forecasts are those that are created solely on the basis of historical data.
Most estimators (which in this case is financial planners) assume that tweaking the assumptions makes an estimate/forecast more accurate. The research shows the opposite is true: the more the estimator tweaks the assumptions away from using straight historical data, the more opportunity there is for subjectivity and error to creep into the estimate or forecast.
In the example in this article, if the preceding 40 years of historical data had been used to calibrate the forecasts (1972-2011), the CAGR for the S&P 500 would have been about 9.5%.
That historical figure turned out to be low, but Michael’s conversation partner’s reduced estimate of a flat 6% would have introduced more error into the forecast than just using the historical 9.5% figure. Michael’s desire to make the average return in the future work out to the same as the return in the past would have turned out more accurate over the really long run, but his sequence of lower-than-average returns for a few years would have added error to the forecast. Michael would have produced a more accurate forecast by just applying a straight 10% rather than making assumptions of the sequences of better and worse returns.
I think a better use for regime-based “forecasts” is not forecasting per se, but rather is for stress-testing a plan within different monte carlo scenarios. I.e., if a plan fails with a “regime of low returns followed by higher returns”, that’s useful to know.