
Executive Summary
Rebalancing plays a crucial role in ongoing portfolio management, both to ensure that the overall risk of the portfolio doesn’t drift higher (as risky investments can outcompound the conservative ones in the long run), and to potentially take advantage of sell-high buy-low opportunities. The caveat: it’s not entirely clear how often a portfolio should be rebalanced, in order to achieve these goals.
The conventional wisdom is to rebalance a portfolio at least once per year, and possibly even more frequently, such as quarterly or monthly. A deeper look, however, reveals that more frequent rebalancing will on average have little impact on risk reduction, even less benefit from a return perspective, and just racks up unnecessary transaction costs along the way.
Instead, the research suggests a superior rebalancing methodology is to allow portfolio allocations to drift slightly, and trigger a rebalancing trade only if a target threshold is reached. If the investments grow in line and the relative weightings don’t change, no rebalancing trade occurs. However, if these “rebalancing tolerance bands” are breached, the investment – and only the investment – that crosses the line, is then bought or sold to bring it back within the bands.
The one caveat to the process of tolerance band rebalancing is that it requires ongoing active monitoring of the portfolio itself, to ensure that you know when a threshold has been reached. Fortunately, though, a growing number of rebalancing software tools are available to help advisors track each investment, its rebalancing thresholds, and even automatically calculate and queue up the rebalancing trades necessary to bring the portfolio in line again!

Optimal Rebalancing Time Intervals
In the long term, rebalancing serves an important function in keeping a portfolio targeted to the appropriate level of risk, as otherwise higher-risk investments that have higher long-term returns would become overweighted by out-compounding the lower-risk lower-return positions in the portfolio.
In the short term, though, rebalancing also presents the opportunity to generate better returns – particularly when rebalancing amongst investments with similar long-term return potential –as the process of selling what has become overweight and buying is underweight can indirectly help investors to systematically sell high and buy low. In essence, the goal is to find investments that have moved to extremes, and trigger a rebalancing trade that buys/sell the investment just before it “snaps back” and reverts towards its long-term average. If the investments are never rebalanced before the snap back occurs, the opportunity is lost.
The caveat, however, is that rebalancing can also be done too frequently. For instance, if an investment was about to go on a huge run of outperformance for a year, rebalancing monthly will trigger a significant number of sales before the year’s gains have occurred, leaving upside on the table. Similarly, if the investment was about to decline in a year-long crash, rebalancing monthly into the falling investment will just keep buying more shares to experience the subsequent decline as the investment continues its path downwards.
In other words, in the short-to-intermediate term, either bull or bear market situations can produce scenarios where one investment has significant relative outperformance or underperformance that extends for months or even a year or few at a time, and rebalancing too frequently curtails the positive momentum and adds too quickly into the negative. And of course, highly frequent rebalancing can also grind down the long-term benefits of rebalancing simply due to the transaction costs.
Thus, ultimately the goal in rebalancing is to rebalance “often enough, but not too often.” Which raises the question of how often rebalancing should be done? Monthly appears to be too frequent, but what about quarterly? Or is annual a better frequency? How often do asset classes shift their direction of returns, to try to optimize the timing of the rebalancing trade?
Unfortunately, the problem is that even with relatively “simple” asset classes like stocks and bonds, or rebalancing between large-cap and small-cap, the timing of market cycles is not consistent. If bull markets always went for the same duration before turning, it would be easier – e.g., if bull markets “always” last 5 years, you would simply rebalance once every 5 years – but that’s not the case. Some bull markets are long with few or no corrections, while others are more volatile and/or run shorter. And bear markets tend to occur more quickly than bull markets, so the optimal bear-market rebalancing cycle may be different than for bull markets! Furthermore, as the number of asset classes expands, so too does the number of potential investment cycles to optimize, which will virtually never actually be fully in sync with each other (and especially not on a consistent and sustainable time horizon)!
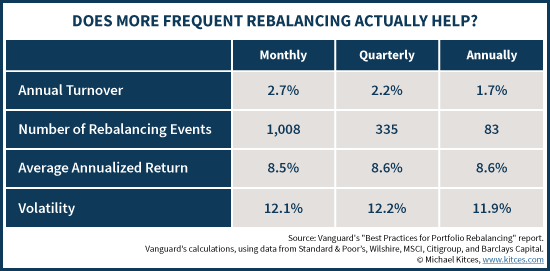
As a result, a study from Vanguard, by Jaconetti, Kinniry and Zilbering, basically found no material differences in outcomes for rebalancing frequencies varying from monthly to annual, once measured on a rolling period basis. When analyzed using a 60/40 portfolio going back to 1926, the researchers found that rebalancing quarterly or monthly produced no improvement in long-term risk or returns; it simply drove up the turnover rate and the number of rebalancing events (and potential transaction costs!).
Opportunistic Rebalancing With Allocation Tolerance Bands
Conceptually the goal of rebalancing is to sell an investment after it has fully (or at least mostly) had its favorable run, and similarly to buy an investment after it has fully (or at least mostly) declined. Yet as noted, because a diversified portfolio has a wide range of investments, which do not necessarily peak and trough over the same time intervals, it’s difficult to find an optimal rebalancing frequency.
An alternative, however, is to restructure the process to rebalance not based on a time horizon, but instead rebalance based on a threshold for how “out of whack” an asset allocation (or the allocation of any particular investment in the portfolio) is permitted to be, before reining it back in again. In other words, the threshold for triggering a rebalancing trade is not the passage of time, but how overweighted or underweighted it’s permitted to become (given the relative movement of the underlying investment itself).
For instance, a portfolio that was targeted to be 50% in equities (with the other 50% in bonds) might aim not to just rebalance annually, but to rebalance whenever the total equity exposure grows above 60% (which would signal a significant level of outperformance for stocks over bonds, implying that they might have become overvalued to the point that a sale would be appealing).
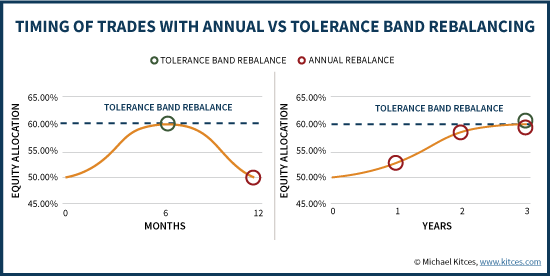
In this context, if the equities appreciated rapidly and reached the 60%-equity threshold in just six months, then the rebalancing trade would occur in six months. If equities grew more slowly and it took three years before the portfolios’ equity exposure finally drifted up to 60%, then it would be three years before the first rebalancing trade occurred. Either way, as shown below, the rebalancing trade would not occur until equities had outperformed by enough, cumulatively, to cause the equity allocation to rise to 60%. Of course, this also ensures that the stocks are not sold “too early” while they’re still rising!
Notably, this kind of threshold approach would also have a comparable “buy” trigger if equities were to decline, rather than appreciate. For instance, if equity exposure started at 50% but fell (due to a bear market in stocks) down below 40%, a rebalancing purchase would be triggered. And again, the rebalancing event would only be triggered once the allocation actually crossed that lower threshold; if a sharp bear market caused equity exposure to cross the line in just six months, the rebalancing trade would occur in six months, and if it took a longer, more protracted bear market that lasts 18 or 24 months, the rebalancing trade would occur then instead.
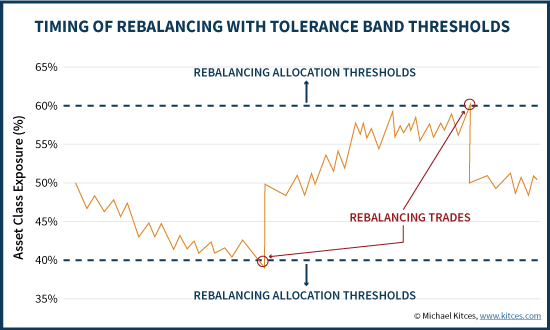
The end result of establishing these kinds of minimum/maximum allocations before a rebalancing trade is triggered is that a form of “allocation tolerance bands” have been created, as shown below. A portfolio that was targeting 50% in equity exposure will now trigger a rebalancing trade if the allocation falls below 40%, or above 60%. Anywhere in between those thresholds and the portfolio simply remains a buy-and-hold strategy. When either tolerance threshold is breached, to the upside (or downside), a sell (or buy) is triggered.
It is important to note that in this context, allocation bands are based not on portfolio dollar amounts, nor on how much an investment has appreciated or declined in value, but on portfolio allocation percentages. The distinction is important, especially in the case of investments that otherwise have similar returns (good or bad), because it ensures that rebalancing trades don’t just happen because both investments happen to decline or appreciate. In other words, in a portfolio where everything is up by 15%, the weightings will be the same, and no rebalancing trade will occur (which is good, as there’s no reason for a rebalancing trade in this instance!). One investment must outperform the rest on a relative basis in order to change its allocation enough for a rebalancing threshold to be triggered.
Another notable benefits of this approach is that since only the investment that crosses the threshold needs to be rebalanced, in a multi-asset-class portfolio the tolerance band approach will reduce the volume of rebalancing trades (and therefore save on transaction costs). For instance, if there are 5 investments in the portfolio and one of them dramatically outperforms – enough to reach the rebalancing threshold for being “too” overweight – only that investment will be sold and rebalanced (into whichever positions are now the most underweight). The rest will have no transactions. By contrast, with an alternative like arbitrary annual rebalancing, every investment in the portfolio gets rebalanced – even if it only needed a 0.1% trade to be back to its target allocation, resulting in a ‘wasteful’ transaction cost!
Setting A Target Allocation Threshold For Rebalancing Bands
While conceptually the idea of establishing target allocation bands for rebalancing is relatively straightforward, the question still arises about exactly what the optimal threshold levels would be for those tolerance bands – as ultimately, similar to a time-based interval for rebalancing, it is still necessary to come up with an overall rule to apply the framework uniformly for the portfolio. And making the tolerance bands too wide or too narrow can have deleterious effects on rebalancing, just as it occurs when rebalancing time intervals are set too wide or too narrow.
Absolute Vs Relative Tolerance Bands For Rebalancing
For instance, should an investment or asset class only be rebalanced when its allocation moves more than 10 percentage points from its original target (e.g., an investment with a 50% allocation has thresholds at 40% or 60%, as shown earlier)? Or only five percentage points? Or should the allocation band be even wider, at 15%, to allow more room for favorable investment performance to extend (and for a declining market to ‘finish’ its decline)?
The problem with setting allocation bands based on an absolute magnitude change – e.g., plus or minus 10 percentage points – is that it quickly becomes problematic when there are a larger number of smaller investment positions in the portfolio. If the portfolio is diversified across 10 different investment positions, each one only has a 10% allocation in the first place; plus or minus 10% would be a range between 0% and 20%, which would require very extreme portfolio changes to ever trigger a trade (literally, the investment would need to generate more-than-double the returns of its peers to generate a 10 percentage point overweight, or would have to crash to zero to be 10 percentage points underweight!).
Of course, the target allocation bands could be made smaller for a portfolio that averages smaller positions – e.g., set the targets at “only” 3%, as moving from a 10% to a 13% allocation is still a very big relative move – but this only works well when all the positions in the portfolio have a similar allocation percentage. For instance, if the portfolio is a “core-and-explore” approach with 50% in a core equity position, and a series of five satellites with 10% each, the 3 percentage point band would trigger the satellites to rebalance at 7% or 13% (which may be reasonable) but the core equity position will rebalance at 47% or 53% (which given the relative size of the position, will be triggered far more often). Which means the satellites would have to outperform or underperform enough to change their weighting by 30% to be rebalanced, while the core would need far less relative under- or out-performance for a trade to occur.
Given that absolute rebalancing bands have a different relative impact for varying sized positions, an alternative solution is to simply scale the allocation bands relative to the size of the portfolio positions in the first place. For instance, rebalancing might occur any time the investment’s weighting moves more than 20% from its original target weighting. So if the investment’s original allocation was 50%, and 20% of that is 10%, then the portfolio would be rebalanced when the investment’s weighting moves up to 50% + 10% = 60%, or down to 50% - 10% = 40%. On the other hand, if it was only a 10% allocation, the rebalancing trade would occur at thresholds that are 20% of the 10%, which means rebalancing would occur at 8% or 12%. Either way, the investment must effectively outperform all the others by approximately 20% on a relative basis, to cause its relative weighting to drift above or below the thresholds (regardless of the weighting it started at).
In other words, setting the thresholds for target allocation bands on a relative basis – e.g., 20% of the target weighting itself – creates a mechanism where any one particular investment that moves to a high or low extreme will be sold or bought accordingly, because its performance is so different than everything else. But rather than forcing a rebalancing transaction for all investments in the portfolio – whether necessary or not – as would occur with time-based intervals for rebalancing, a relative threshold to the target weighting will just trigger rebalancing trades for the exact investment that moves away from the rest. This will trigger a “trim” to an investment in the midst of a strong run, and a purchase for one that has just crashed (relative to the others).
Target Thresholds For Relative Relabancing Bands
Of course, the caveat to this approach is that it is still necessary to set what the rebalancing bands should be in the first place – how much of a relative movement is appropriate to trigger a trade? As with any allocation band (or any other rebalancing) approach, the key here is to set the threshold wide enough that it won’t trigger an excessive volume of trades (which racks up transaction costs) or repeatedly curtail positive momentum (or amplify a crash), but not to set the thresholds so wide that any rebalancing opportunities are lost because no trades are triggered at all.
A 2007 study in the Journal of Financial Planning by Gobind Daryanani entitled “Opportunistic Rebalancing” studied rolling 5-year periods from 1992 to 2004 and found that the optimal rebalancing threshold was at a relative threshold of 20% of the investment’s original weighting. Setting the thresholds narrower, such as only 10% or 15% bands, produced less favorable results, as did rebalancing bands that were 25%. The goal, again, is to set a threshold that is ‘far enough’ out to allow investments to run near extremes, but not so far that they run to extremes and bounce back again, without ever triggering a buy or sell trade.
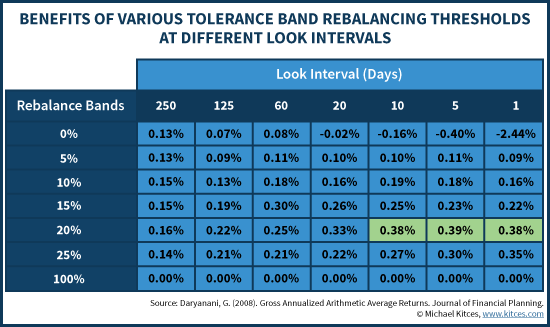
On the other hand, it is still important to note that the wider the bands are for rebalancing, the more material the underlying equity (or other) allocation changes can be in the first place, and the less frequently rebalancing will be triggered. The 20% relative rebalancing bands in the Daryanani study, which was based on a 60/40 portfolio (comprised of 5 asset classes, including large-cap US, small-cap US, REITs, commodities, and intermediate-term bonds), was sufficient to ensure that total equity exposure never drifted more than 5% from the original 60/40 allocation.
If fact, Daryanani ultimately found that this threshold-based rebalancing was so effective, that the best strategy was to “look constantly” to see if there were any rebalancing opportunities (i.e., if the thresholds had been breached), even if it might be weeks, months, or years without actually triggering a trade. Checking less often – particularly any less frequently than once every 2 weeks (every 10 trading days) – resulted in diminishing rebalancing benefits. By contrast, the “look-often” opportunistic rebalancing approach was effective enough to even increase overall returns, despite the fact that doing so curtails the long-term compounding of equities over time! Similarly, the Vanguard study also found that threshold-based rebalancing can provide a slight return enhancement, albeit using slightly narrow bands with a 5% absolute threshold (from a baseline 60/40 portfolio).
Of course, the practical caveat of this approach is that it’s necessary to have the means to do such regular “checks” for rebalancing opportunities on an ongoing basis, which means using rebalancing software tools like iRebal, tRx (Total Rebalance Expert), or Tamarac (or perhaps a robo-advisor that employs a similar threshold-based rebalancing approach). Nonetheless, for those who have the technology means to do so, the tolerance threshold approach to rebalancing appears to be a more effective rebalancing strategy, both in terms of the timing and execution of rebalancing trades, and its ability to minimize the transaction costs along the way!
So what do you think? What’s your process for rebalancing client portfolios? Do you do it monthly, quarterly, or annually? Or do you use a tolerance band approach, and do rebalancing opportunistically when a threshold is reached? Please share in the comments below!
