Executive Summary
Financial advisors often seek to help clients understand the range of outcomes they might experience when following a given financial plan, and frequently rely on statistical probability outcomes derived from Monte Carlo simulations to report on what outcomes the future may hold. In turn, some researchers and practitioners have suggested extending the analysis even further, by accounting for related statistics, such as Magnitude of Failure and Expected Failure, to shore up the weaknesses of Probability of Failure and further enrich the breadth of information that prospective retirees have when considering the best plan to pursue. However, a focus on ever-deepening statistics alone ignores other important aspects of how retirees perceive risk.
Peter Sandman, in his book Responding to Community Outrage: Strategies for Effective Risk Communication, suggests an updated definition of risk that includes not just an objective component – “Hazard”, which measures probability and magnitude of failure – but also a subjective component, which Sandman calls “Outrage”. In Sandman’s framework, “outrage” accounts for an individual’s emotional reaction to risk. For instance, if a plan’s Magnitude of Failure is relatively low, we may think that this will calm retirees’ fears; however, including statistics based on failure in client communications may highlight low-probability-but-catastrophic and dreaded plan outcomes that are involuntary and uncontrollable. Rather than calming fears, these factors may instead amplify outrage and, therefore, heighten the perception of risk. And because Sandman finds that outrage can weigh just as much on our evaluation of risk as the hazard itself, advisors who frame their planning process and communication to reduce their clients’ negative “outrage” emotions can potentially help clients better understand what their plan’s outcomes really mean, and make better choices.
In practice, this means moving away from outrage-inducing failure-based statistics and language, and instead counseling towards dynamic adjustments over time (e.g., spending more if they can and less if they must) as circumstances change and the risk landscape evolves. This also allows advisors to reframe retirement risk in more adjustment-based and even-less-outrageous terms that emphasize what is voluntary and controllable, with a process to manage a chronic (not catastrophic) risk, focusing more on questions like: “What would need to happen to trigger an increase or decrease in income?”, “If we find ourselves in such a situation, how large would the increase or decrease be?”, and “What would we expect a household to experience in a good/bad financial environment when following this plan?”
Ultimately, the language we use to describe risky outcomes – and the potential “outrage” it can induce – plays an essential role in the conversation around retirement risk, as much as discussing the hazards (objective risks) of retirement itself. By moving away from the concepts and language of Failure and Success, the financial advisor can lessen the emotional reaction clients may have in response to their financial plan. Similarly, when advisors present adjustments as a natural and necessary part of the plan, clients will be more likely to accept and proactively implement the changes that may be required for a successful plan outcome. By adopting Sandman’s updated definition of risk, and accounting for both objective Hazard and the more subjective Outrage components of risk, advisors may find that clients are not only more open to having conversations about their financial plans but also more willing to listen to their advisors, follow their financial plans, and make changes when action is needed!
Financial “Failure” And Ruin: The Wrong Definition Of Risk
Because the future is uncertain, it is useful – even vital – to understand the range of possible outcomes clients might experience when following a given financial plan.
This is usually accomplished today with Monte Carlo analysis, which simulates a large number of possible futures based on assumptions about how capital markets will behave. Both average investment returns, and sequences of good and bad returns, will vary among these scenarios, mirroring the fact that there are good and bad periods in financial history and, presumably, in the financial future.
In some proportion of these simulated scenarios, financial assets will be exhausted before the clock runs out. Dividing the number of such depletion scenarios (say, 200) by the total number of simulated scenarios (say, 1,000) gives us Probability of Failure (20%, in this example) and its complement, Probability of Success (80%).
On the face of it, this looks like a useful measure of a plan’s quality. A plan with a high Probability of Success is better, right? After all, who doesn’t like success? And who wouldn’t want to avoid financial “failure” and the financial ruin that it implies?
But Probability of Success and Failure don’t withstand much scrutiny as monolithic statistics.
The forced division of simulated scenarios into the two buckets of Success and Failure hides the real diversity of outcomes. First, there’s diversity in timing. The “failure” bucket typically includes some scenarios that run out of money in the middle of retirement, but some that only just run short just a year or two before the end (and in practice, the retiree may not have ended out living that long anyway). It seems odd to lump these very different outcomes together as “failures”. In the latter case, a small adjustment to spending late in life, or a change in health that alters when the plan ‘ends’, would have sufficed to avoid ruin. In the former situation, that isn’t true, and the shortfall can be far more dire. Probability of Failure doesn’t capture these differences in timing.
In addition, we can’t even assume that an early “failure” would be exceptionally painful. For that we need to know more about the makeup of a household’s income. For example, if 90% of planned income comes from sources like Social Security and pensions, then “running out” of investment funds would reduce income by 10% at most, which is still a ‘manageable’ adjustment for most. In contrast, if 90% of planned income comes from non-guaranteed portfolio investments, failure looks much more dire. Probability of Failure also fails to capture these differences in degree.
Because Probability of Success and Failure gloss over important issues like these (and similar differences of degree in the “success” scenarios), it seems natural to add Magnitude of Failure and related measures to our suite of statistics.
Example 1: Frank the Financial Advisor has prepared financial plans for two different clients, Alan and Barbara.
Each client wants $10,000/month over a 30-year retirement, and Monte Carlo simulations tell us that both plans have a 20% Probability of Failure.
However, the average Magnitude of Failure for their respective plans is very different, due to the differing compositions of their investment portfolios and how much each relies on guaranteed vs non-guaranteed income sources.
- Alan’s plan has a low average Magnitude of Failure: A one-year income shortfall (1/30th of a 30-year retirement), or $120,000.
- Barbara’s plan has a high average Magnitude of Failure: A 15-year income shortfall (1/2 of a 30-year retirement), or $1.8 million.
As the example illustrates, “just” looking at the probability of failure alone (20% in both cases) fails to convey the sheer level of risk for Barbara, and the relatively modest risk for Alan. It’s not until the magnitudes of those failures are revealed that it becomes clear that a 20% failure risk is not at all the same in its potential impact.
In turn, though, just like Probability of Failure, Magnitude also fails to capture risk entirely accurately on its own. To measure risk more completely, we might shift to the statistical notion of “Expected Failure”:
Equation 1: Expected Failure (a more complete definition of risk)
Expected Failure = Probability of Failure x Magnitude of Failure
Expected Failure could be measured in total dollars or years of missing income.
Example 2: Continuing the prior example, for Alan and Barbara, who have the same Probability of Failure, their Expected Failure could be expressed as follows:
Alan (low Magnitude of Failure): 20% x 1 year ($120,000) = 2.4 months, $24,000
Barbara (high Magnitude of Failure): 20% x 15 years ($1.8 million) = 3 years, $360,000
Though this idea of introducing an “Expected Failure” metric (capturing both Magnitude and Probability of Failure) is theoretically well-grounded, it won’t necessarily do the trick either. It assumes, wrongly, that clients (and advisors!) are just hyper-rational beings who focus only on what risk professionals might consider ‘objective’ risk (which would be measured just as in equation 1). Yet while most people can likely do some decent intuitive statistical reasoning when pressed (though perhaps they can’t), this just isn’t the full picture of how we experience and interpret risk.
We don’t just bring our inner statistician to that task. We bring an entire interpretive framework, including important psychological biases. Because of these biases, including Magnitude of Failure or Expected Failure in client communications may run the risk of doing more harm than good. A statistician might love these terms, but financial planning clients may not. To understand this problem, we need to bring a fuller definition of risk into the risk conversation.
Risk = Hazard + Outrage: A New Definition Of Risk
 Peter Sandman, in his entertaining and insightful Responding to Community Outrage: Strategies for Effective Risk Communication, discusses how risk professionals and the public can have quite different approaches to risk. He argues that this is why both scaring people into action (e.g., you should stop smoking – it’s bad for your health) and calming them down (e.g., dimethylmeatloaf is not harmful to humans – you don’t have to worry about that dimethylmeatloaf factory next door) can be very difficult. He notes that:
If you took a long list of hazards and rank-ordered them by something such as expected annual mortality (how many people they kill in a good year) and then rank-ordered the same risk by how upsetting they are to people, the correlation between the two rank orders is approximately 0.2… In other words, the risks that kill people and the risks that upset them are completely different.
Experts tend to see this mismatch and think that they just haven’t explained themselves well enough: Maybe we just need more statistics, or we need to explain better what “parts per billion” means! The presumption is that humans are just exhibiting their “irrational” biases by not properly accounting for the quantified risks.
Sandman argues that this is wrong, and that the experts are focused on only half of the real risk equation. The experts, and Equation 1 for Expected Risk, above, are focused on what he calls “Hazard” (or what the experts characterize as “objective risk”).
Equation 2: Hazard (or “objective risk”)
Hazard = Probability × Magnitude
Sandman argues that a full definition of risk includes both hazard and outrage:
Equation 3: The full risk picture
Risk = Hazard + Outrage
In other words, the problem is not that the average person misunderstands the “hazard” (probabilities and magnitudes of failure), but that “risk” has another dimension beyond the hazard: outrage.
Outrage Accounts For The (Negative) Emotional Component Of Risk
In Sandman’s “risk” framework, the term “outrage” stands for factors that can lead to strong negative emotional reactions and worry. To say outrage is emotional is not to say that it isn’t real or that it’s unjustified (just because it’s not in the “hazard” part of the risk equation). It is most certainly real, and in many cases it is also quite justified.
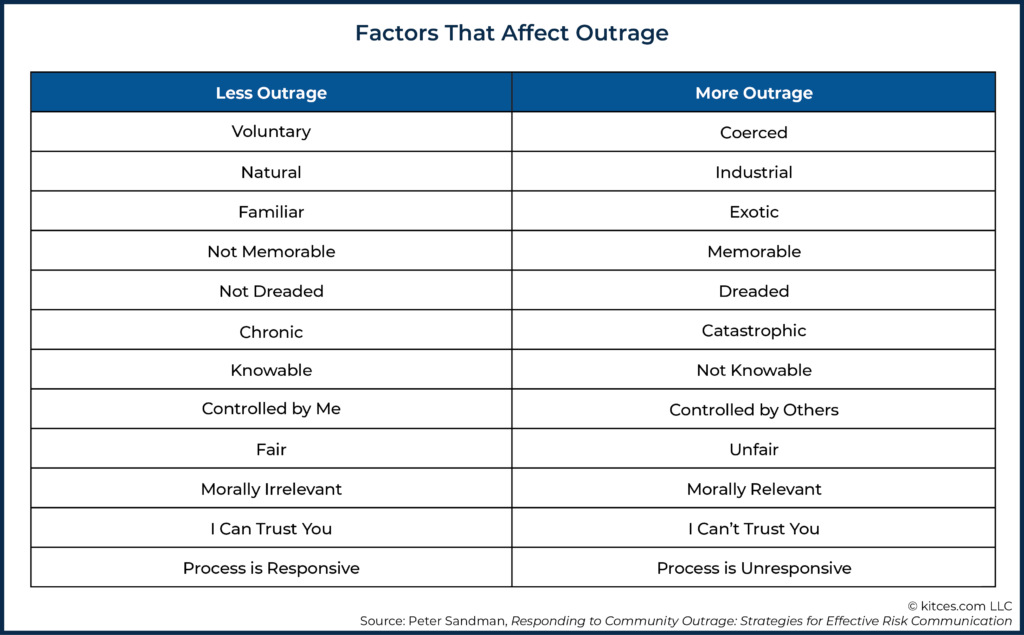
Sandman explores many factors that lead to outrage and organizes them in pairs that differ on the axis of low/high outrage.
For instance, risks that feel fair and controllable don’t provoke the same level of outrage as risks that may have similar hazard but are unfair and uncontrollable (e.g., the risk of cancer from smoking, versus getting cancer due to consuming carcinogens in water that wasn’t treated properly). Similarly, risks that are natural and familiar don’t provoke the same level of outrage as similar-hazard risks that are industrial and exotic (e.g., the risk of being struck by lightning, versus the risk of being electrocuted due to faulty wiring). We would likely have very different visceral reactions of outrage if we ourselves or a loved one were to succumb to one of these risks versus another, even though the hazards of each may be similar.
And while Sandman’s full exposition focused more on carcinogens and plane crashes, rather than bear markets and failure in retirement, some of these clearly apply to financial planning.
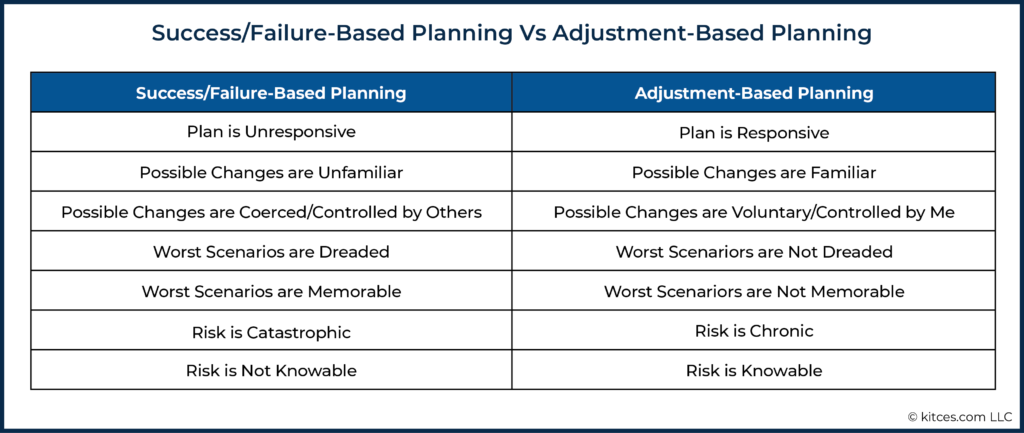
In particular, our focus on the potential for “failure” in financial planning lines up on the “more outrage” side of this ledger on at least three of these dimensions: memorable, dreaded, and catastrophic.
Memorable risks are things that stick in your mind. They evoke vivid mental images. Personal experience, news stories, and symbols can all make things more memorable.
The feeling of dread probably has deep psychological roots, but the intuition is clear: we dread things we imagine to be particularly horrible (shark attacks, cancer, etc.), frightening, gruesome, or disgusting.
Finally, we are more outraged by catastrophic events (e.g., a plane crash) than chronic ones (e.g., heart disease). In finance, this is likely why retirees may see more risk in stock market crashes (a catastrophic event) than in, say, the slow destruction of purchasing power through inflation (a chronic problem), even though for most retirees the hazard of the second is actually much higher than the first).
Accordingly, Sandman admonishes us not to dismiss or underestimate outrage. Though designed for very different industries, the following observations about outrage seem to apply perfectly to financial professionals as well:
- Outrage is as real as hazard;
- Outrage is as measurable as hazard;
- Outrage is as manageable as hazard;
- Outrage is as much a part of risk as hazard; and
- Outrage is as much a part of your job as hazard.
Sandman believes that the mismatch we saw earlier between experts’ estimations of risk (what Sandman redefines as “hazard”) and public concern about risks is due to the full risk picture, earlier described through Equation 3. The consumer may or may not be misperceiving hazard as communicated by the experts. But often the real problem is the experts are misperceiving the outrage of the consumer.
Outrage Impacts Clients’ Reaction To The Way Advisors Communicate About ‘Failure’
What role does Risk, Hazard, and Outrage play in clients’ reactions to Probability or Magnitude of Failure in financial planning communications? The short answer is: more than most financial advisors may realize.
Imagine an advisor sharing with a client the good news that they are in a fortunate “low magnitude of failure” situation, similar to Alan in Example 1 earlier.
Example 3: Adrian the Advisor is meeting with his clients, Mr. and Mrs. Smith, to share with them that their financial plan results indicate they have a low magnitude of failure. Their conversation goes like this:
Adrian: Mr. and Mrs. Smith, we’ve run an extensive analysis on your financial situation, and we’re happy to report that you can afford $10,000/month in retirement with an 80% Probability of Success.
Now, that means you’d have a 20% Probability of Failure, which may sound higher than you might like. But, at ABC Planning, we like to look beyond Probability of Failure and examine Magnitude of Failure as well.
We estimate that if you were to fail, you would on average only be short by $120,000, or one year of income out of your 30-year retirement goal, meaning your expected failure is just $24,000!
In fact, this failure would be avoided entirely if both of you simply end out passing away earlier than we have planned!
Mr. and Mrs. Smith: …
In Example 3, above, the clients have just heard their advisor say that they should expect failure (what else could “Expected Failure” mean?) in the scope of five or six figures (we can forgive someone for failing to grok the difference between Average Magnitude of Failure and Expected Failure).
They also heard the advisor cheerfully explain that a 20% Probability of Failure isn’t so bad, and that they could avoid failure completely by dying! For these (and so many other) clients, a focus on failure, even in an attempt to ameliorate the shortcomings of Probability of Failure, serves to amplify outrage. So, this communication has likely done much more harm than good.
Many clients will hear “failure” and think about a catastrophic, dreaded event that they can imagine vividly. They imagine life going on as normal until, one day, the bottom falls out. They’re on the street. They’re at the food bank. These images are memorable: we’ve seen very real pictures of these events in the news, particularly during the COVID-19 pandemic.
In turn, the more firmly a client puts financial ruin outcomes in the “more outrage” column, whether due to their personal tendencies or their own life history, the more they will seek to avoid any perceived chance of failure, and the more risk they will perceive in a plan that is analyzed in terms of failure statistics. An example would be the well-documented tendency of those who experienced the Great Depression to be unusually risk-averse – not because the hazards of risk are any different for them than others, but because the outrage associated with risk is greater for them given what they witnessed in the early formative years of their lives.
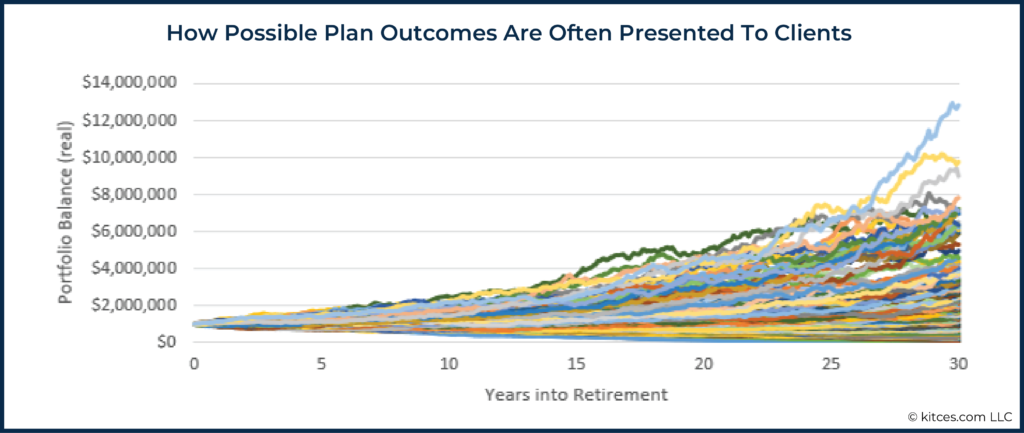
Unfortunately, it’s very hard to escape the term “failure” in today’s planning platforms. There’s a good chance your financial planning software gives you a chart that looks something like this:
If a client takes this chart to heart as a set of possible life outcomes, they could be justified in thinking that the “process is unresponsive” (they don’t want to run out of money, but they’re also not trying to just sit by while their nest egg grows, unspent, to 3X or 5X or 10X what they started with!), or that the risk is “not knowable” (as financial advisors emphasize that “we don’t know” which path the client’s portfolio will take)… two more concepts on the “more outrage” side of Sandman’s ledger! After all, what sort of financial plan would drive me to financial ruin? Surely not a responsive one! And what sort of financial plan has such a wide range of possible outcomes? Surely not one where risk is truly knowable! (In fact, it’s hard to see why one would need sophisticated software to calculate that financial outcomes could be somewhere between financial ruin and flying private jets.)
In other words, the very terms “success” and “failure” can lead to outrage, no matter what additional analytical nuance is added to the conversation about the hazards. And this outrage can lead to fear and anxiety. As Sandman’s work so effectively illustrates, just measuring failure more accurately is not going to eliminate or reduce this outrage. Better measurements of hazard (i.e., objective risk) still ignores the emotional “outrage” component of risk altogether!
If this is true, the best approach might be to abandon the concepts of success and failure altogether. Luckily, there are good reasons to do so independent of psychology, including simply recognizing the realities of how retirees actually live their retired lives.
People Don’t Succeed Or Fail In Retirement – The Dynamics Of Life (And Financial Planning) Facilitate A Range Of Outcomes
Probably the best reason to abandon success and failure metrics in planning is that these concepts are just inadequate to describe the range of realistic financial experiences.
Most often, financial advisors use probability of success and failure to analyze retirement income plans. But there’s a problem with talking about failure in retirement: people don’t actually tend to fail (e.g., go bankrupt) in retirement, and in practice the bankruptcy rate of retirees is far lower than even what typical probabilities of failure would suggest. So, it is odd (to say the least) to show clients graphs that suggest failure could happen to them at some reasonably high probability. Even a 10% or 20% probability of failure sounds pretty scary, but that’s not how often retirees actually “fail”.
It’s also not helpful to group all of the outcomes that are as good or better than the plan under a blanket concept of “success”. Clients might interpret “success” as simply having reached their goals and no more. But in most of the “success” scenarios they will have (far) exceeded their goals (sometimes with many many multiples of their starting retirement wealth left over). A gross dichotomy of “success” and “failure” alone fails to highlight these very positive outcomes as well.
Of course, the real key is recognizing that few retirees live either extreme. Retirees rarely just keep spending and spending until their retirement assets are depleted, nor do they typically just maintain the exact same lifestyle, even as ‘excess’ wealth accumulates in good scenarios. Instead, retirees adjust along the way.
This means, realistically, that we should expect financial lives to include adjustments along the way as new information becomes available. As time goes on, those who monitor and manage their plans will reevaluate their situations. They will adjust for changing life expectancy (due to changes in age and mortality expectations), changes in their financial situation, changes in needed income, changes in the economic environment, etc.
At certain points, they may need to make choices about increasing or decreasing their spending or changing other parts of the plan (like future legacy or spending goals). This is a natural process familiar from our working lives. It would be inaccurate to crudely call upward adjustments “success” or downward adjustments “failure.” Change is simply a part of life, and something that most retirees have long since accepted as reality by the time they live long enough to reach retirement.
If planning is done dynamically, then financial outcomes will usually range from (a bit) worse than planned to (much) better than planned. To describe this range of outcomes, we need statistics that focus on chances of adjustment, the size of those adjustments, and their timing.
Such statistics cannot be found in simulations of static plans, where clients behave like Wile E. Coyote and run right off the cliff of financial ruin (if not ‘prevented’ from doing so upfront by a financial planner who ratchets down their spending plans to be safe in ‘all’ scenarios). Only simulations of dynamic plans can give us access to statistics that help answer questions like:
- What would we expect an average household to experience when following this plan?
- What would we expect a household to experience in a good/bad financial environment when following this plan?
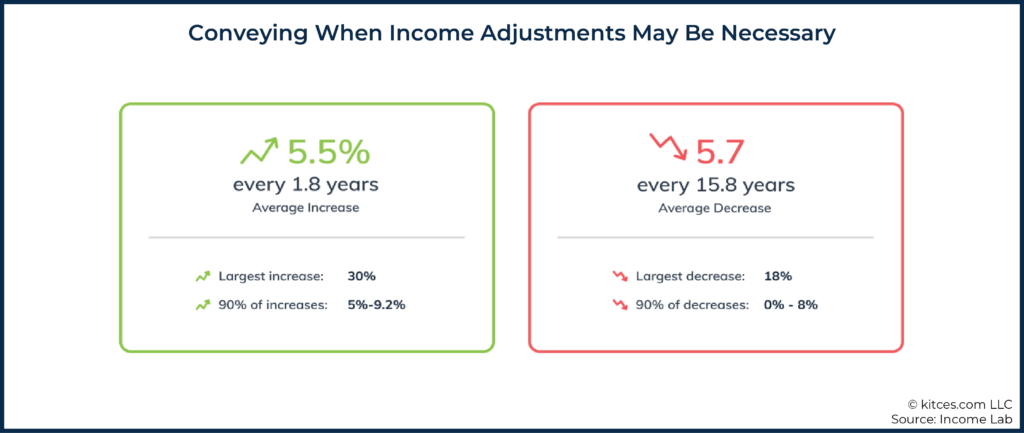
- How often should we expect an upward or downward adjustment and how large could individual adjustments be?
Dynamic plans also address shorter-term questions like:
- What would need to happen to trigger an increase or decrease in income?
- If we find ourselves in such a situation, how large would the increase or decrease be?
Discussing Dynamic Planning (With Adjustments!) Is Less Outrageous
While engaging in more dynamic planning is arguably a far better fit to how retirees (and individuals in general) live their lives, it’s also important because, from the perspective of Sandman’s “Risk = Hazard + Outrage” equation, discussing dynamic planning questions involves much less outrage-inducing vocabulary.
Example 4: Consider the following dialogue between Adrian the Advisor and his clients, Mr. and Mrs. Smith:
Adrian: Mr. and Mrs. Smith, we’ve run extensive analyses on your financial situation and we’re happy to report that income of $10,000/month is a strong place to start retirement.
Of course, we will be monitoring your financial situation and updating our analysis regularly, and we’ll let you know if and when adjustments might be warranted.
We’ll notify you when we think you can afford to spend more, or if we think it would be prudent to trim spending back.
Mrs. Smith: That’s great news. What sort of thing would make you recommend a change?
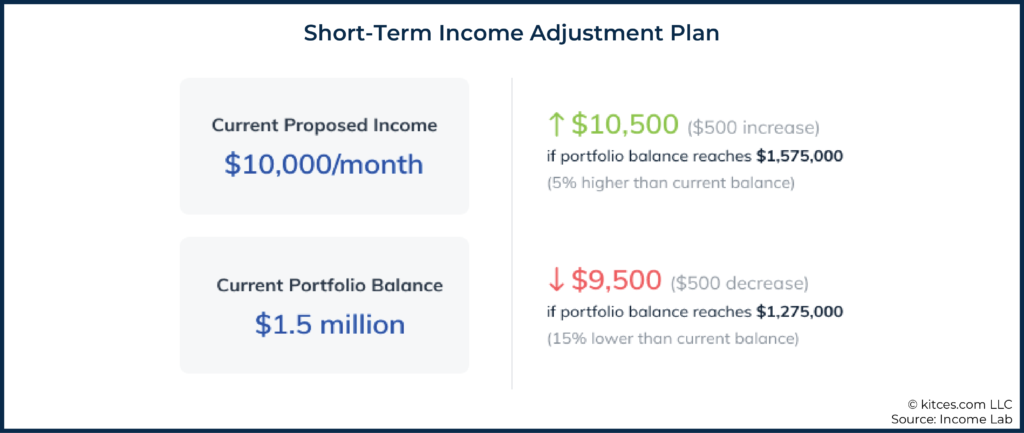
Advisor: One thing that would lead us to recommend a change is investment performance that is better or worse than expected. In the shorter term, if your portfolio balance was $1.575 million (5% more than your current $1.5 million) we would recommend an income increase of 5%, to $10,500.
On the other hand, if your retirement assets were to fall to $1.275 million (15% lower than your current balance), we’d recommend a decrease in income by 5% to $9,500.
Mr. Smith: So it sounds like an increase is more likely.
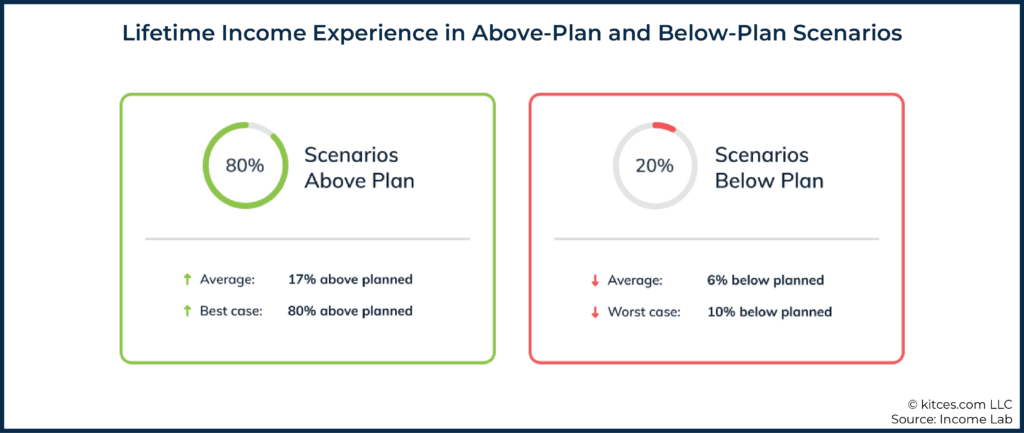
Adrian: Yes, over the longer term, we expect more upside than downside. Based on our analysis, we think that there is an 80% chance that at some point in the future we’ll recommend an increase in your income, and a 20% chance that there may be some belt-tightening in the future.
The average size of each individual adjustment (and we anticipate many adjustments over time, if for nothing other than to adjust for inflation) is about 5% either way, but we expect decreases to be much less frequent.
Mr. Smith: Well, that sounds promising. So, what are we talking about here, long term? How good or bad could things get?
Adrian: Well, of course we can’t know the future entirely, but in our analysis the average scenario where you end up with more than planned involves you spending 17% more over your lifetime than we have outlined here. The average downside scenario involves spending 6% less than planned over your lifetime. The worst case in our model involved spending 10% less than planned.
Mrs. Smith: Well, 10% less over our lifetimes isn’t perfect, but I think we could live with that if we had to. And it’s nice to know that we’ll probably end up with good news over time.
If it were framed with more common statistics, the plan discussed above would simply be another scenario with an 80% probability of success and a 20% probability of failure. But the more realistic, dynamic framing avoids “failure” language, takes adjustment seriously, and thus finds itself on the lower end of Sandman’s outrage scale.
For example, for plans that begin somewhat conservatively (like in our example above), downward income adjustments are generally infrequent and small. In other words, the risk of spending cuts is something chronic, not catastrophic. Most people have probably made such belt-tightening adjustments at some point in their lives already, so those adjustments are not “dreaded” either. In fact, they may even feel familiar and normal, and much more “controllable”.
Furthermore, if belt-tightening adjustments become necessary, households usually have a broad range of possible changes they can make. For example, rather than reducing current income, a household might reduce their legacy goal, or plans for future discretionary spending, or make changes to their investment mix. If this optionality is discussed ahead of time, it will be clear that adjustments are, in some sense, “voluntary” (not “coerced”) and “controlled by me” (not “controlled by others”).
Moreover, creating and following financial plans with adjustments for clients is, by definition, a “responsive”, not unresponsive, process. All of these factors have the virtue of decreasing outrage and, therefore, perceived risk.
The embrace of techniques like Monte Carlo simulation within financial planning has led many advisors and their clients to rely on Probability of Failure (and its complement, Probability of Success) as a central measure of plan strength, which is codified directly into most financial planning software as the primary output of the retirement planning analysis.
However, building around the Probability of Failure, and the use of the term “failure” (and related statistics to support it) may amplify emotions that Peter Sandman, in his work on risk communication in industrial contexts, dubs “outrage”. Sandman argues that outrage is a key component of risk and risk perception, and that outrage is triggered by ideas and concepts that seem catastrophic, dreaded, unresponsive, or unknowable (like financial ruin). Thus, financial advisors generally aren’t doing themselves or their clients any favors by discussing success and failure, and the all-too-common statistics that surround these potentially outrage-amplifying concepts. Instead, advisors may find Sandman’s outrage framework useful in avoiding outrage and crafting better client communications.
In particular, framing retirement paths as more “dynamic”, where changes are a frequent occurrence but in much smaller and more manageable bites, turns “risk” into something that is already familiar to most households that have had to cut back at some time or another, and in turn makes potential adjustments less dreaded, less memorable, more voluntary, and the overall plan more responsive. All of this helps to not only make the plan itself easier for clients to accept and proactively implement, but reduces the outrage component of risk (even if the objective risk of those outcomes has not substantively changed at all).
Of course, the reality is that these conversations aren’t possible (or at least, aren’t very easy) without financial planning software that can help advisors develop dynamic plans and model how adjustments could play out over a lifetime. Statistics like these can help advisors communicate possible plan experiences that are more realistic, and less outrage-amplifying, than failure-based statistics, and help advisors communicate plan results at the right level of abstraction.
In the end, Monte Carlo analysis is just a tool. The real impact comes in how the financial advisor presents the results and communicates them to the client. Ideally, this communication minimizes outrage and helps clients properly perceive the risks that may (or may not) be objectively present, in order to select the best course of action to achieve their financial planning goals.




Doesn’t this approach make much more sense than giving up your life savings ( i.e., transferring large portions of your net worth to insurance companies in return for some form of annuity payment with an IRR of close to zero) to protect against a low probability Black Swan event ?
Justin, you’ve written an interesting piece! I believe that open communication with retirees about the risks associated with the plans is essential. It will aid in gaining a better understanding of the product and all potential outcomes, both positive and negative. The honest dialogue will assist in the creation of a favorable environment in which corrective measures can be taken as needed.
Reading this article in 2023 puts into light the Outrage associated with the handling of Public Health during the Covid era. If only policymakers got out of their towers and communicated better…