Executive Summary
Financial advisory firm owners often rely on their firms' financial data to make decisions for their businesses. But the quality of that data – how it is organized and how much detail it provides about the firm's activities – can greatly affect the firm owner's ability to make good, informed decisions. The firm's Chart of Accounts is a categorized list of every type of transaction that the firm encounters and provides the foundation on which the firm's accounting and bookkeeping systems are organized. It is the key for consistent and accessible data that gives a clear picture of the firm's financial health. A good Chart of Accounts, therefore, can provide the firm owner with insightful data, enabling better decision-making about the firm's future.
The first step towards building an effective Chart of Accounts is to understand how different types of business transactions are accounted for. All business transactions can be sorted into one of five different categories: Assets, Liabilities, Equity, Income, or Expenses. These high-level categories are further divided into subcategories – the "Accounts" in the Chart of Accounts – that are specific to the individual firm's operations. Which means that firm owners have a great deal of flexibility when deciding how many (and which) Accounts should be used to track their firms' financial data.
But with the ability to build a customized Chart of Accounts comes the question of how to build one that leads to making better business decisions. A well-designed Chart of Accounts can be used to generate financial data that provides clear details about how different areas of the firm are performing and where improvements can be made. It should also make it possible to participate in (and compare with) industry benchmarking studies to evaluate the firm's performance alongside its peers, which provides another useful approach for owners to gauge their firms' financial health.
For example, by separating "Direct" expenses – those expenses involved in generating revenue for the firm, such as advisor compensation (including compensation for advisory services provided by owners themselves) – from the "Overhead" expenses of the firm's day-to-day operations, owners can glean insightful data that gives a clearer picture of the firm's profitability. For solo practices, this can even help to show whether the firm actually is profitable after accounting for the owner's work as an advisor.
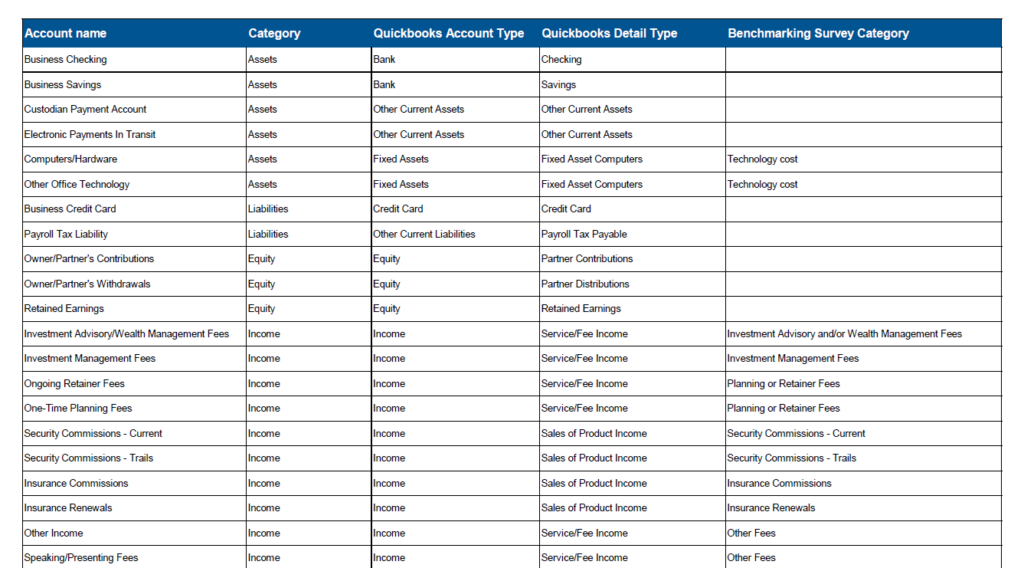
Because it takes time to build an entirely new Chart of Accounts from scratch, we've provided a downloadable template that includes standard transaction categories relevant to most advisory firms and that can be imported into the firm's accounting software. The template categories align with major industry benchmarking studies, but they can also be adapted to suit the needs of individual advisory firm owners.
Ultimately, the point of the Chart of Accounts is not just to have a system for organizing the firm's financial data, but to be able to access and use that data, to make the firm even better. And by assessing the level of organization and detail that is most relevant for the firm, firm owners can ensure that their firm's financial data will help them make the most well-informed decisions for their business!
While financial advisors are skilled at working with their clients' financial data on an everyday basis, advisors who own their own firms also need to be skilled at organizing and tracking their own firms' financial data. As aspiring CFP certificants learn in their educational curriculum, a clear picture of an individual's current financial situation is necessary in order to analyze their current course of action and make informed recommendations on how to get where they want to go. This principle is as true for advisory firms as it is for the clients that they serve.
Bookkeeping and accounting systems are what firm owners use to create this financial picture for themselves. Whether implemented by the firm owner themselves or outsourced to a third party, all firms need bookkeeping and accounting systems in order to serve two basic functions. First, they ensure that the firm has enough resources to operate on an ongoing basis. Second, they provide a way to accurately track revenue and expenses for income tax purposes. Both functions are necessary to keep firms running, so owners often have them in mind when they build their accounting systems.
But while a basic accounting system can keep the firm's lights on, a more strategic approach to the firm's financial data can give the firm owner the information they need to make the business better. It can provide more detail into the firm's financial picture so that instead of merely showing whether the firm is making or losing money, it would offer insight into why that is the case and give the owner clear direction on where to make improvements for the future. A good accounting system would also allow the owner to analyze financial data on an ongoing basis (either by consistently tracking the firm's numbers over time or by comparing itself with other firms by way of industry benchmarking studies), to clearly understand where the firm's strengths and weaknesses lie.
As the first step toward building a better accounting system, firm owners can take a closer look at how to set up their firm's chart of accounts – a list of financial categories that define the types of data the firm will track over time. The categories included in the firm's chart of accounts dictate how much information will be available for analysis in the future. Therefore, having the right Chart of Accounts – with the organization and detail to clearly gauge the firm's financial performance in the areas that matter – can give the firm owner the information they need to get their firm closer to the future they envision for it. Whether that future is making the firm more profitable, growing it to add additional advisors and staff, or selling it to a new owner, having the information needed to make informed decisions starts with a well-constructed chart of accounts.
How A Financial Advisory Firm Chart Of Accounts Is Organized
A Chart of Accounts is an accounting tool, which is essentially an organized list of categories (called "Accounts") that a business uses to keep track of its transactions. Any possible financial activities that the business can take part in – earning income, paying vendors, buying and selling property, taking out (and repaying) loans, and any other types of transactions that might happen in the life of the business – are encompassed by the categories within the Chart of Accounts.
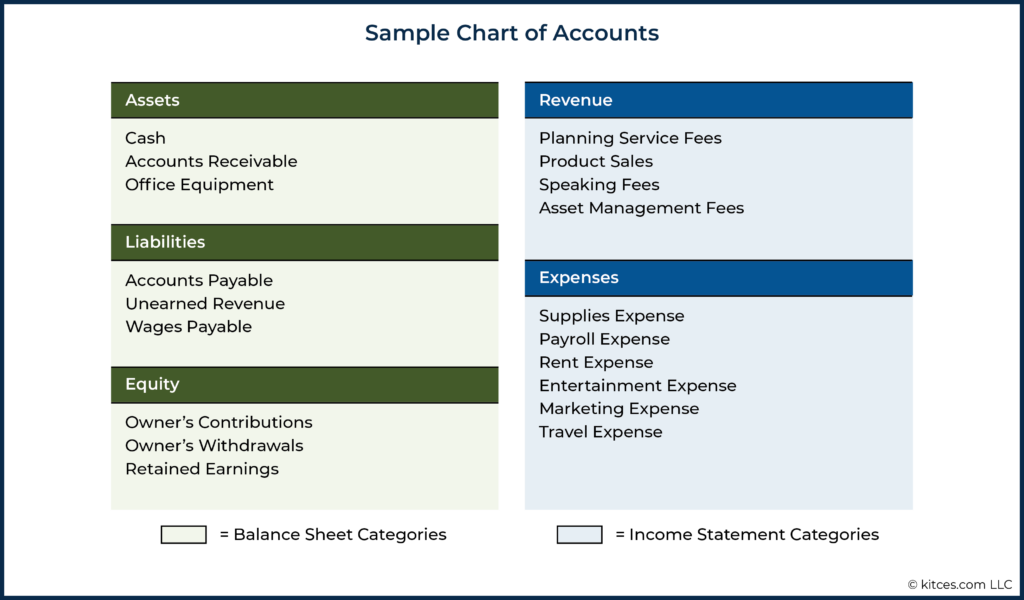
At the highest level, all of these activities can be divided into five main categories (Assets, Liabilities, Equity, Revenue, and Expenses), with each category further divided into more detailed subcategories:
Balance Sheet Categories
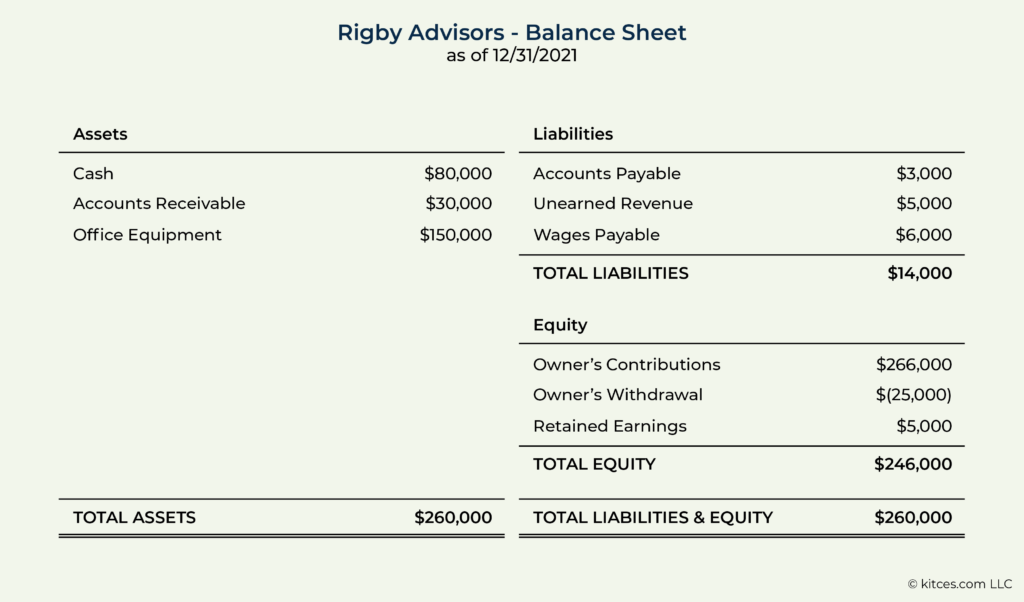
The first three categories within the Chart of Accounts (Assets, Liabilities, and Equity) are used to create the business' Balance Sheet and are therefore called "Balance Sheet Categories". As a snapshot of everything the business has at any given point in time, the Balance Sheet lists all of the firm's Assets, Liabilities, and Equities as of a specific date.
The relationship between Assets, Liabilities, and Equity is captured in the following basic accounting equation:
Accordingly, any change to any one of the Balance Sheet categories will also impact at least one of the other categories to maintain a balance between each side of the equation.
For instance, depositing a payment from a client into the business's bank account will increase Assets while also increasing Equity (by increasing the firm's retained earnings by the same amount, which balances out the other side of the equation).
Taking out a loan, on the other hand, increases Assets (by the amount the business receives as loan proceeds) and Liabilities (by the amount of debt owed), again by equal amounts to balance out both sides of the equation.
The layout of the Balance Sheet reflects the relationship between Assets, Liabilities, and Equity (and how they ultimately balance out on both sides of the Balance Sheet as they do in the equation), as shown below:
Income Statement Categories
In addition to the three Balance Sheet Categories (Assets, Liabilities, and Equity), a Chart of Accounts also includes Income and Expenses, the "Income Statement Categories" used to create a business' Income Statement.
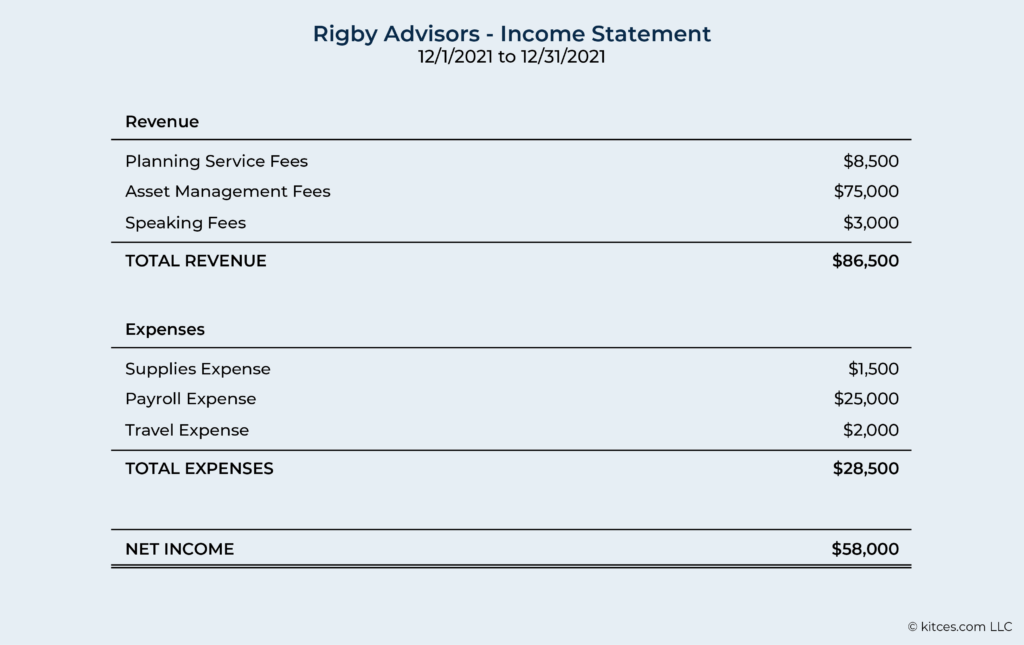
Unlike the Balance Sheet, which shows account values at an individual point in time, an Income Statement (also known as a Profit & Loss, or P&L Statement) reflects activity that happens between two points in time.
Income Statements are laid out to clearly show how expenses are subtracted from revenue to equal the business' net income (i.e., profit) over a given period of time:
Subcategories Allow Similar Transactions To Be Combined
The main categories found on a Balance Sheet (Assets, Liabilities, and Equity) and Income Statement (Revenue and Expense) are universal to all businesses that use standard methods of accounting and are useful for understanding a business' financial picture at a high level. However, these broad categories are only useful up to a certain point.
For instance, knowing a business' overall Revenue and Expenses can help determine whether or not the business is profitable (since profit, at its basic level, is simply income minus expenses), but by themselves, they do little to reveal why this is the case. Is one line of revenue particularly successful compared with the others? Do the firm's expenses primarily go toward compensating the advisors who generate the firm's revenue or paying the firm's operating costs? Does the firm's investment in marketing actually translate into higher sales and profitability? It's impossible to answer these questions by knowing only a business's total revenue and expenses without further detail about the components that make them up.
The question of why a business is (or is not) currently profitable is essential for making decisions that can make it more profitable in the future. Firm owners typically want to put their time and money into the projects that will maximize their firm's future profitability. But in order to do that, it is necessary to understand what is (or is not) working now, so the owner can allocate the firm's resources in more profitable ways. This requires understanding the firm's financial picture at a deeper level.
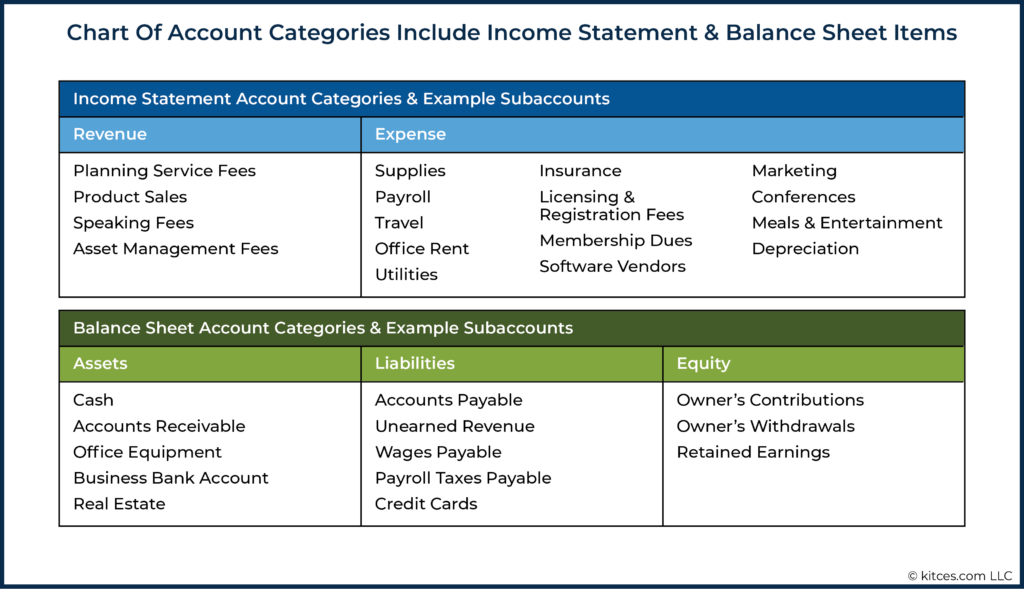
To provide additional depth, the Chart of Accounts divides each of the five main Balance Sheet and Income Statement categories into subcategories (which are typically called "accounts" or "subaccounts"). These accounts are customized for each individual business and tailored to that business's activities. The result is a list of accounts under each main category (Assets, Liabilities, Equity, Income, and Expenses) that encompasses every type of transaction that the business makes.
Unlike the five main Balance Sheet and Income Statement categories, which are universal across all businesses, there is no standard list of accounts that falls under each main category. Each business has its own unique types of revenue and expenses and its own priorities for reporting and analyzing its financial data.
For example, a large corporation with many lines of business may have thousands of accounts and subcategories, while a small and relatively simple firm (like a solo RIA) may have several dozen or fewer. The number of accounts, and the granularity with which transactions are grouped together, depends on both the size and complexity of the business, and the detail with which it wants to track its financial data.
What all Charts of Accounts do have in common, however, is that they allow for every transaction made by the business to be recorded under a specific Account. To create a financial statement, individual transactions are added together under appropriate Accounts, which are combined with other Accounts to add up to the higher-level Account category, which in turn rolls up into the Balance Sheet or Income Statement. Which means that it is only possible to have accurate financial statements if every transaction is recorded under the correct Accounts that feed into those statements.
The Accounts included in a Chart of Accounts, therefore, need to encompass all of the transaction types that a business encounters; otherwise, the reports generated from the business' transaction data would fail to show a complete picture of the business's overall financial health.
Creating The "Right" Chart Of Accounts For Financial Advisors
All advisory firm owners – at least those who use accounting software like Quickbooks – use a Chart of Accounts in their business. Most software programs include a default Chart of Accounts with general categories of income and expenses (which may be adequate for newer owners setting up and maintaining their businesses), but they often lack the level of organization and detail that is required to improve a growing business.
Many accounting software programs are designed to easily feed expense data into fields on a tax return. That is fine when it comes to quickly completing a tax return, but firm owners who have other goals in mind – like making their firms more profitable, adding employees, or selling the firm – need a more detailed Chart of Accounts that specifically reflects those goals. Achieving any goal as a firm owner requires having a way to measure progress toward that goal, and the Chart of Accounts will dictate what type of data will be available to the firm owner to make those measurements.
One way to gauge progress is through Key Performance Indicators (KPIs), metrics that can offer insight into a firm's financial health and help managers to recognize (and fix) problems when they occur. They can include firmwide numbers like Gross Profit Margin and Operating Profit Margin, revenue productivity metrics like Revenue Per Client and Revenue Per Advisor, and marketing metrics like Client Acquisition Cost, among many others, depending on the firm owner's goals. A proper Chart of Accounts will provide the right information – in the right level of detail – for a firm owner to accurately calculate and track the KPIs that will help them make progress toward their goals.
Separating An RIA's Direct And Operating Expenses
No matter what the firm owner's ultimate goal is – whether it's to run a successful lifestyle practice, build a large advisory firm with many employees, or eventually put the firm up for sale – profitability is one of the key factors towards achieving those goals. Beyond being just the bottom-line income paid out to the owner, profitability also factors into many of the firm owner's other potential concerns, such as how well the firm can sustain an economic downturn or how much it would be valued for a sale.
But for firm owners who also serve the firm's clients as advisors (like solo RIA owners often do), determining an advisory firm's profitability is not as simple as just subtracting total expenses from total revenue. This is because the compensation that an owner/advisor receives generally has two components: their compensation for the job of servicing and advising clients, and their compensation for owning a profitable advisory firm. If the firm's total profits are not greater than what it would cost to hire another advisor to serve the firm's clients, then the firm can't really be considered profitable.
To accurately gauge profitability, then, it is necessary for firms to specifically track their "Direct" expenses, which are those expenses involved in generating revenue, such as advisor compensation.
Nerd Note:
Recording the owner's advisor compensation as a direct expense is done solely for the purpose of tracking the firm's economic profitability. For tax purposes, if the firm is taxed as a sole proprietorship, payments to the firm's owner are not treated as an expense… meaning the Direct expense for owner's compensation would need to be added back to the firm's gross revenues to correctly calculate its taxable profits.
But many firms run by sole practitioners do not track their owners' compensation as a Direct expense, simply considering it as part of the firm's net profit –which can end out skewing the firm's real profitability numbers, as in the example below:
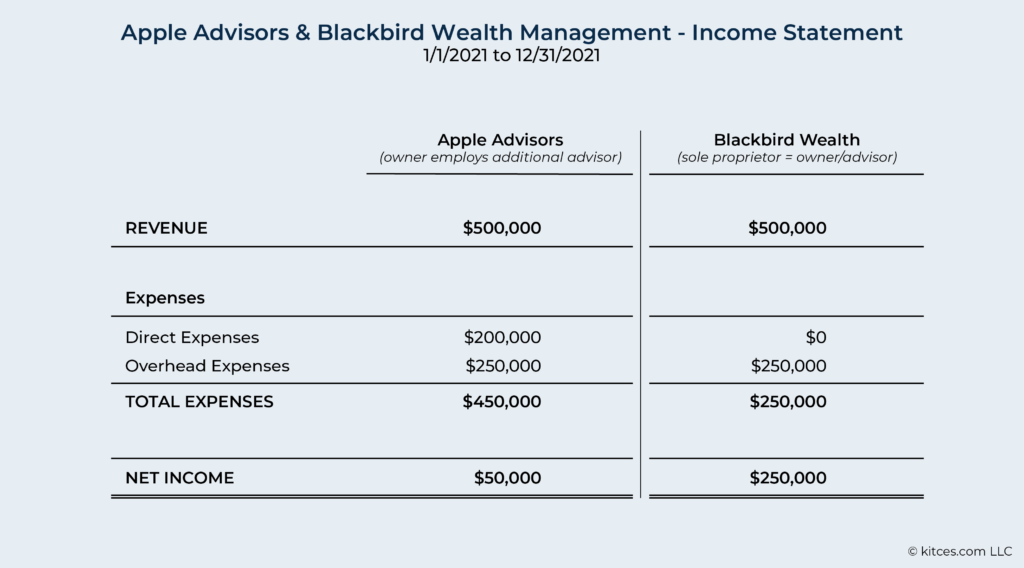
Example 1: Apple Advisors and Blackbird Wealth Management both had $500,000 in revenue and $250,000 in overhead expenses last year.
Apple employs an advisor who is paid a salary of $200,000 per year, while Blackbird is owned by a sole proprietor who also performs all of the firm's advisory services.
Their respective income statements are as follows:
On the surface, it might appear that Blackbird is more profitable than Apple since, after subtracting all expenses, Blackbird appears to have $250,000 in operating profit, while Apple only has $50,000.
However, the $200,000 difference between the two firms' profits is solely due to the fact that Blackbird pays a salary to an advisor. Apple's owner does not take a salary but instead is 'paid' through the firm's profits.
If Blackbird needed to hire an employee to perform the advisory services the owner currently performs herself, the profits she would realize in her capacity as just a firm owner would be much less than the $250,000 she currently realizes as both an owner and an advisor.
Thus, to calculate Blackbird's 'true' profitability, the owner needs to first account for the Direct Expense that would include compensation she receives as an advisor. If her compensation is $200,000, comparable to that of the advisor at Apple, then Blackbird's operating profit would also be $50,000, identical to Apple's profitability.
An advisory firm's Chart of Accounts, therefore, should include categories not only for the common Overhead expenses (e.g., office space, utilities, marketing, etc.), but also for the Direct Expenses that include advisor compensation. This is true whether the firm hires advisors as salaried employees or is owned by a solo advisor who compensates themselves from the firm's profits.
Nerd Note:
Some of the terms used in this section are standard terms used to analyze and value advisory firms. Though they may not be used on a daily basis, it's good for advisors to be familiar with the following terms:
- Direct Expenses: The actual costs of generating revenue for the firm (i.e., advisor compensation, including owners)
- Overhead Expenses: The costs of running the firm itself, e.g., office expenses, compensation of (non-advisor) support staff, marketing, and technology
- Gross Profit: The firm's revenue minus its direct expenses, representing what is left over to pay the expenses of running the firm (with anything left over being profit to the firm's owners)
- Earnings Before Owner Compensation (EBOC): The firm's revenue minus its overhead expenses, representing the firm's profits independent of what the owner pays themselves.
- Operating Profit: The firm's net income after subtracting both direct and indirect expenses, representing the firm's overall profitability.
The Right Level Of Detail For A Chart Of Accounts
When building a Chart of Accounts, firm owners need to decide how detailed (or how general) they want their firm's financial data to be. For instance, is a single "Marketing" account for all of the firm's marketing expenses sufficient? Or should those costs be divided further into accounts for Paid Advertising, Website Design, Video Production, etc.?
Firm owners each have individual preferences, so they need a framework for building their Chart of Accounts that helps them decide which items to track individually and which to group with others. This framework depends on the areas of the firm the owner wants to scrutinize, which data can provide insight into those areas, and how the data can inform the owner to take action to make their firm better. An additional consideration is that the accounting categories should align with the types of business expenses found on the business' (or the business owners') tax returns. Accordingly, a well-designed Chart of Accounts should have categories that can easily map to those on Schedule C (for sole proprietors), Form 1065 (for partnerships), or Form 1120-S (for S corporation owners).
Beyond facilitating expense reporting for tax purposes, a firm's Chart of Accounts should be set up with the right level of detail to keep different types of expenses that owners want to track from being commingled with other expense categories. For example, having Payroll and Marketing Costs recorded in the same Account would make it difficult for the firm owner to gain much insight into either category. At the same time, there should not be so many Accounts that it becomes cumbersome to keep track of them all. A Chart of Accounts at a large corporation may require codes and spreadsheets for its bookkeepers to stay on top of, but a small- or medium-sized advisory firm's Chart of Accounts should be easily manageable for one person to maintain.
There isn't one 'right' number of accounts for any firm; some owners may want to drill down into several granular expense categories, while others would rather remain at a comparatively high level with fewer Accounts to track. If the firm owner realizes that they want more or less detail than their current Chart of Accounts provides, it is always possible to change it – though that usually requires re-categorizing older transactions to match the firm's new system in order to maintain continuity. To that end, it's worth keeping in mind that it is generally easier to go from more detail to less than the other way around, so it's usually better to start with more Accounts and then combine them if needed.
How To Build A Useful Chart Of Accounts For Financial Advisors And Implement It In Your Business
Chart Of Accounts Template For Solo Or Small Practice Financial Advisory Firms
Though every firm is different in its needs and preferences for how its Chart of Accounts is organized, creating an entire Chart of Accounts from scratch can be a time-consuming endeavor. Accordingly, this template Chart of Accounts can be helpful for advisory firm owners to download, adapt, and implement for their own firms.
Download links: Chart of Accounts Template (Excel & PDF)
The template includes Accounts that should be relevant to most small advisory firms (fewer than 10 employees). The categories also align with the InvestmentNews Pricing & Profitability Study, a major research report published annually on the financial performance of advisory firms, which will allow for firms to compare their own performance with other reported industry benchmarks.
Adapting And Importing The Chart Of Accounts Template
Because QuickBooks is the most popular accounting software for small- and medium-sized firms, the downloadable template (provided above) includes the specific categories and detail types that are used in Quickbooks; however, the template can easily be adapted to use with other accounting and bookkeeping systems like Xero, Freshbooks, and Wave. Also included are the benchmarking survey categories that each income and expense account would correspond to.
To use the template, compare the Accounts (listed in Column A) with the types of assets, liabilities, income, and expenses typically encountered by the firm. Firm owners can then add or delete any rows to customize the list as needed. For example, if the firm has a fee-only business model and does not accept compensation from commissions, the Security Commissions and Insurance Commissions accounts would not be necessary.
However, it is important to keep in mind that while some Accounts may not seem relevant today, they could be used in the future. For example, a firm that is a solo advisory practice may currently have no need for the "Compensation – Administrative/Support Staff" Account – but if the owner plans to hire support staff in the future, that Account may still be relevant. It is easier to delete unused Accounts than it is to add in new ones (or to recover deleted ones), so it is generally better to include any Accounts that could potentially be used in the future.
Once the Chart of Accounts has been adapted to suit the advisory firm's needs, it can then be imported into the firm's accounting software program.
Nerd Note:
Some accounting software includes an optional field for account numbers. Account numbers are often used in large organizations with multiple divisions to make it easier to locate specific accounts among hundreds or thousands of options. For smaller firms, though, it is often easier to locate an account by name than by remembering its number, so account numbers are optional for all but the nerdiest firm owners.
Implementing And Using The Chart Of Accounts
Implementing a new bookkeeping system often requires extra effort in the early stages to ensure that transactions are correctly categorized. After all, it's possible that the new system requires categorizing or thinking about transactions in different ways than what the firm owner has grown accustomed to. Each transaction entry should clearly show the source and destination of the money involved (keeping both sides of the accounting equation in balance), but in practice, bookkeeping isn't always quite that straightforward. Some transactions may require multiple steps to capture accurately. Other transactions may not involve any actual cash movement, but simply require money to be moved from one accounting category to another.
Keeping on top of everything takes time and mental resources, and some advisors would rather outsource bookkeeping to a third party to be able to use those resources elsewhere. But regardless of whether they outsource the task of bookkeeping to a third party or do it themselves, it's a good idea for firm owners to have a grasp of foundational bookkeeping and accounting principles, which will make it easier to understand (and make better use of) their firms' financial data.
For firm owners implementing their own Chart of Accounts, some potential areas that may require extra consideration are listed below.
Income & Assets – Recording Electronic Payments In Transit
The Chart of Accounts template includes assets such as business bank accounts and custodian accounts where an advisor's asset-based fees may be collected, but in addition to these assets, it also includes an "Electronic Payments In Transit" Account. This is included because electronic payment processors like AdvicePay, which handle payments from clients who pay via bank or credit card, usually deduct a fee for each transaction (often ranging from 1% to 3.5%, depending on the processor and type of payment) before depositing it into the firm's bank account.
Even though firm owners may only notice the portion of their income that is deposited into their bank account after the payment processor's fee has been deducted, the firm's true revenue is the amount that the client actually pays before the processor's fee. Recording the after-fee amount as income would result in under-representing the firm's actual income by the amount of the online payment processor's fees (anywhere from 1%–3.5%).
In order to correctly reflect the revenue from the client and the fee to the payment processor, it is necessary to record a multi-step transaction, as outlined below, using the appropriate accounts in order to keep the basic accounting equation (Assets = Liabilities + Equity) in balance.
- When a client pays their fee, record the total amount as income (e.g., in the "Ongoing Retainer Fees" or "One-Time Planning Fees" Income Account) and increase the "Electronic Payments In Transit" Asset Account by the same amount.
- When the payment processor deducts their fee (which typically occurs instantaneously with the payment from the client), record the fee as an expense in the "Merchant Account/Payment Processing Fees" Expense Account, and decrease the "Electronic Payments In Transit" account by the same amount as the fee.
- The net payment (the total payment received from the client, minus the payment processing fee) is recorded as a transfer from the Electronic Payments In Transit account to the appropriate income account (e.g., Business Checking).
Liabilities – Recording Payroll Tax Liability
Liabilities tend to be thought of in terms of the debt a firm takes on – for instance, using a business credit card, obtaining a mortgage to buy office space, or taking out a loan to buy a partner's share in the firm. But if the firm has W-2 wage employees, the payroll taxes due for those employees (before they are paid to the government) also need to be recorded as a liability. Doing this correctly also requires a multi-step transaction:
- Each time an employee is paid, that employee's gross wages and benefits are recorded as an expense (e.g., in the "Compensation – Administrative/Support Staff" Expense Account), while decreasing the employer's "Business Checking" Asset Account by the same amount.
- At the same time the employee is paid, the payroll taxes owed for that employee (including Federal and State income, Social Security, Medicare, and Federal Unemployment Tax) are recorded as an expense in the "Payroll Taxes" Expense Account, increasing the "Payroll Tax Liability" Account (many third-party payroll processors can import these transactions automatically into the firm's bookkeeping software).
- When the business pays the payroll taxes to the government, another journal entry is set up to reduce both the Payroll Tax Liability account and the business bank account that the taxes were paid from by the amount of payroll tax that was paid.
Nerd Note:
Different accounting and payroll software may have slightly different processes for recording payroll expenses and taxes. The software's Help page should include specific instructions for setting up these entries.
Equity Transactions
Unlike asset and liability accounts, which can go up or down in value as funds are deposited and withdrawn, the Owner Contribution and Owner Withdrawal categories only increase in value. This is so the owner can keep track of how much they have cumulatively contributed to and withdrawn from the business over time.
When the owner contributes money to the business, the transaction is recorded as an increase to both the "Owner Contributions" Equity Account and the "Business Checking" Asset Account that the money is transferred into.
Conversely, if the owner withdraws money from the business, it is recorded as an increase to the "Owner Withdrawals" Equity Account, along with a decrease to the "Business Checking" Asset Account.
The Retained Earnings Equity account generally does not need to be updated manually in accounting software; it will increase automatically if the firm is profitable (or decrease if it is unprofitable). This is because the firm's total equity must equal the owner's total contributions minus the owner's total withdrawals plus retained earnings, at all times:
Direct Expenses And Net Income
The downloadable Chart of Accounts template provided above includes accounts for Direct Expenses (e.g., "Advisor Compensation" and "Advisor Bonus") and accounts for Overhead Expenses, enabling the firm owner to separate the costs of generating the firm's revenue (Direct Expenses) from those of running the firm (Overhead).
Advisory firm owners who do not take a paycheck from their firm (and who instead rely on the firm's profits to pay themselves) may find it difficult to grasp the separation between their compensation as an advisor – the Direct Expense – and their net profit earned as a business owner. After all, recording the advisor compensation portion as a Direct Expense does not change the actual cash flow of the firm or how the firm owner pays themselves – it is only a shift of numbers from one accounting category to another. Furthermore, the firm owner's advisor compensation (which is considered to be equivalent to the fair market value of the advisory services they perform for the firm) may not equal the amount they actually withdraw from the firm each year.
Fortunately, the fact that there is no effect on cash flow means that recording advisor compensation for the firm's owner does not need to correspond with when withdrawals are actually made from the firm.
The simplest method of recording compensation may be to make a single Expense entry on the final day of the financial year reflecting the owner's entire annual advisor compensation. This would involve recording only one transaction to separate the advisor compensation from the firm's profits.
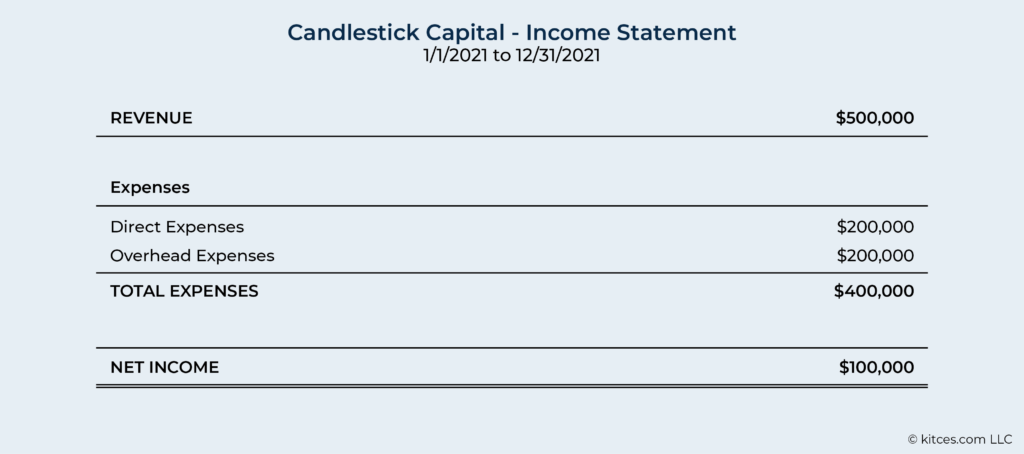
Example 2: Candlestick Capital is a solo advisory practice. The firm has $500,000 in revenue and $200,000 in overhead expenses for the year, leaving $500,000 – $200,000 = $300,000 in profits before accounting for advisor compensation.
Candlestick's owner calculates that his advisory services are worth $200,000 to the firm. At the end of the year, he records this by increasing the "Owner Compensation" Account by $200,000 and reducing the "Owner's Equity" Account by the same amount.
The firm's Income Statement at the end of the year will read as follows:
The method may also be preferable for firms who have no 'true' profits beyond the advisor compensation of the owner, since the advisor's compensation would simply be equal to the firm's net income before accounting for the compensation, which would not be known until the end of the firm's financial year when all income and expenses have been recorded).
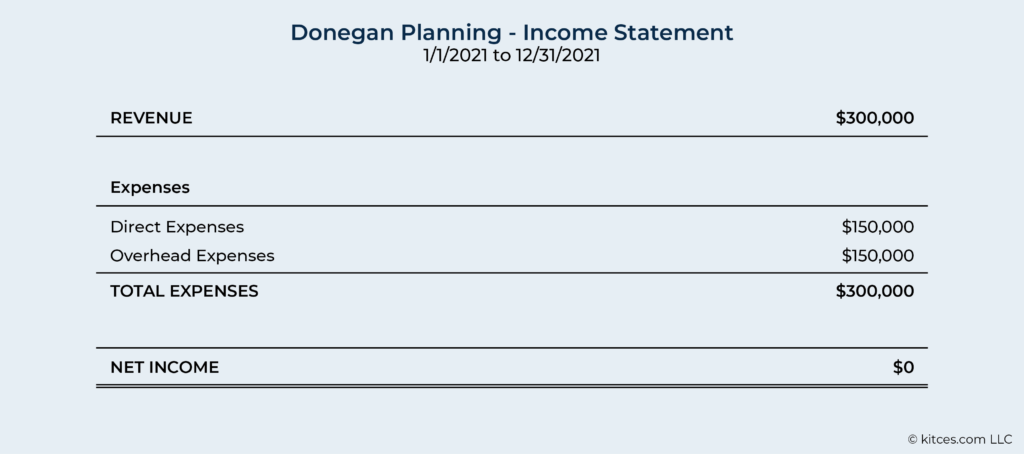
Example 3: Donegan Planning is a solo advisory practice. The firm has $300,000 in revenue and $150,000 in overhead expenses for the year, leaving $300,000 - $150,000 = $150,000 in profits before accounting for advisor compensation.
As in the previous example, the fair market value of the advisory services of Donegan's owner is $200,000. But there are only $150,000 of profits to allocate, meaning that 100% of the firm's profits should be categorized as advisor compensation, which is recorded at the end of the year, as follows:
Other firms may wish to track their profit and losses more frequently (e.g., quarterly) and may therefore prefer recording the owner's advisor compensation in more frequent installments. As long as the advisor's total annual compensation adds up to the fair market value (i.e., the amount the firm would pay another advisor to do the owner's advisory work), the owner's advisor compensation can be recorded in as few or as many installments as desired.
Transitioning From A Previous Chart Of Accounts
Existing firms that choose to implement a new system of accounting, such as a new (or updated) chart of accounts, will need to consider when to make the transition from their previous system to the new one. Because the new system may categorize and present financial data differently, it may be difficult to make comparisons between periods before and after changing systems.
The only real way to enable a comparison between past and future transactions when introducing a different system of accounting would be to re-categorize past transactions under the new system… and the labor involved in doing this work may not be worth the potential benefits from doing so. It may be better instead to start fresh, using the transition date as a starting point to make future comparisons. Implementing a new system at the beginning of a firm's financial year can provide a clean transition for the firm to start a new reporting period.
Though the ability to compare the firm's financial data with itself over time may be limited until it has used the system long enough to enable point-to-point comparison, a new accounting system using a well-designed chart of accounts will provide immediate value from its ability to clearly compare with industry benchmarking studies, and eventually will also be a source of consistent data with which to gauge the firm's performance over time.
Because the Chart of Accounts dictates how all of a firm's financial transactions will be organized and the level of detail they will be categorized with, it is the foundation for all of the firm's financial data that will be available to the firm owner.
But simply organizing the data is not in itself the end goal. What matters even more is how the data can be used as a tool to create a better and more profitable business. By carefully considering how the Chart of Accounts (and the information it provides) can best serve to organize their firm's business transactions, owners can easily adapt their financial data to their particular processes and technology tools to create insightful financial statements that are most relevant for their firm and business goals.
With the end of the year just ahead, it is a good time for firm owners to review what is (or may not be) working in the business, and to consider whether there may be better ways to organize their firm's financial data, managed either by the firm owner themselves or outsourced to a third party. Because having an organized system of managing financial data is a key factor to making good, well-informed business decisions!


