Executive Summary
Saving and accumulating for retirement takes decades. As a result, most people will spend a very long time working towards the goal with only small, incremental progress along the way. And it can be very hard to stay focused and motivated to achieve a long-term goal when there’s no sense of progress.
Fortunately, the most straightforward indicator of forward progression is simply to see a retirement account balance that grows over time. But the challenge is that just viewing the balance gives no context to where it stands relative to the retirement goal being pursued. It’s just an abstract number.
An increasingly popular strategy to give context to the progress of saving towards a (retirement) goal is the funded ratio – where the current account value is presented as a percentage of the total savings necessary to achieve the goal (or at least, be on track for the goal with an assumed growth rate).
The virtue of the funded ratio is that it takes an abstract account balance and relates it directly to a goal or outcome, and can give savers a sense of accomplishment as the percentage slowly and steadily climbs towards 100%. The bad news, though, is that once account balances grow large, the funded ratio itself can become highly volatile as markets move up and down, and the discount rate used to calculate the funded ratio can unwittingly turn into an indirect absolute return benchmark that is difficult to keep up with.
Unfortunately, the sensitivity to assumptions means the funded ratio can ultimately be just as problematic as many other approaches to quantify investment results and progress towards goals. Nonetheless, the rising focus on trying to benchmark portfolios against the goals they’re meant to achieve means it may become an increasingly popular approach in the coming years, notwithstanding its flaws!
Calculating A Funded Ratio For Your Individual Retirement Goal
A funded ratio is a way of calculating progress towards a goal. In the simplest case, the funded ratio is simply a fraction, where the numerator is the current value of assets, and the denominator is the goal you’re trying to achieve. As progress is made towards the goal, the funded ratio rises. When the funded ratio reaches 100%, the goal has been achieved (or at least, is fully on track to be achieved).
Example 1. Eric and Jennifer have a retirement goal of accumulating $1,000,000 in savings, which on top of Social Security will allow them to live their desired standard of living in retirement. The couple current has about $350,000 saved in their retirement accounts. As a result, their funded ratio is $350,000 = $1,000,000 = 35%.
As the couple in the example above makes ongoing contributions over time, increasing the account balance, the funded ratio will rise. In fact, even if no contributions are made, this funded ratio should still rise over time, simply given the growth in the portfolio itself.
The virtue of this approach, though, is that instead of talking in terms of abstract dollars – which don’t directly relate to a goal – the funded ratio gives a concrete sense of progress. Particularly since in practice, most people’s goals – or at least, the required account balance to fund their goals – aren’t easily conducive to calculating progress. While it might be relatively straightforward to figure out that $350,000 out of a $1,000,000 goal is 35% progress, most people can’t calculate in their head that if their retirement goal is actually $1.35M, that it takes about $475,000 to get to the same 35% funded ratio.
In addition, the funded ratio also helps put market volatility into context. It moves away from just looking at the dollar magnitude of a bear market decline, or the percentage drawdown, and instead relates it back directly to the goal.
Example 2. Continuing the prior example, if next year there’s a 20% bear market, Eric and Jennifer’s account balance would fall to $280,000. If they were each “just” contributing the maximum $18,000/year (in 2017) contribution limit for the year, it may feel very scary to “lose” $70,000 when they’re only able to save $36,000/year. However, as a funded ratio, the couple has “merely” fallen from being 35% funded to 28% funded, which may feel far less daunting of a setback to recover from.
The Problem With A Retirement Goal’s Funded Ratio
Unfortunately, though, there’s a significant problem with the straightforward approach of calculating a retirement goal funded ratio by simply dividing current assets into the goal – the path of progress to the goal doesn’t occur in a straight line.
For instance, imagine someone wants to accumulate $1,000,000 for retirement in 40 years. Assuming an 8% return on a fairly aggressive portfolio (given the 40-year time horizon), the individual would have to save about $300/month to achieve the goal. Even though the cumulative savings over the 40-year time period will be only $144,000, this “works” because of the magic of compounding growth over an extended period of time.
However, the caveat is that it takes quite a while for the compounding to really begin to work its magic. As a result, while $300/month at 8% is sufficient to fully fund 100% of a $1,000,000 retirement savings goal in 40 years, it takes a whopping 23 years just to fund the first 25%. Then it takes about 8 more years to fund the next 25%. From there, compounding really kicks in, and it takes only 5 years to cover the third 25%, and a mere 3 years to achieve the last 25% of the goal.
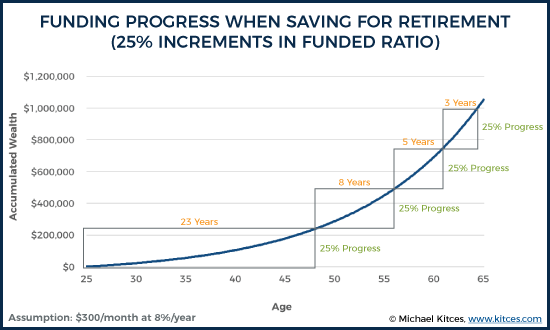
In other words, the problem with just looking at the progress of savings towards a retirement goal is that in the early years, the contributions alone have to do all the heavy lifting. It’s only in the later years that the compounding really kicks in to carry through to the end. Which ironically means someone who is 100% “on track” for the 40-year goal will still not even be half way there after 30 years!
Yet most people won’t realize that being 50% of the way to the 40-year goal after 30 years actually is on track, and there’s nothing in a funded ratio that communicates this is a “normal” way to progress towards retirement! In fact, having such a long-term “goal” that makes so little progress for decades can actually become demotivating for retirement saving!
Future Growth Assumptions And The “True” Funded Ratio For Retirement
The fundamental challenge to the simple Retirement Goal Funded Ratio is that it fails to account for the anticipation of future growth, and how much time is available for that growth to occur.
In the context of pension plans – where the funded ratio originated as a way to calculate whether the pension account had sufficient assets to cover its future liabilities – this is resolved by adjusting the denominator of the funded ratio. Instead of simply inputting “the goal”, instead the bottom half of the funded ratio is the present value of any/all future liabilities (where the “liabilities” are the cash flows that the goal represents).
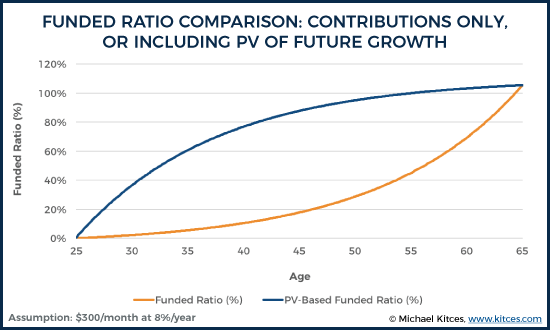
The virtue of calculating a funded ratio using not just the goal, but the present value of the goal, is that doing so implicitly recognizes that if the money isn’t actually needed until the future, it will have time to grow until it’s used. Which means it’s actually possible to be “on track” for 100% funding, even though 100% of the goal isn’t currently funded, because there’s enough to grow to the goal by the time the end date (e.g., retirement) is reached.
Thus, continuing the earlier example, a couple that has accumulated $250,000 already after 20 years, and is still saving $300/month towards retirement (and is still growing at 8%) may only be 25% of the way to the goal, but would actually have 123% of the funding needed to reach a $1,000,000 goal in 20 years. In other words, the present value of a $1,000,000 goal 20 years from now is only $202,971 (assuming that 8% growth rate compounded monthly), which means already having $250,000 (and still saving $300/month on top) is more than enough to be on track for the goal.
The key distinction: a funded ratio that adjusts for the time value of money is no longer actually calculating the progress towards the goal, per se, but instead is calculating whether the individual is on track for the goal given future growth assumptions.
The Funded Ratio As An Absolute Return Portfolio Benchmark?
However, the challenge to calculating the funded ratio as a present value of future liabilities is that it’s highly sensitive to the discount rate – i.e., the assumed future growth rate – that is used. As a result, a retirement projection can show itself as being on track, materially underfunded, or dramatically overfunded, simply by changing the long-term growth rate assumptions.
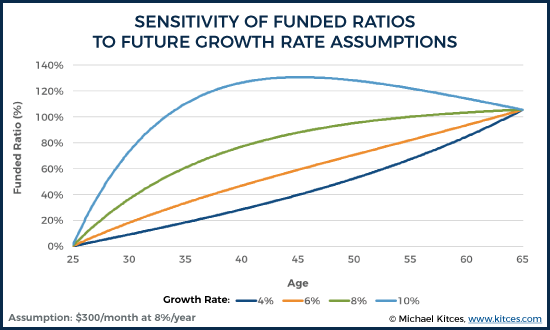
As the chart above illustrates, if the client sticks with the original goal of an 8% return and $300/month savings, the goal is still fully funded in the end. But lower growth assumptions make it appear as though he/she isn’t saving enough – only to get “surprised” with good returns later. While the higher growth assumptions make it appear as though he/she is saving too much, only to find that later returns disappoint and they’re not over-funded after all.
Along the way, though, these kinds of assumption changes can be “dangerous”. For instance, if the prospective retiree continues to assume 8% returns, but actually gets only 7% returns, retirement appears to be on track early on… until it falters in the middle and loses momentum, and never actually closes the gap even though the saver continues to save and the portfolio continues to grow!
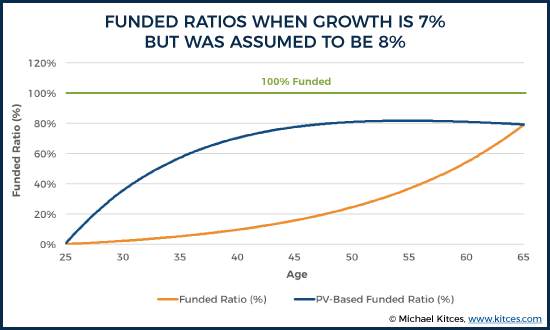
Unfortunately, as the chart above illustrates, if growth rate assumptions are overly optimistic, it makes the funded ratio seems to make early progress… right up until it doesn't, and it turns out that the retirement date is no longer feasible after all as the shortfall gap never closes. In fact, a substantial challenge of the whole approach is that the higher the growth rate, the easier it is to make the funded ratio look good, but the riskier it actually is to hit that retirement date, given the volatility that higher growth rates entail (which isn’t captured in a funded ratio).
In other words, calculating a funded ratio that is the present value of future liabilities at a specified discount code is basically the equivalent of creating an absolute return benchmark out of that discount rate, and any year the actual portfolio (plus new contributions) underperforms, the funded ratio will decline!
From the perspective of managing retiree expectations, this can be a substantial issue. After all, it’s long been observed amongst financial advisors that in a bear market, clients tend to benchmark results to cash (i.e., maintaining principal and not losing any money). But with a funded ratio approach, the situation is even worse, as the portfolio is now effectively benchmarked to a straight-line 7% (or some other) absolute return!
Thus, over time as the impact of growth and compounding increasingly control the outcome, the funded ratio basically becomes an “on-track for absolute return benchmark” ratio! And with real-world volatility, this can actually cause an astonishing level of volatility in the funded ratio itself!
For instance, the chart below shows the funded ratio progress for someone who in 1997 was hoping to retire in 20 years (in 2017), and at the time had $180,000, which would indicated being 75% funded for a retirement goal of $1,000,000 in 2017 as long as they kept saving at least $300/month and grew at 8% on a balanced portfolio (which, at the time, would have been a relatively conservative assumption for growth on a balanced portfolio!). Yet we can see what actually happened to their progress on a 60/40 portfolio based on the funded ratio!
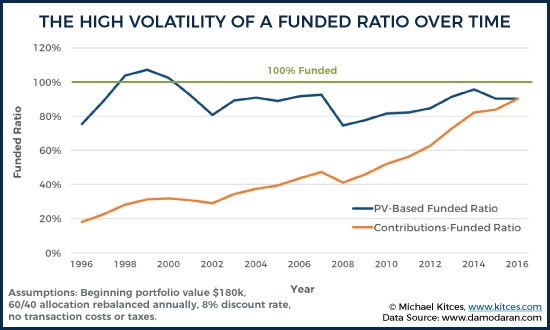
As the chart reveals, the run-up in the markets quickly led this saver to be "overfunded" (on a PV-based funded ratio) - as though he/she could even stop saving by 1999... only to fall behind again with the subsequent bear market, and then never actually close the gap (even when the saving continued!)! While the contributions-based funded ratio showed steady progress... that still never quite achieved the goal!
Or stated more simply - the saver's progress on the funded ratio was never actually a particularly effective indicator of whether they were on track, and because markets are so volatile, any changes to savings behavior to try to adjust for "fundedness" would have likely just ended out over-compensating for volatility in each direction! Because ultimately, the funded ratio really ended out reflecting nothing more than whether the saver was on track for achieving an annual absolute-return portfolio goal (which obviously isn't realistic!)!
Is The Funded Ratio A Viable Metric For Tracking Individual Retirement Goals?
So given these challenges to the funded ratio, is there a viable alternative? Unfortunately, the alternatives – like the “traditional” approach of simply showing accounts and how they’re growing over time – clearly have their own problems, as all advisors experience from day to day and year to year in counseling clients through market volatility! Though there are some creative new proposals lately, such as converting retirement accounts into future retirement income, to give people a better sense of how their retirement account progress translates into an actual future standard of living.
Notwithstanding the challenges to the funded ratio, though, it’s worth noting that the approach does have some significant positives as well.
First and foremost, it does help people get away from being overly focused on dollars and account balances, which clearly has its own issues. As noted earlier, a person within 10 years remaining to retirement should have less than half their retirement account balance if they’re “on track”, and may feel very far behind just looking at their account balance alone… but can see they may actually be 100% on track with a funded ratio (at least, one that accounts for the time value of money).
Second, the funded ratio can help to automatically recognize when changes in standard of living are shifting the progress towards the goal. For instance, people who get raises but also lift their expenses and have “lifestyle creep” can start to veer further and further off track even though their account balance is rising. Because their retirement needs are actually rising even faster than their retirement accounts. Which, unfortunately, is not evident if the prospective retiree is just watching the account balance grow. But it will be noticeable if retirement progress is tracking using a funded ratio, where the amount needed to be fully funded keeps going up (as higher spending means a larger liability to fund that future spending)!
Still, the challenge remains that a goal-based funded ratio isn’t really any different than just showing an account balance and how it’s tracking relative to the goal, and a true discounted-present-value funded ratio can quickly become an “absolute return benchmark” taskmaster that, once falling behind, gets harder and harder to catch up. Of course, it’s always possible to update and adjust a goal as well, if the funded ratio is persistently off track. And individuals at least have more flexibility to adjust their goals, unlike many pension plans that had unrealistically high return assumptions to calculate their funded ratios, and the mediocre returns since 2000 have caused them to just lag and lag more and more.
However, at the point that the funded ratio just gets changed every few years with a “plan update” that alters the final goal, it’s not entirely clear how useful of a tracking mechanism it even is. After all, for those who still have a long time horizon, changes to the funded ratio assumptions – from future spending needs to the growth rate – may change the funded ratio even more than the actual saving and investment results! Especially since there are actually a lot of potential assumptions underlying the funded ratio, including not only the time horizon to retirement and the growth rate, but in a “true” calculation of the present value of all future liabilities – i.e., every future retirement cash flow – the assumptions would/could also include mortality rates and/or the retirement time horizon and even age-banded changes in retirement spending needs over time. Not to mention that a truly accurate reflection of all potential assets to fund future liabilities would likely need to include valuing illiquid Social Security and pension income streams as well.
Which means in the end, the funded ratio might at least be an interesting thing to note – after all, some indicator of whether the client is on track towards goals is almost certainly useful – but it’s still not clear that it is really all that much better as a key performance indicator for retirement progress. Especially since over time, it’s almost entirely dependent on entirely uncontrollable returns, yet fails to express that range of possibilities. By contrast, at least a regularly updated Monte Carlo analysis conveys both the progress towards goals, and the fact that there’s still a range of possible outcomes going forward (explicitly recognizing that even a plan that’s on track won’t necessarily stay on track). Nonetheless, the rising capabilities of financial planning software to continuous track and update the status of a financial plan means some form of tracking progress towards goals seems likely to emerge in the coming years!
So what do you think? Are there problems with using a funded ratio to track progress towards retirement? Do you use a funded ratio with your clients? What adjustments can be made to improve a funded ratio? Please share your thoughts in the comments below!


Great article Michael. I wonder if the answer is to track the probability of being (at least) 100% funded (PV method and using Monte Carlo analysis). The client and adviser would settle on 1) an ‘ideal’ comfort level (probability) and 2) a ‘true’ comfort level (probability). This then creates a ‘band of comfort’ (in between which the calculated probabilities of the portfolio would fluctuate over time). Critically, they also agree that they only need to take (corrective) action when the lower ‘true’ level is breached on the downside- i.e. “We agree that ideally your portfolio would display a 90%+ chance of being (at least) 100% funded. But we will accept your chances being as low as 80% and we will only take (corrective) action if your portfolio’s chances of being (at least) 100% funded falls below that level.”
Great article, graph work and points made throughout. The one assumption I find intriguing on this hot topic is the concept of setting a goal in the first place. If you lag you feel bad and hopeless and if you’re ahead perhaps you feel overly zealous. At the end of the day everyone seems to adapt lifestyle to what they end up with or without. For advisors that work with non-goal setter types, should they be implementing their own biases based on their experiences and whom they’ve worked with? Some other angles I’ve come across are curiosities about how people are doing relative to others or how much ahead of their original contributions are they. I like this idea of the funded ratio and complexities in time due to compounding. I’m curious to test with it.
I was associated for a time with a major educational institution that used PV-based funding ratio as part of their pension funding assessments. In the late 80’s, the numbers were so optimistic, that they discontinued the employee contributions to the pension fund. They even went so far as to place the corporate contributions into individual employee DC funds (!). Well, we know how this story ended – when the .COM and Great Recession hit, the numbers took a dramatic turn for the worse and the “digging out” continues, albeit requiring much heavier corporate and employee contributions.
Part of the challenge might be that the goal is expressed as a dollar value irrespective of valuations. As you have discussed, the “4% rule” tends to be resilient because even if the market takes a downturn, reduced valuations mean higher expected return, so withdrawing 5% of the smaller-dollar-value has historically been sustainable.
I have been looking for a way to express progress that is resilient to momentary market pricing. Ultimately, that may turn out to be something like “number of shares of global index fund owned” which reflects the fact that buying during a market downturn moves one closer to their goal despite the momentary dollar value being half of what it was the year before. Monotonically increasing as someone continues to invest is a good start, because that is probably true. Including some expectation of compounding from buying more shares with the distributions might then yield a measure of “are you on track” that is less volatile.
We use a Monte Carlo approach. Makes much more sense to convey a probability of a future event than to try to make a single deterministic guess which is pretty much guaranteed to be wrong.
Great topic… as a DIY investor I’ve struggled to figure out how to measure our progress. I have 5 charts right now (and a lot of tables). 1 tracks growth in investible assets, 2 tracks growth in net worth, 3 is the same thing with bar vs line graph, 4 tracks our performance on the ‘millionaire next door’ scale (I scale the three categories to our income, then compare to our current net worth), but this metric skews – easier to achieve as you age) and finally, I calculate total net worth as a percent of total earnings (this also is easier to meet as you age). Then I have a couple tables – assuming I want 16x earnings at retirement (most sources seem to suggest 12-16) I track attainment against that. I have a rough estimate of necessary and desired expenses, and track against achieving 25x that if SS is included (at 70% of payout, given current funding issues.) Even if you are aiming for 25x future expenses, how do you know your future expenses? Then I have a reasonably sophisticated free analysis provided by my broker that suggests my worst case scenario is to fall about 20% short of target, but with average returns we’ll be fine. I also kind of back into the PV approach by projecting my current balances forward to see if it hits my semi-reasoned but semi-arbitrary nominal savings target.
Keep in mind, like many people, the pension I was once expecting has been decimated. From 30% income replacement, it’s now about 3%. I had a nice margin of error at one point, but that’s long gone.
All of that, and it’s still a roll of the dice. I mean, we seem to be roughly on track to be able to replace 100% of pre-retirement income, but it could be 80-120% (assuming I retire at 60). Or we could work longer. Or my wife and I both could lose our jobs and end up really struggling. I’m doubtful there’s any metric that can really handle the uncertainty and consolidate the info in a truly meaningful way, but all of these views together give me some sense of possible outcomes & when/if I need to worry. At some point you just have to accept the uncertainty and move forward.
Just revisiting this article. I’ve been using this method to track our savings, and have seen pretty much what you noted, assuming my calculations are accurate. At one point we were 156% funded. The dot.com crash took us down to 100%. We built back up to 130%, and the GFC brought us back down to 107%. Since then our investments struggled, hitting a low of 89%, rebounding to 93%, and with another 2.5% in returns this year we should make it back to 100%. The uncertainty of market based returns is a big driver of anxiety. On track or not, your fate is dependent on the markets. I guess aiming to retire by 60 gives us a fall back position should it be needed. Regardless, it feels annoyingly helpless to be so subject to the whims of the market. Four really good years could maybe allow me to retire. One terrible year could push that back to 15 years or more.