
Executive Summary
The 4% rule has been much maligned lately, as recent market woes of the past 15 years – from the tech crash of 2000 to the global financial crisis of 2008 – have pressured both market returns and the portfolios of retirees.
Yet a deeper look reveals that if a 2008 or even a 2000 retiree had been following the 4% rule since retirement, their portfolios would be no worse off than any of the other "terrible" historical market scenarios that created the 4% rule from retirement years like 1929, 1937, and 1966. To some extent, the portfolio of the modern retiree is buoyed by the (only) modest inflation that has been occurring in recent years, yet even after adjusting for inflation, today’s retirees are not doing any materially worse than other historical bad-market scenarios where the 4% rule worked.
Ultimately, this doesn’t necessarily mean that the coming years won’t turn out to be even worse or that the 4% rule is “sacred”, but it does emphasize just how bad the historical market returns were that created it and just how conservative the 4% rule actually is, and that recent market events like the financial crisis are not an example of the failings of the 4% rule but how robustly it succeeds!

How Conservative Is A 4% Safe Withdrawal Rate?
The origin of the 4% was to look at what kinds of withdrawal strategies would have worked through various historical scenarios (the original study analyzed a 30-year time horizon, although the same approach can be applied for a shorter or longer time horizon as well), and pick the withdrawal rate that would have succeeded (for that time horizon) in the one worst scenario in history. By definition, if a retiree went through a future retirement scenario that was as bad as anything we’ve ever seen, the retirement would still succeed (just barely), and in any other scenario, the results would just be even better.
Of course, given that most of the time, a retiree doesn’t actually turn out to retire on the eve of the next great economic catastrophe, systematically implementing spending at a 4% initial withdrawal rate will most commonly just leave a huge amount of money left over. After all, while sometimes an unfavorable return sequence may occur, in general a 4% withdrawal rate is really quite modest relative to the long-term historical average return of almost 8% on a balanced (60/40) portfolio!
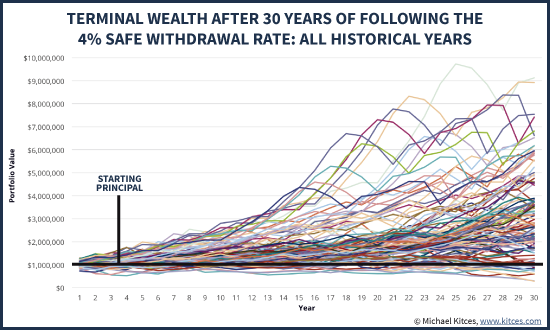
Accordingly, the chart above shows the nominal wealth path that would have occurred historically for a 60/40 portfolio with a starting balance of $1,000,000 that had a 4% initial withdrawal rate (adjusting spending each subsequent year based on inflation), going all the way back to the 1870s (using Shiller data). And as the results reveal, most of the time, the 4% rule just leaves a large amount of principal behind! Over 2/3rds of the time the retiree finishes the 30-year time horizon still having more-than-double their starting principal. The median wealth at the end – on top of the 4% rule with inflation-adjusted spending – is almost 2.8X starting principal. In other words, it's overwhelmingly more likely that retirees will have opportunities to ratchet their spending higher than a 4% rule, than ever need to spend that conservatively in the first place!
In fact, even when starting with a 4% initial withdrawal rate, less than 10% of the time does the retiree ever finish with less than the starting principal. And it has only happened four times in the ‘modern era’ of markets: for retirees who started a 30-year retirement time horizon in 1929, 1937, 1965, and 1966. In essence, then, these are the retirement years upon which the 4% rule is based; the whole reason we use the 4% rule is specifically to survive these kinds of ‘worst-case’ unfavorable-sequence-of-return scenarios we’ve seen historically.
How The 4% Rule Is Faring For 2000 And 2008 Retirees
The fact that the 4% rule is based on a particular subset of especially bad historical scenarios gives us a unique opportunity to compare recent challenging times for retirees – like those who retired in 2000 or 2008 – and see how they compare. In other words, if we looked at how the portfolio of a retiree was doing in the first half of a retirement starting in 1929, 1937, or 1966, would a retiree who started in 2000 or 2008 be doing similar, better, or worse?
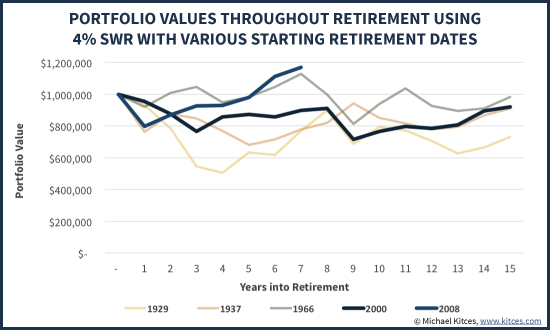
As the results reveal in the chart above, despite how shocking the tech crash and the 2008 financial crisis appeared to be in real time, the reality is that such retirees still have portfolios that are performing similar to or better than most of the historical 4% rule scenarios. The 2000 retiree is already half way through the 30-year time horizon with similar wealth to a 1929, 1937, or 1966 retiree had at this point, and the 2008 retiree is even further ahead than any of those historical scenarios (and even ahead of the 2000 retiree, too!).
Of course, an important caveat to the chart above is that it’s based on ‘nominal’ dollars, not adjusted for inflation. Which is important, because it means that retirees who had similar portfolio balances after the first half of retirement were not necessarily going to have the same buying power with those dollars for the rest of retirement (because of what inflation had been in the first half of retirement). This is especially true for the 1966 retiree, who experienced significant double-digit inflation in the first half of retirement.
Accordingly, the chart below re-calculates the progress of these retirees, based not on the nominal value of their portfolio through the first half of retirement, but based on the amount of inflation-adjusted spending they were doing from the portfolio at that halfway point. In other words, what was the retiree’s then-current withdrawal rate, year by year, as both the portfolio bounced around and inflation-adjusted spending requirements continued to rise each year.
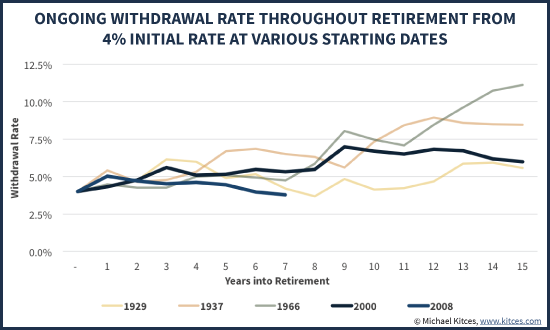
In this chart (where lower numbers are good, because it means the withdrawal rate is low and spending is modest relative to wealth), it quickly becomes clear after adjusting for the level of inflation-adjusted spending how much more severely adverse the first half of retirement was for the 1966 retiree than the others (the 1966 line is much higher than the rest). Even though the value of the portfolio was similar to the other retirements when measured half way through retirement, the current withdrawal rate at that point was far more problematic, having already spiked above 10% with 15 years still to go. In fact, the only reason the 1966 retiree was able to finish retirement at all with such a high withdrawal rate at the midpoint is that, by the half-way mark of retirement in 1981, both the stock and bond markets had gotten so cheap (yields had gotten so high) that the superior returns (and declining inflation) made it possible to finish successfully.
Relative to the 2000 or 2008 retiree, though, the results continue to look reasonably in line. Certainly the markets are not as favorably valued now for the 2000 retiree as they were in 1981 for the 1966 retiree, but then again the 2000 retiree is still only at a 6.2% withdrawal rate today (with just 15 years to go), while the 1966 retiree was over a 10% withdrawal rate at this point. And in the case of a 2008 retiree, the withdrawal rate is already right back at the 4% initial withdrawal rate the retiree began with (after already doing 6 years' worth of retirement spending!).
Keeping Retiree Market Disasters In Historical Context
Ultimately, the key point here is simply to recognize that the 2000 retiree is merely ‘in line’ with the 1929 retiree, and doing better than the rest. And the 2008 retiree – even having started with the global financial crisis out of the gate – is already doing far better than any of these historical scenarios! In other words, while the tech crash and especially the global financial crisis were scary, they still haven’t been the kind of scenarios that spell outright doom for the 4% rule.
The viability of a 2008 retiree following the 4% rule is especially notable, and reflects a key (but often ignored or misunderstood) tenet of managing sequence-of-return risk in retirement: it’s actually not just about having a severe market crash in the early years of retirement, but a crash that doesn’t recover quickly. Or more generally, the reality of sequence-of-return risk is that it’s more about having a mediocre decade’s worth of returns, not just a sharp single-year decline that goes through a similarly sharp recovery. And since the markets in the aftermath of 2008 have not stayed down and in fact have been more like a V-shaped recovery (as the S&P 500 has rocketed upwards to now be more than triple its value from the March 2009 trough), it turns out the 2008 financial crisis was an example of something that is not a dangerous sequence-of-returns event after all!
Of course, it’s also notable that while the 2000 and 2008 retirees are equal to or ahead of their respective historical-worst-case counterparts, the currently high valuation of the markets (based on Shiller P/E ratios) along with today’s low bond yields mean that those portfolios may be more stressed going forward from here. Still, though, these 2000 and 2008 scenarios are facing greater headwinds from what is otherwise still a lower withdrawal base than most of the other comparable bad-sequence historical scenarios. In other words, even if market returns are worse going forward from here than the bad market scenarios that safe withdrawal rates are based upon, the portfolios of today’s 2000 and 2008 retirees may still be more than far enough ahead to survive the 30-year time horizon anyway. It simply means they’ll be additional examples of scenarios that didn’t leave much at the end of a 30-year retirement, but not necessarily ones that breach the 4% rule in the first place.
Arguably, the case of the 2000 retiree is perhaps somewhat concerning, given a 6.2% current withdrawal rate for what is still a 15-year retirement time horizon (as a 65-year-old couple in 2000 would be turning 80 this year) built on a base of currently high market valuations and currently low yields. It wouldn’t be surprising to me to see the year-2000 retiree end out pushing the limits of the 4% rule, given that market valuations were stratospheric at the time, even relative to historical standards. Still, the current 6.2% withdrawal rate of that year-2000 retiree today is actually modest enough that a retiree couple in such a scenario could simply take the remainder of their portfolio, and buy a joint and survivor single premium immediate annuity with inflation-adjusting payments. At current market rates, the inflation-adjusting payout for the 80-year-old couple (assuming the 65-year-old retirees are now 15 years into retirement) would be 6.5% for their joint lives, more than enough to cover their 6.2% spending rate. Which means even the 2000 retiree isn’t yet below the ‘critical threshold’ that couldn’t simply be guaranteed for life, if depletion was a concern. In addition, a growing base of research suggests that retiree spending in real dollars tends to decline in later years – i.e., spending increases for retirees in their 70s and 80s don’t even keep pace with inflation – which means in practice a 2000 retiree today is probably even better off and spending even less as a current withdrawal rate than these calculations would suggest.
The bottom line, though, is simply to recognize that even market scenarios like the tech crash in 2000 or the financial crisis of 2008 are not ones that will likely breach the 4% safe withdrawal rate, but merely examples of bad market declines for which the 4% rule was created. In turn, this is an implicit acknowledgement of just how conservative the 4% rule actually is, and how horrible the historical market returns really were that created it. In the end, this doesn’t necessarily mean that the 4% rule is ‘sacred’ and that some future market disaster couldn’t be bad enough to undermine it (and of course, it can/should still be adopted for individual circumstances like a longer/shorter time horizon, the impact of taxes, the impact of fees and other investment costs, etc.). But when the Great Depression and the stagflationary 1970s couldn’t break it, and the crash of 1987 and even the global financial crisis of 2008 were just speed bumps, it will take a lot to set a new safe withdrawal rate below 4%!

Taking into an expense ratio will lower the safe rate—e.g., 1% ER might lower it to 3.5%
I never tire of reading this type of information and love (rereading archives) the hot links to the associated data. I would seemingly point out that this data reflects US Historical Data and suggest perhaps more global diversification should also permit safety for the 4% rule.
Michael writes: ….”It wouldn’t be surprising to me to see the year-2000 retiree end out
pushing the limits of the 4% rule, given that market valuations were
stratospheric at the time, even relative to historical standards” BAB highlight – I love that point as the US valuations are seemingly high once again with US Bond at historical lows. I love this field! Thank you Michael for your incredible products and communication.
Craig Israelson, professor at Brigham Young, has done research on portfolio survivability using more broadly diversified portfolios. This piece discusses a four-asset portfolio. http://www.aaii.com/journal/article/the-importance-of-diversification-in-retirement-portfolios.touch
And he has also done a good deal of research, writtern a book and been running money on a 12 asset class portfolio. http://7twelveportfolio.com/
Bruce,
To me there’s little doubt that greater diversification will itself substantiate SOME higher withdrawal rate than 4%, all else being equal.
The challenge is simply to quantify HOW MUCH more, and that’s where the debates begin. Unfortunately, we just don’t have great data for most other asset classes dating back prior to the Great Depression – and much of the “other” asset class data doesn’t go further back than 20-40 years, which is even more precariously short.
So beneficial, yes. How much more, not sure… :/
– Michael
I understand including 2000 to keep the data and analysis consistent over time, but from a practical standpoint 2000 is a very minor blip to anyone who had a decent amount of diversification. International, Emerging Markets, Value, Small Cap were all available investment at the time and drastically mitigated the dot-com bubble. Would you agree Michael?
Eric,
The overall market valuation in 2000 was even higher than the peak in 2008 (or 1929, for that matter). There are some who have suggested that retiring at that peak would ultimately “break” the 4% rule, specifically because of the valuation extreme (even for a diversified equity portfolio).
Indeed, 18 years later it’s not turning out as bad as forecast. But that’s the whole point of why it remains a relevant data point. Forecasts about how this was going to go 5-10 years ago were still much more dire. It’s becoming more of a “very minor blip” only with the luxury of time. 🙂
– Michael
Question: are you spending $40,000 per year per $1M adjusted for inflation static or is it 4% of each years starting balance adjusted for inflation?
Thanks
A 4% initial withdrawal rate, which is $40,000/year on a $1M portfolio.
In each subsequent year, the $40,000 is adjusted for actual inflation. Which is why the ACTUAL withdrawal rate fluctuates all over, as shown in the charts. It is NOT a 4% withdrawal OF THE BALANCE each year – then all the withdrawal-rate charts would be a flat line, portfolios would never deplete (you just spend 4% of a lower amount), and spending would be impossibly volatile leading to unsustainable lifestyles. :/
– Michael
Yes Michael, a flat line for spending charts showing cash flow each year. I showed a comparison after we all had met and talked at a conference in 2014 which can be found here http://blog.betterfinancialeducation.com/multi-media/how-income-may-compare-between-dynamic-and-safe-approaches/
The difference in approaches between the 1) 4% approach with inflation adjustment to that spending amount approach discussed in your post and the 2) dynamic approach discussed in my link, is that the dynamic approach refers back to the ACTUAL portfolio balance each year and redoes the calculation/simulation to determine a prudent spending amount for the coming year. That is one reason why the charts in the linked post show a gradual spending increase in real terms.
The other reason is that the withdrawal rate can slowly inch upwards over time because one has less time remaining on the planet to spend the remaining money. So there is a built in incremental adjustment to the withdrawal rate and a slow spending of the principal with age because one doesn’t need as much principal at age 80 to last the rest of their life as they did at age 65.
This builds in a mechanism in a measured manner to evaluate whether one has a larger than needed portfolio balance later in retirement or not. I think using both approaches to measure progress while in the retirement journey provides much more information about the health of the spending plan each year to keep an eye on how much is still needed to finish it. Much like watching the fuel in your car or an airplane on a journey.
Your description about how many years into retirement one has had versus what I’m describing as how many years left in retirement are useful with perhaps more information coming from the how many years left view (but I’m biased – haha). For your readers, my “ocean view” analogy you liked might be useful http://blog.betterfinancialeducation.com/sustainable-retirement/is-all-of-your-portfolio-at-risk-of-loss/ and how they count the years differently compared here http://blog.betterfinancialeducation.com/sustainable-retirement/two-views-of-determining-retirement-income/ .
Nice post and update on how the 4% approach has done Michael … very insightful!
Michael, please reconcile Bengen rule of 4% no-longer applies given today’s low yields, and, high Shiller PE 10. I refer you to Finke, Pfau and Blanchett article titled” The 4 Perent Rule is Not Safe in a Low Yield World”. Finke states that the 4% withdrawal rate results in significant portfolio failure rates when current yield data is used. And even if current yields do rise over 5-10 years, high failure rates still result. Finke also states historical findings use 20th century in a 21st century world, where 20th century data may no-longer be relevant.
Finally, 20th century academic withdrawal rates ignore life events such as heavy long term care costs for one or both spouses, which can decimate portfolio at any time during retirement.
High care costs demand higher or very high withdrawal rate from assets, if a retiree does not own a robust LTCi policy to safeguard retirement assets.
The FED’s QE Infinity saved retirees this time around, but perhaps not again in the future.
Add in Shiller PE 10 nosebleed today, and muted equity returns into the future appear quite possible-further jeopardizing Bengen’s 4% Rule.
I’d suggest reverse equity glidepath portfolio (30% today increasing by 2% per annum over next ten years) for newer and cusp retirees, along with inflation adjusted lifetime income annuity for flooring purposes. I could be wrong, but my clients for certain won’t be destitute and hungry at their ages 85 and 90.
Wade used higher expense ratios. I’d still be more careful, but his setup was different hense the different results:
The analysis assumes a 1.0% fee, or negative alpha, that is deducted from the portfolio value annually. This fee is included to account for unavoidable retirement portfolio expenses paid by the investor (e.g., mutual fund fees, advisor fees, account fees, etc.) for investment management.
http://www.retireearlyhomepage.com/wadepfau.html
I agree. I would not ask my clients to bet the farm on the 4% rule either. The Wise Owl’s points are very well taken, and, we must also consider that individual investors typically earn about 25% of “market Indices” over time, And, variable annuities with living benefits can earn at or near the 4% rate, guaranteed, neatly pooling away both sequence of returns risk and longevity risk. Turning one’s portfolio over to some stock jockey at age 65 is even more foolhardy than turning over the keys to your Maserati to your 16 year old grandson.
My Dad paid into his retirement plan for nearly 40 years, took the low survivor option and died 10 years later leaving my Mom with little. I’d take a 4% inflation adjusted joint annuity or variable with inflation compensating upside in exchange for reduction in longevity risk and self-management any day up to the point of what I think I need to live comfortably. That is what my retirement savings are for, for us to retire comfortably. I have other savings for wealth accumulation and if that turns out well… fine, I’ll have something to leave behind to the kids besides my integrity but I don’t feel like I owe them an inheritance. All I got was a good name and that has been plenty for me.
Sequence of returns risk is another huge factor that an individual can’t protect against that is managed by an annuity… it more-or-less ladders life and the sequence of returns risk that an individual can’t do. Someday the markets will come back but some of us can’t wait that long. Youngsters can.
Earn 25% of market indices? That’s dismal and depressing.
I discussed the Finke, Pfau, and Blanchett article when it was released. See https://www.kitces.com/blog/safe-withdrawal-rates-in-todays-low-yield-environment-walking-on-the-edge-of-a-cliff/
– Michael
I concur with your position. I have a hard time seeing the future as the past. In the last century this was a growing and increasingly productive nation. Things have changed and I don’t see them unchanging for quite some time. Neither does World Bank or IMF in their projections of growth. I find that for a 35 year retirement 2.7% is a “safe” BFIT rate resulting in “no failures” during the period of the Monte Carlo Simulation of the last 100+ year’s stock data and not taking into account adviser fees.
I am coming to the position that based on 1 Capital Unit as a starting place it would be good management to find an inflation adjusted lifetime income annuity coupled with deferred SS for both spouses. That deferral all depends on your faith in SS. I am nearly 60 so I think it is a reasonable bet. This plan should take about 0.6 Capital Units to provide about 2.5% of 1 Capital Unit in retirement income. The other 0.4 Capital Units could be invested as desired and left to grow for a rainy day or as estate. Using 2.5% of 1 Capital Unit as the desired inflation adjusted income stream implies about a 3.5 to 3.8% Inflation Adjusted Annuity base. Is this possible? Does such a product exist? If it does, I want one.
The outcome of such a plan would be spreading of risk of long life to the mortality of other travelers at the reduction of the HUGE upside that is possible with sole risk of a retirement portfolio of 1 Capital Unit dedicated exclusively to retirement. If you die early you lose your 0.6 Capital Units but if you live long you have benefit of 0.4 Capital Units to pass on in a moderate but more certain estate. I’d take that deal every day and twice on Sunday. Such a plan also reduces wear and tear on the retiree if he buys a good product. I want to enjoy my retirement doing stuff I have wanted to do and not had time to do for nearly 40 years… not managing and fretting over a cliff-hanger retirement portfolio. If the insurance provider makes a lot of money because the market exceeds my expectations or I die early… fine, that’s capitalism.
For the longest time many retirees take the lump sum instead of the annuity because they think they can generate a sufficient and larger rate of return with a high terminal estate value. They do not recognize the increasing risk of a long life and sole risk in a self-determined retirement portfolio that must be based on a 100% chance of a long life.
We have the “Gone Fishing Portfolio”, which I like and now I’d like to have the “Pigs get fat and Hogs get slaughtered retirement plan”.
As an early retiree in 2000, I think your analysis is a ok for a 65 year old, but not applicable for a early 55 (or younger). One of the guys who is been active in early retirement Raddr has been tracking the fate of Y2K retire for a decade. http://www.raddr-pages.com/forums/viewtopic.php?f=2&t=1208
He used a 75%/25% (T-bills) which was conventional wisdom at the time, and 75% is still recommend for long retirements. Using his methodology I calculate that a Y2K retiree portfolio is worth only $387K (in Y2K $) and his 40K withdrawal is 10.3% the same as the 1966 retiree.
I am — at age 67 and with 93 year old parents — scared shitless about running out money and eating the same food as my cats.
Which is why I keep working.
Don’t be afraid it is a terrible state of mind.
5 years now bet you are fine?
Yes.
We are fine.
I retired at age 70.5 in May 2019.
Parents died (at ages 95.5) and left me $300K. Investments did well until March 2020.
All the models—even Fidelity’s pessimistic one—say we are OK.
I have our fees down to 0.25%.
Your graph looks very similar to the ones generated by my http://www.fourpercentrule.com/ retirement calculator. Michael did you use it by any chance? If so, cool! If not, then I’m surprised to see some else using the Shiller data to draw such a similar graph using what appears to be the same graphing package. I wrote the http://www.fourpercentrule.com calculator a couple years back, but few have used it as I never spent any time promoting it. I think you and your readers might like it. I tried to include all the features in a retirement calculator that I wanted to use myself. If you have a links page on your blog, I’d appreciate one! Thanks.
Steve,
These charts were all built myself (in good ‘old Excel). I’ve been using Shiller data to model the 4% rule going back to 2007 (see https://www.kitces.com/may-2008-issue-of-the-kitces-report/ for a long piece I published on safe withdrawal rates using Shiller data in 2008).
I’ll confess I actually hadn’t seen your site here at all, but will take a look! Thanks for sharing! 🙂
– Michael
Hi, I was thinking you probably weren’t using my site because (although very similar in appearance) the graphs didn’t match exactly. It’s no surprise you hadn’t seen my site because very few people have. Nice site you have here!
How did you find that the 4% rule worked for a 1966 retiree? I’ve studied this scenariois using:
http://cfiresim.com/
Any retirement starting in 1966 will fail before 30 years using any stock/bonds combination (that I’ve found). Gold allocation can save it, but I don’t think that’s useful these days. With 60/40 the portfolio is depleted around 1989. The severe inflation in the 70s seems to be the cause. This is the 5% in the 95% success rate of the 4% rule..
I’m curious how you found it to survive?
Did you specify withdrawals being made at the beginning or the end of the year. That could make a difference. Can you post your spreadsheet calcs so we can examine them? Thanks!
I got a question. I’m trying to replicate the results in the 2000-2015 (even 2016) period and I can not get to the ~$920,000 final (nominal) asset value in 2015 as in your chart. Well, to be precise, I can exactly match that $920,000 value if I assume 40% in 10Y Treasuries. ($1,000,000 initial portfolio, 4% withdrawal, adjusted for inflation, 60% S&P500 Total Return, 40% US Treasury Benchmark Bond Total Return Index). That would give me the exact same figure as in your chart (the entire time series looks pretty similar, too).
But didn’t you just a few weeks before this post propose using 1Y T-bills for the bond exposure (in your Ratcheting post)? When using 1Y T-bills the portfolio gets down to about $540,000 by mid 2015 and below $500,000 by end of 2016. Under that allocation the 4% rule was a spectacular failure. Is there a reason for this inconsistency, i.e., propose 40% T-bill for 1871-1999 and 40% 10Y Treasury for 2000 onward?
Just wondering. Or maybe I miscalculated something. It wasn’t completely obvious what you used for bonds in this post, so I presumed it has to be the same assumption as in your “ratcheting post.”
Thanks!
EarlyRetirementNow,
Sorry for the confusion on this. I need to double-check our notes, but I believe this was in fact done with 10Y Treasuries.
At the time, we were working behind the scenes on some follow-up research that would look at dynamically adjusting bond allocations between 1Y and 10Y Treasuries based on starting interest rates (basically as a proxy for exposure to interest rate risk), which unfortunately is still sitting on the sidelines to be finished and thus hasn’t been published yet. Our models would have tilted 2000 towards the 10Y Treasury (as interest rates weren’t low enough to merit a defensive 1Y Treasury position in the bond allocation), so we had done this article with a 10Y Treasury baseline.
I’m hoping to get back to the dynamic bond model soon. This is a helpful nudge to me to finish that up. Thank you for the nudge! 🙂
– Michael
I think looking at a starting point of 2008, just after the market tanked, misses the point. The problem is when you start when the market his high and you have a lot of money in your portfolio and then it crashes and you have a lot less. If you stick to the 4% rule in those circumstances, you will run out of money.
The real problem is determining the value of your account based on current prices. Those prices are really just today’s snapshot and given market volatility are likely to be misleading. Using a 10 year average would serve you a lot better.
The market crashed at the end of 2008. This analysis starts at the beginning of 2008. This IS starting from the high… that’s the point. These are ALL examples where you start with 4%, FROM THE HIGH, BEFORE the 2000 or 2008 market crashes. And with the 4% rule, you’d STILL be ahead of the other historical scenarios…
– Michael
The bear market started in 2007. But you are right, most of the drop happened 1/2008. That drop, however, was shorter than usual. And for retirees that is the real issue. If they set themselves up to take out 4% of their October 2007 balances, they would have been taking out 8% by 2009. But, because of the short duration of the bear, they would have been back to 4% by 2013. By comparison, it was the mid 50’s before the market permanently recovered from the 1929 crash. Other recoveries were shorter, but many still took close to a decade to permanently reach their previous price. If we were still below those 2000 or 2007 levels, people following the 4% rule would be in a world of hurt. Its not the short spikes that send the market steeply down that are the danger, it is long recoveries.
Correct, it’s extended periods of mediocre returns that create problems, not sharp bear markets (with sharp recoveries), as I’ve written previously. See https://www.kitces.com/blog/why-merely-mediocre-returns-can-be-worse-than-a-market-crash/ for one of many.
But that’s also the point here. Even “the worst” market declines we’ve seen in the past 40 years didn’t put a dent in the 4% rule. (Nor did the 73-74 bear market, for that matter.)
– Michael
Great article. I’ve looked at these charts and find yours to be good additions. I generally use 4% for retirees in their 60s, lower if retiring before, up to 5% if retiring 70-75. I also use annuities in many cases for a portion of the assets to shift the risk of a long, unusually bad market stretch (I agree – flat returns are much worse than a sharp drop and recovery).
One theory I’ve wanted to back-test, but don’t have the bandwidth (or the Excel skills), is the “Adjusting %” concept. For example, if the inflation-adjusted withdrawal drops to 3.5% or lower, adjust it back up to 4%, as though the person were retiring freshly at that point. This should somewhat reduce the “excess wealth” in 2/3 of the cases you note above. This is almost like a variable annuity with a market adjusted guaranteed income.
Another scenario I’d like to see is $1,000,000 in an IRA, starting 4% WD at 65, and rising above that at 73 or so, when the RMD % exceeds 4%. So many people with good savings and investments have 100% in an IRA. I know, of course, that they could save or re-invest the portion over 4% but how many of us tell our 80 year old clients to do that?
Fran Toler
What results would different allocations such as 50/50, 40/60 have? Wouldn’t you want to tilt more towards bonds to reduce volatility?
I place an unbiased vote in favor of the conclusions of this article!?