Executive Summary
Financial advicers are intimately familiar with the phrase, "Past results are not indicative of future performance." Every document that considers the facts around any particular asset class will invariably include that disclaimer, but constructing a portfolio consisting of a mix of equities, fixed income, and other assets requires investors and advicers to make some fundamental assumptions around long-term expected returns and correlations between assets. 3 common assumptions that have driven asset allocation decisions for decades are that 1) equities have historically outperformed fixed income over the long-term, 2) bonds act as an effective diversifier in a portfolio since they are negatively correlated to stocks, and 3) various combinations of non-correlated assets improve a portfolio's expected return per unit of risk. However, as investors learned in 2022, when the S&P 500 and 20-year Treasury Bonds fell 18.1% and 26.1%, respectively, historical "tendencies" don't always hold over shorter timeframes, prompting the question: How reliable are our assumptions around the long-term performance of stocks and bonds?
On the one hand, in an analysis of data going back to 1802 in his seminal book, "Stocks For The Long Run", Jeremy Siegel concluded that stocks outperformed bonds over long periods. However, Edward McQuarrie, author of the 2023 study "Stocks for the Long Run? Sometimes Yes, Sometimes No," reached back even further to 1793 and expanded the data set to include 3–5X more stocks and 5–10X more bonds. Accordingly, McQuarrie found that, while stocks did indeed far outperform bonds between 1942–1981, not only did stocks and bonds produce about the same wealth accumulation during the 150-year period before 1942, but the same held true from 1982–2019 as well.
So, although the entire 227-year span of McQuarrie's analysis from 1793 to 2019 was weakly supportive of Siegel's conclusions, there were subperiods where bonds actually outperformed stocks, leading McQuarrie to conclude that there was no consistent relationship between asset outperformance and length of holding period to which values must revert. Instead, McQuarrie argued that the changes over various periods depend solely upon the 'regime' in place, where a regime is defined as "a temporary pattern of asset returns" characterized by "ceaseless variation" over time.
Meanwhile, McQuarrie also found that stock-bond correlations have also been "highly variable over 20-year intervals, ranging all the way from about −0.70 to 0.90", suggesting that, in addition to performance, correlations are also subject to regime changes and that bonds don't always effectively diversify risk. In fact, they can even magnify risk, as was the case for the 7 decades between 1926–1999, when the stock-bond correlation was a positive 0.18.
Finally, over time, regime changes have also lowered the overall risk of equity investing. For example, the creation of the Federal Reserve in 1913 and the SEC in 1934 have helped to reduce economic volatility and increase corporate transparency. These changes, along with lower trading costs, have made the world a much safer (and less expensive) place for investors, who, as a result of reduced investment risks, may experience lower future returns.
There are several takeaways for advicers as they serve their clients. First is the fact that stocks (specifically because they carry a higher risk level) have not always outperformed bonds, and while stocks should carry a risk premium, advicers can turn to Monte Carlo simulations to consider a wider dispersion of outcomes, versus relying on 'expected' returns when developing investment plans. Second, the stock-bond performance-correlation relationships are regime-dependent, and those regimes are neither time-dependent nor mean-reverting.
As a result, an advicer's primary consideration when developing asset allocation plans should be the diversification of risk, while accounting for the fact that bonds won't always be an effective tool to achieve such diversification. Moreover, advicers might consider incorporating alternative investments into client portfolios, including things such as long-short factor strategies, private equity debt, reinsurance, consumer and small-business lending, among other assets. Ultimately, the key point is that there are asset classes outside the traditional stock-bond universe that can be used to create portfolios that are more diversified and that may be better suited to address a particular client's ability, willingness, and need to take risk!
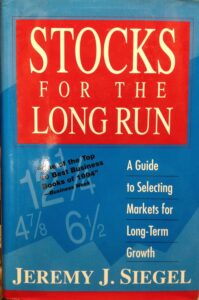 The 1st edition of Stocks for the Long Run by Jeremy Siegel was published in 1994. It quickly became a bestseller and has been revised and updated several times. The latest edition, the 6th, was published in 2022. Siegel presented evidence showing that stocks have historically outperformed bonds and other investments over the long run. One of Siegel's contributions was to push the beginning of the stock and bond records all the way back to 1802. An important question for advisors and investors alike is: Was Siegel right in concluding that stocks were the asset to own in the long run? Or was his conclusion based on what author Elroy Dimson called Triumph of the Optimists?
Drawing on new data sources that have become available since Siegel published his book, Santa Clara University professor emeritus Edward McQuarrie, author of the 2023 study "Stocks for the Long Run? Sometimes Yes, Sometimes No," published in the Financial Analysts Journal, produced new findings that "substantially diverge from the record available to Siegel." McQuarrie's data series for both stocks and bonds began in January 1793, the 1st month where more than 3 stocks were found trading regularly. His series improved on the old with these adjustments:
- Included securities trading outside New York, in Boston, Philadelphia, Baltimore, and southern and western cities, covering 3–5X more stocks and 5–10X more bonds.
- Captured more failures, reducing survivorship bias.
- Included large numbers of Federal, municipal, and corporate bonds, as opposed to the 1 bond used each year by Siegel prior to 1862.
- Calculated capitalization-weighted total return for stocks. The old stock record was either price-weighted or equal-weighted and lacked information on dividends.
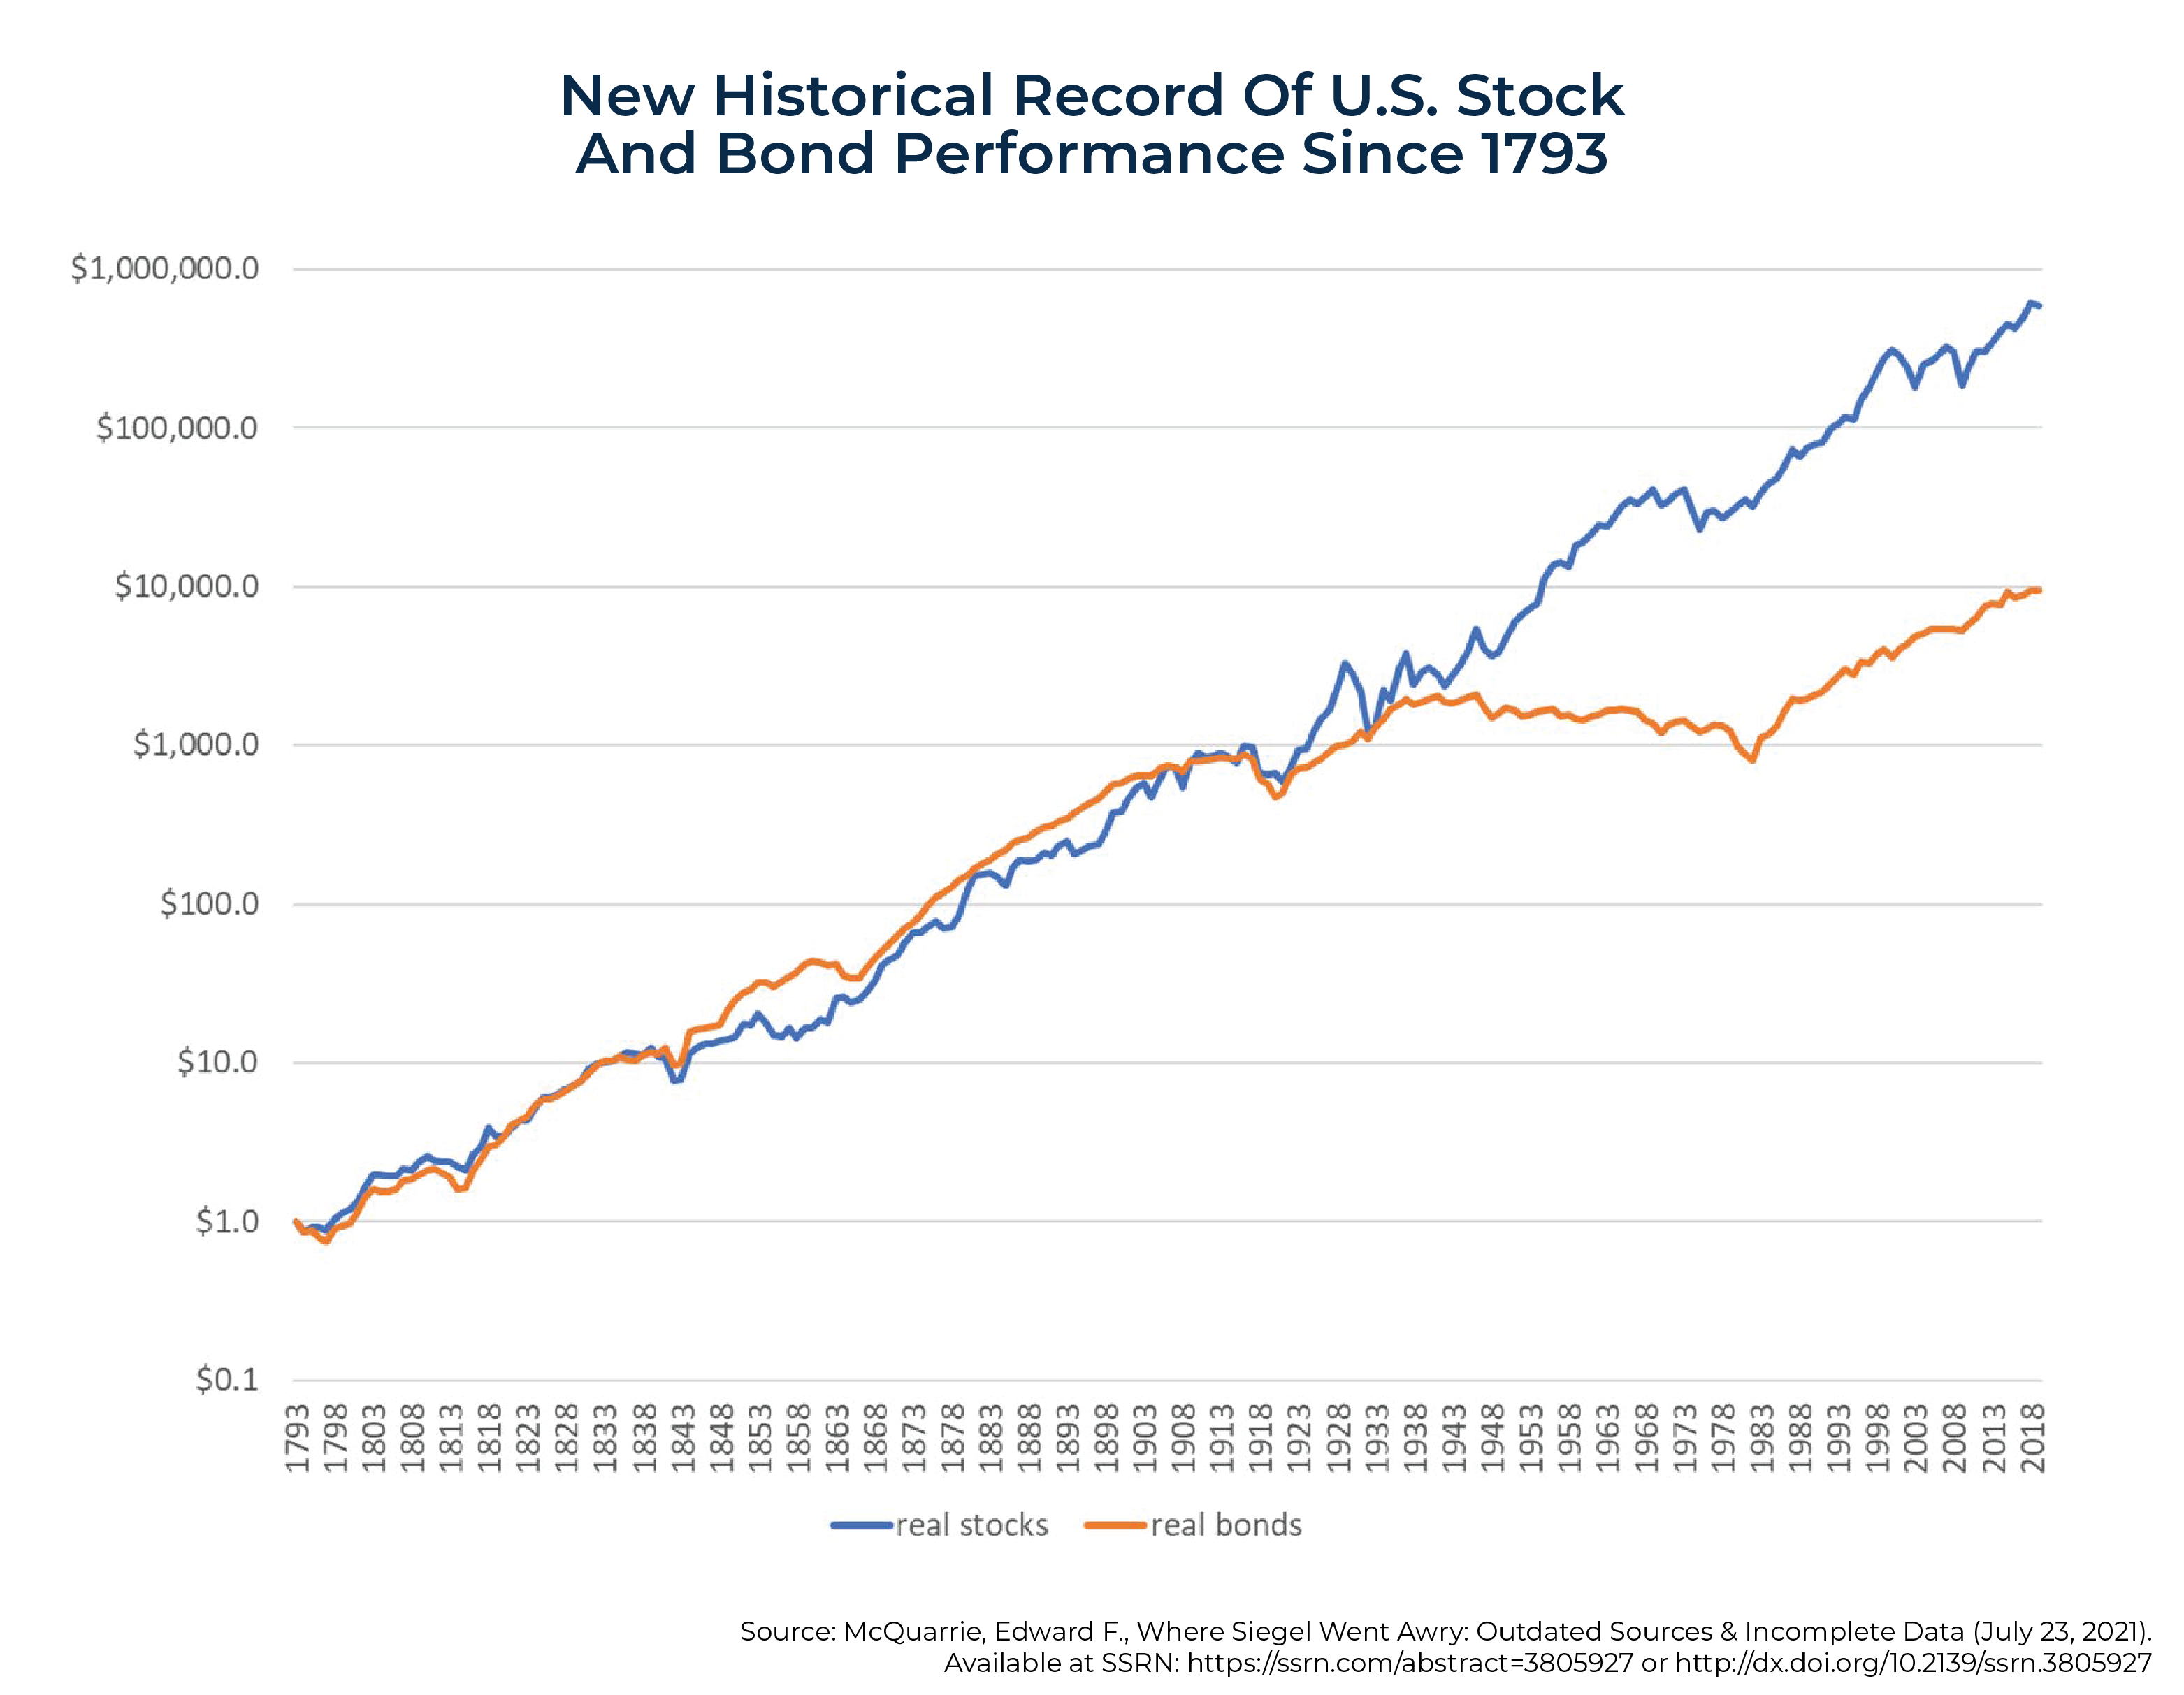
The following chart taken from an SSRN working paper titled "Where Siegel Went Awry: Outdated Sources & Incomplete Data", also written by McQuarrie, shows the following trends based on the expanded data set:
- Over the 150 years from 1792–1941, the performance of stocks and bonds had produced about the same wealth accumulation by 1942.
- Over the next 40 years (1942–1981), stocks far outperformed, providing the basis for Siegel's claim.
- From 1982 through 2019 (pre-COVID), while stocks outperformed, the results were much closer to the first 150 years than the previous 40 – the S&P 500 returned 11.8% per annum versus 9.5% per annum for long-term (20-year) Treasury bonds.
Following is a summary of McQuarrie's main findings:
- Results for the entire 227 years were weakly supportive of Stocks for the Long Run, as the odds of stocks outperforming bonds did increase as the holding period lengthened from 1 to 50 years. However, the odds never got much higher than 2-in-3 and increased slowly as the holding period stretched from 5 (62%) to 50 years (68%).
- However, the subperiod results did not support Stocks for the Long Run, as prior to the Civil War, which began in 1861, the pattern was the reverse: The longer the holding period, the greater the odds that stocks would underperform bonds – for holding periods of 30 and 50 years, in that era stocks always underperformed bonds.
- Conversely, the post-1942 period was strongly supportive of Stocks for the Long Run, as the odds of stocks outperforming started high and increased with the holding period, until by 30 years, the odds converged on 100%.
These findings led McQuarrie to conclude that no consistent relationship between asset outperformance and length of holding period could be extracted from the data:
The results are better interpreted as showing changes in regime. Prior to 1942, a regime of parity performance held sway: Sometimes stocks outperformed, sometimes bonds. After World War II, a new regime of extreme stock outperformance took hold.
He added:
The decades following World War II are the only instance where extreme positive returns on stocks coincided with sustained negative returns on bonds to produce a large and enduring stock advantage. This unique and relatively recent event, fatefully combined with the old, faulty 19th-century sources, led financial historians to extrapolate that in the long run, stocks would always beat bonds by a substantial amount.
It seems unlikely that two centuries suffice to field all the permutations of stock and bond performance that may occur. But 2 centuries are sufficient to undermine the idea that an advantage of stocks over bonds, of +2% to +4% annualized, represents any kind of lawful regularity or any range to which values must quickly revert. Rather, whether there is a stock advantage at all depends on the regime in place.
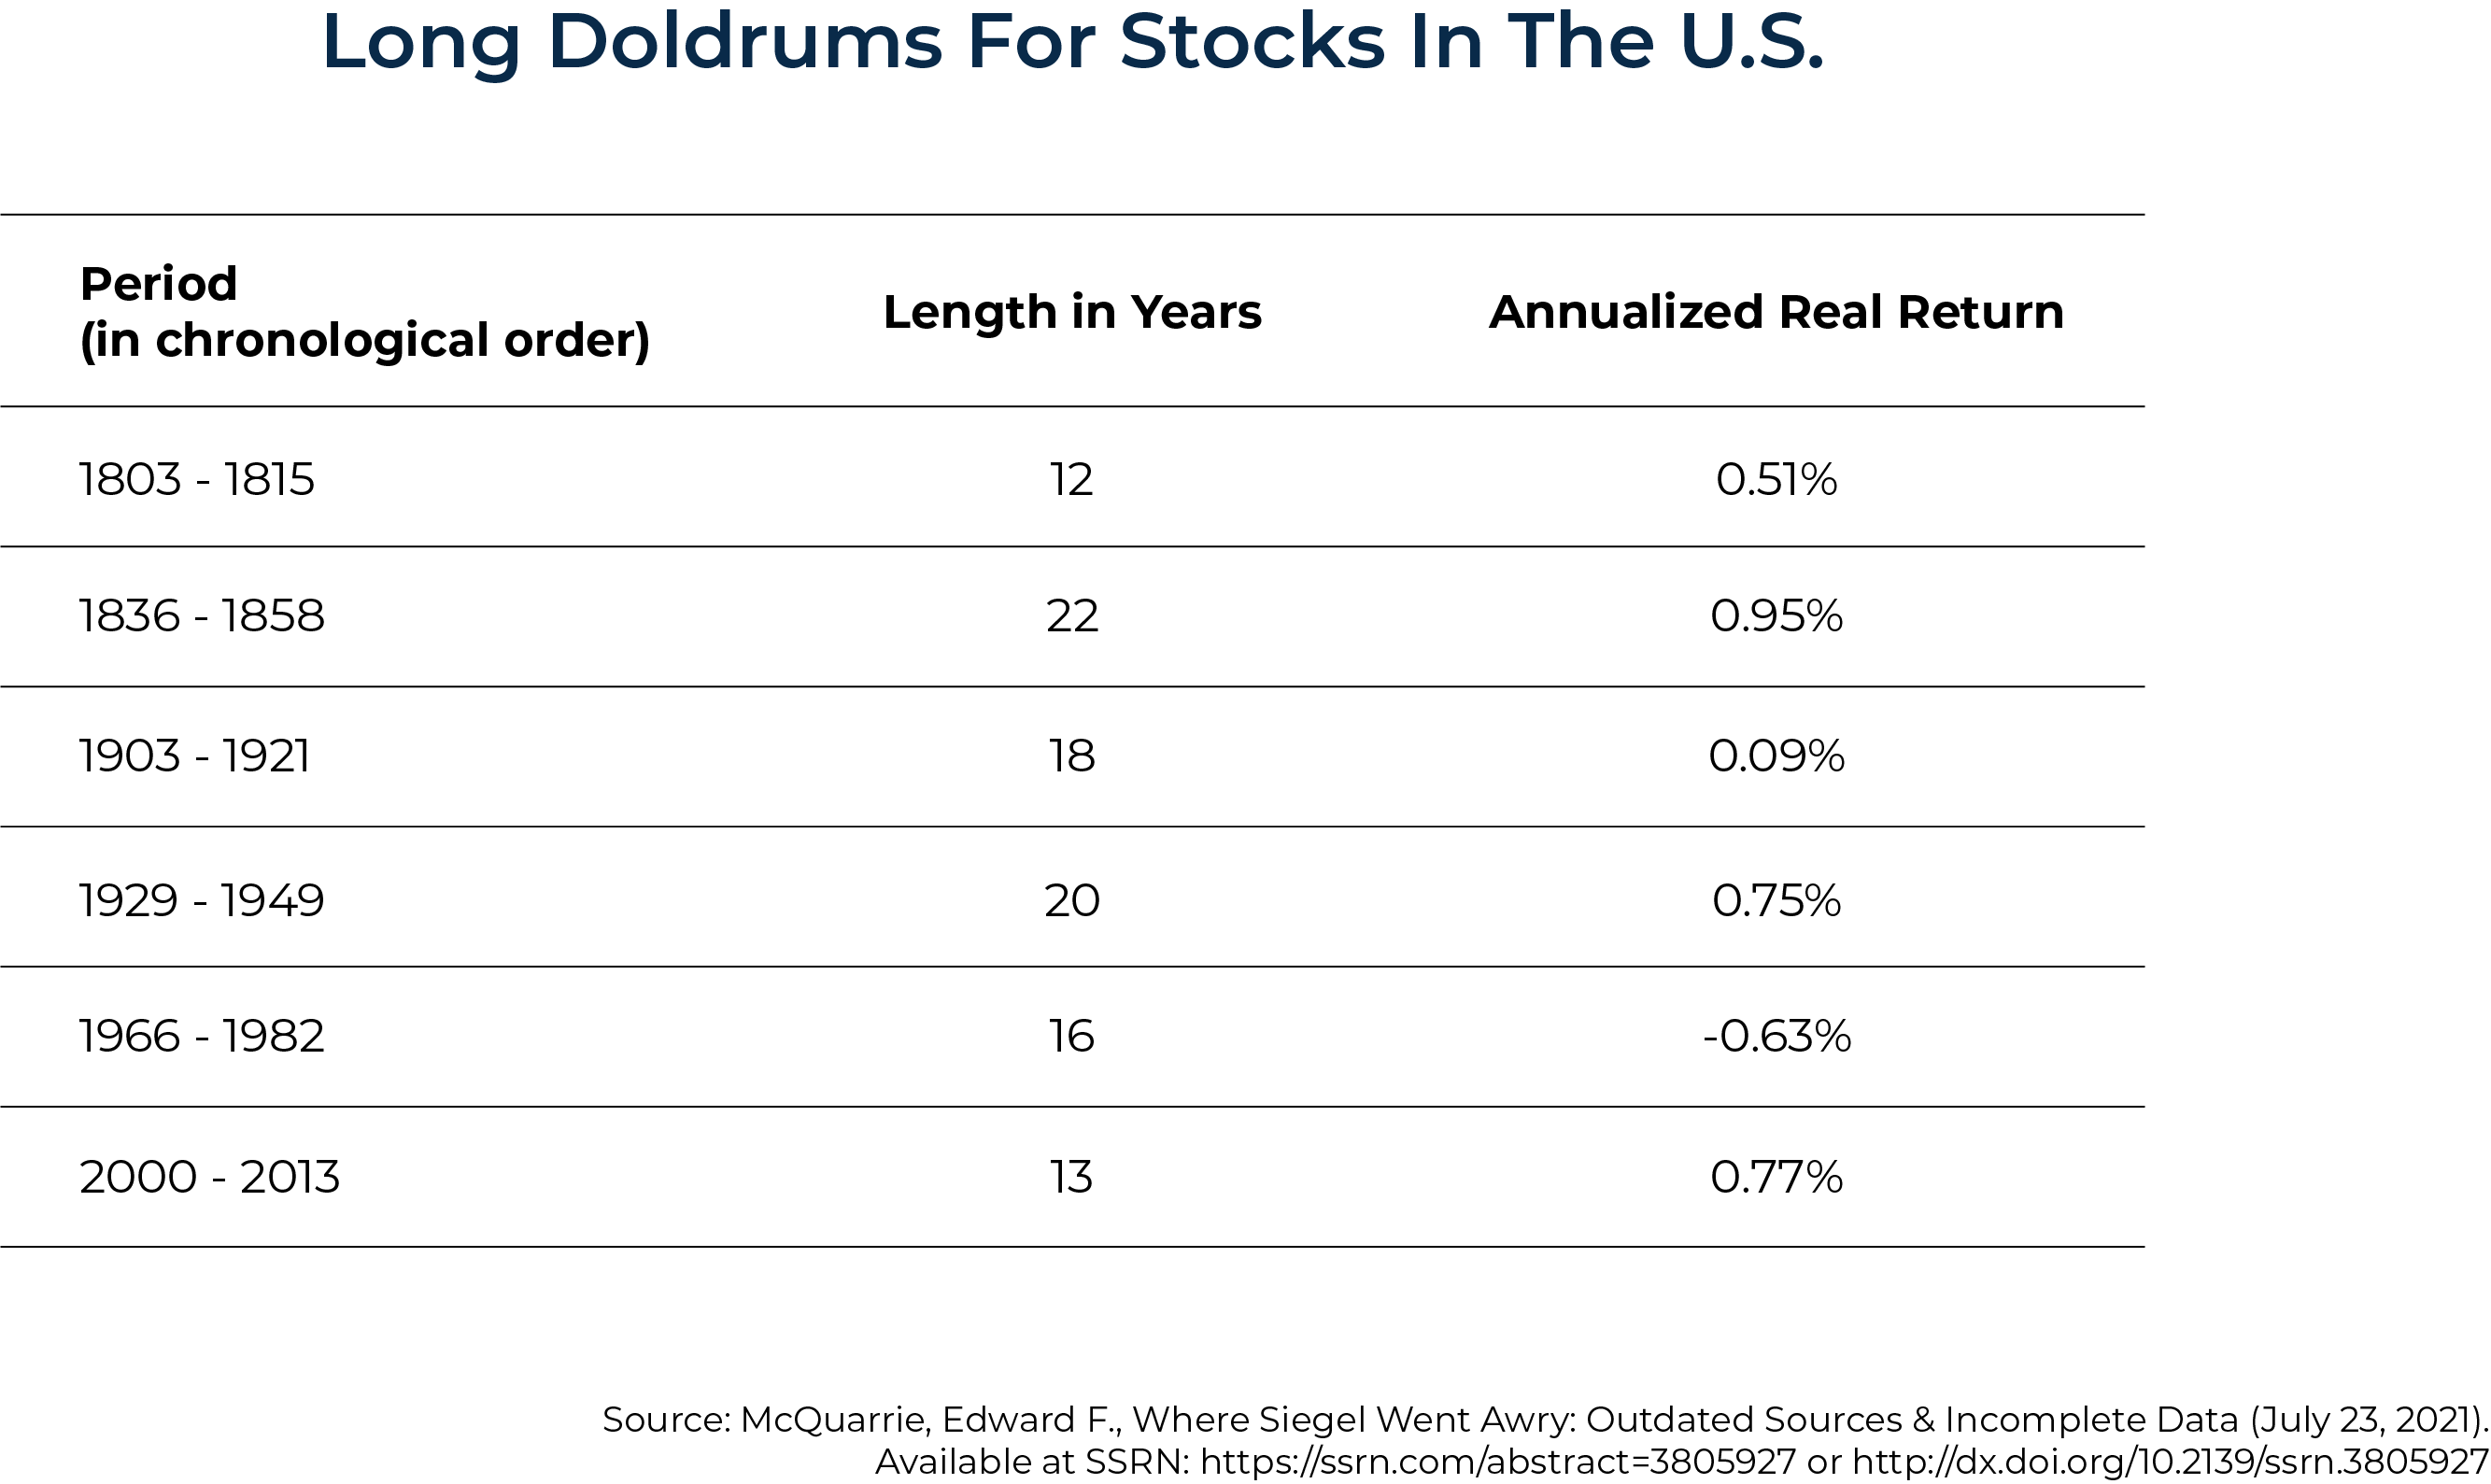
The following table shows long periods of "doldrums" for stocks.
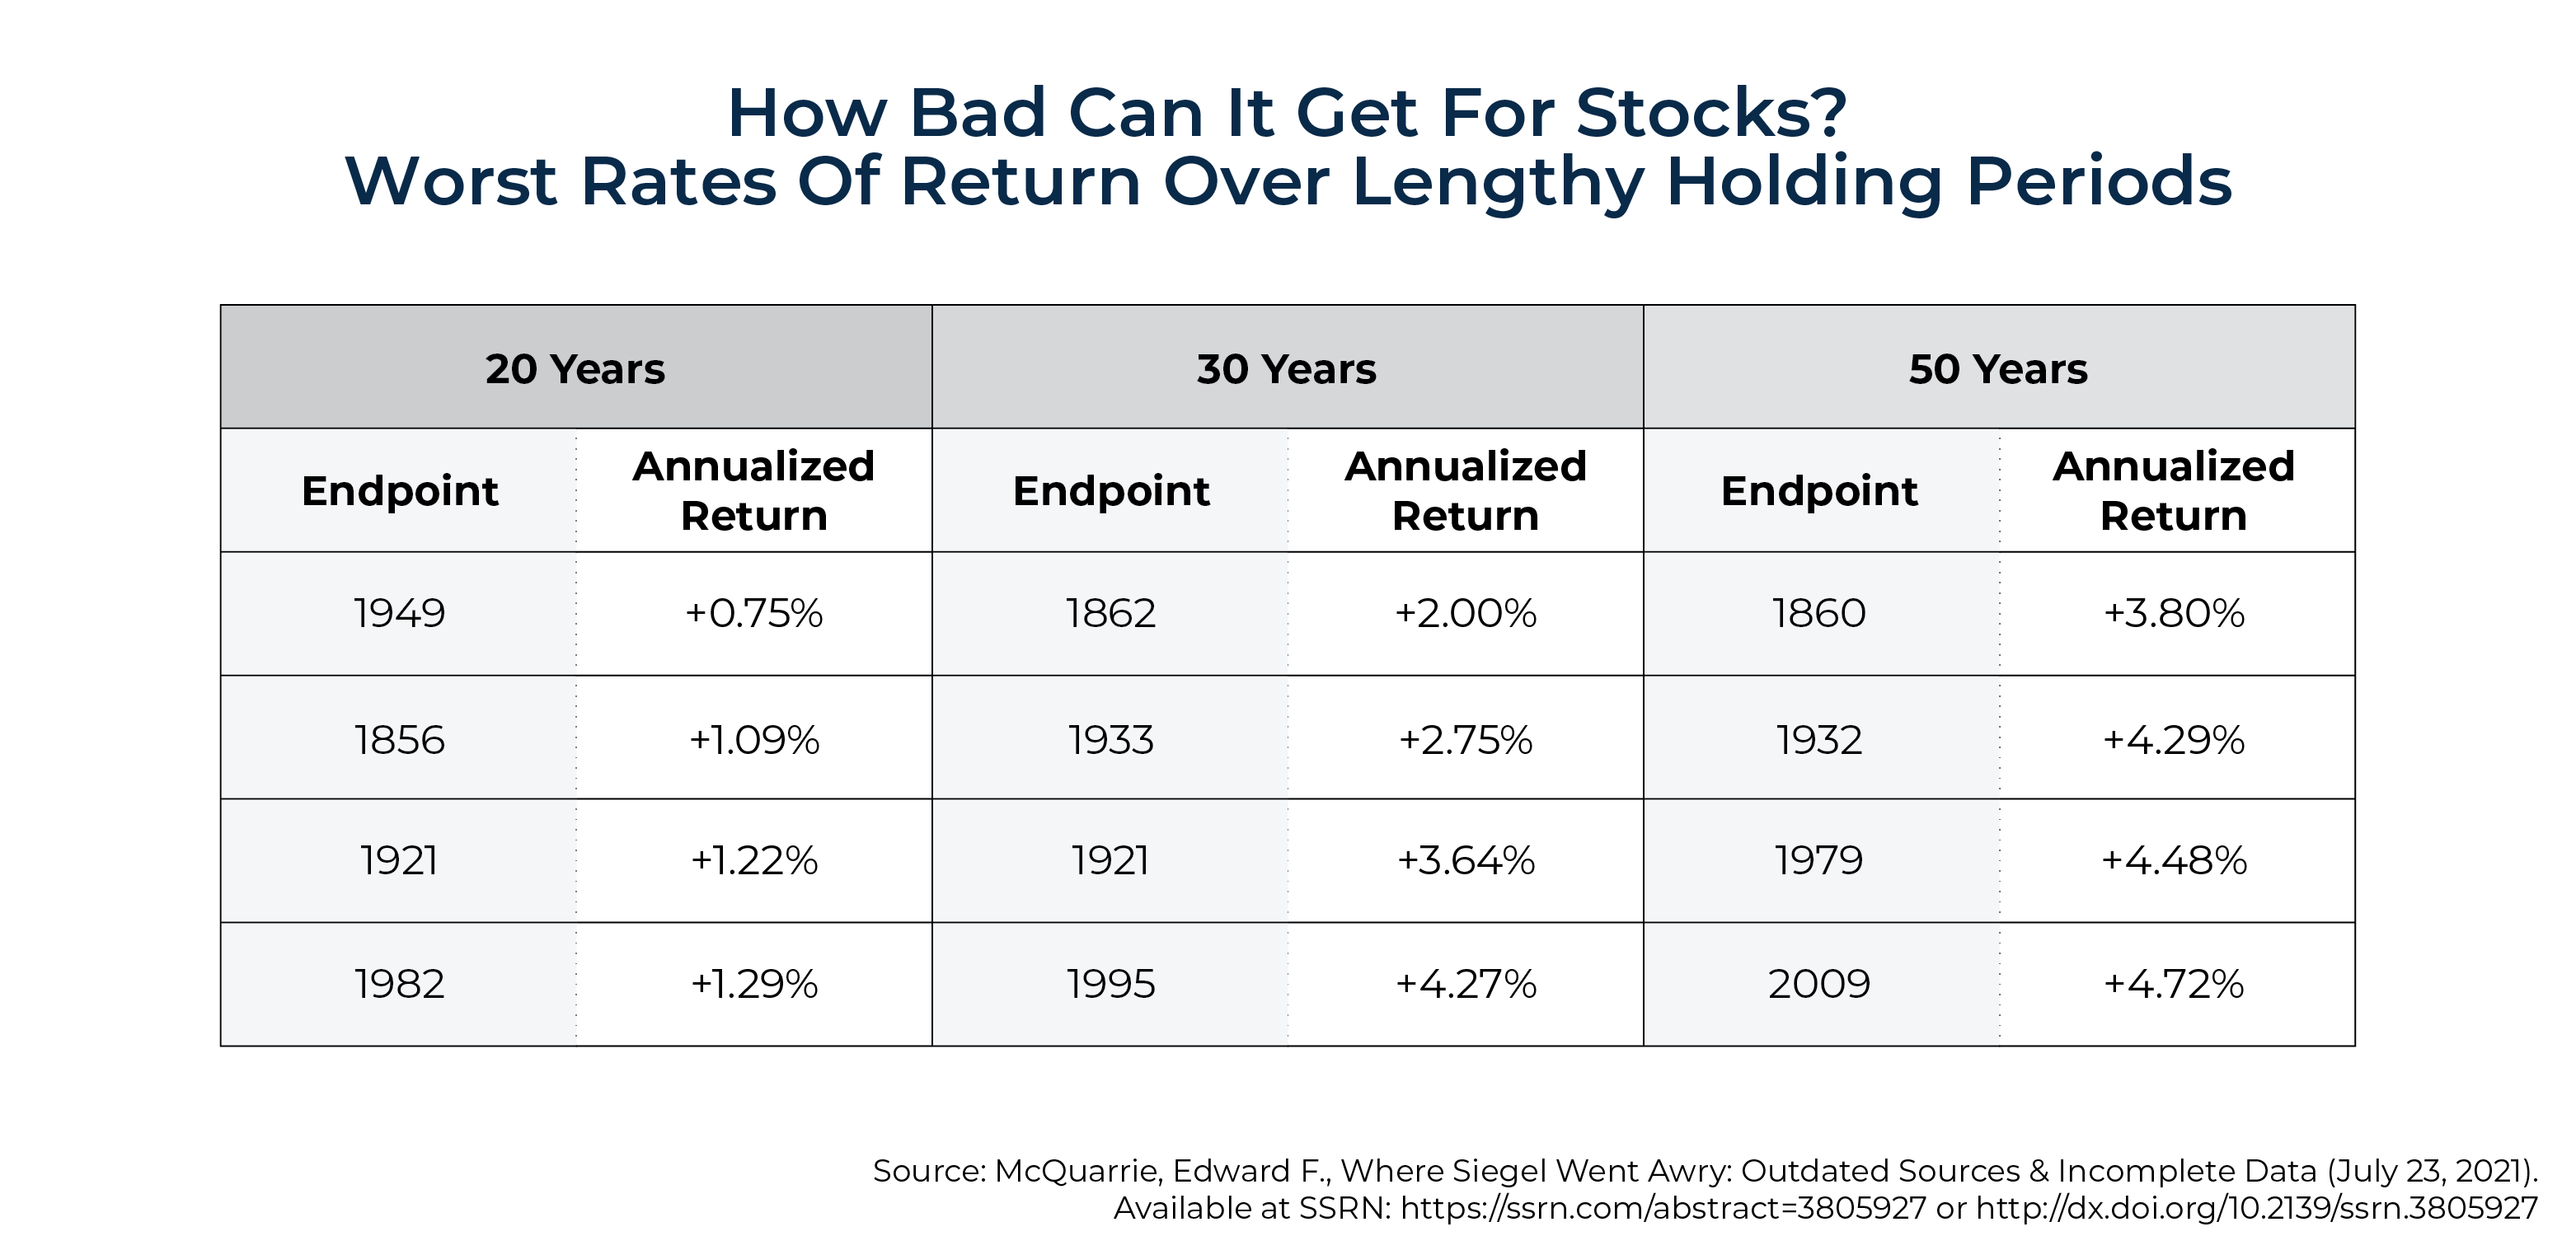
And the next table shows the worst rates of real return for stocks over lengthy periods.
McQuarrie's findings led him to conclude that Stocks for the Long Run was "built on a faulty premise", making the following argument:
…the strong returns on stocks seen after World War II, combined with the poor returns on bonds through 1981, reflected a stationary process. The old historical record appeared to show that stocks had always returned 6%–7% real and there had always been a substantial equity premium. The new data show that the 19th century, particularly the antebellum era, saw quite different returns than the 20th century, with repeated equity deficits.
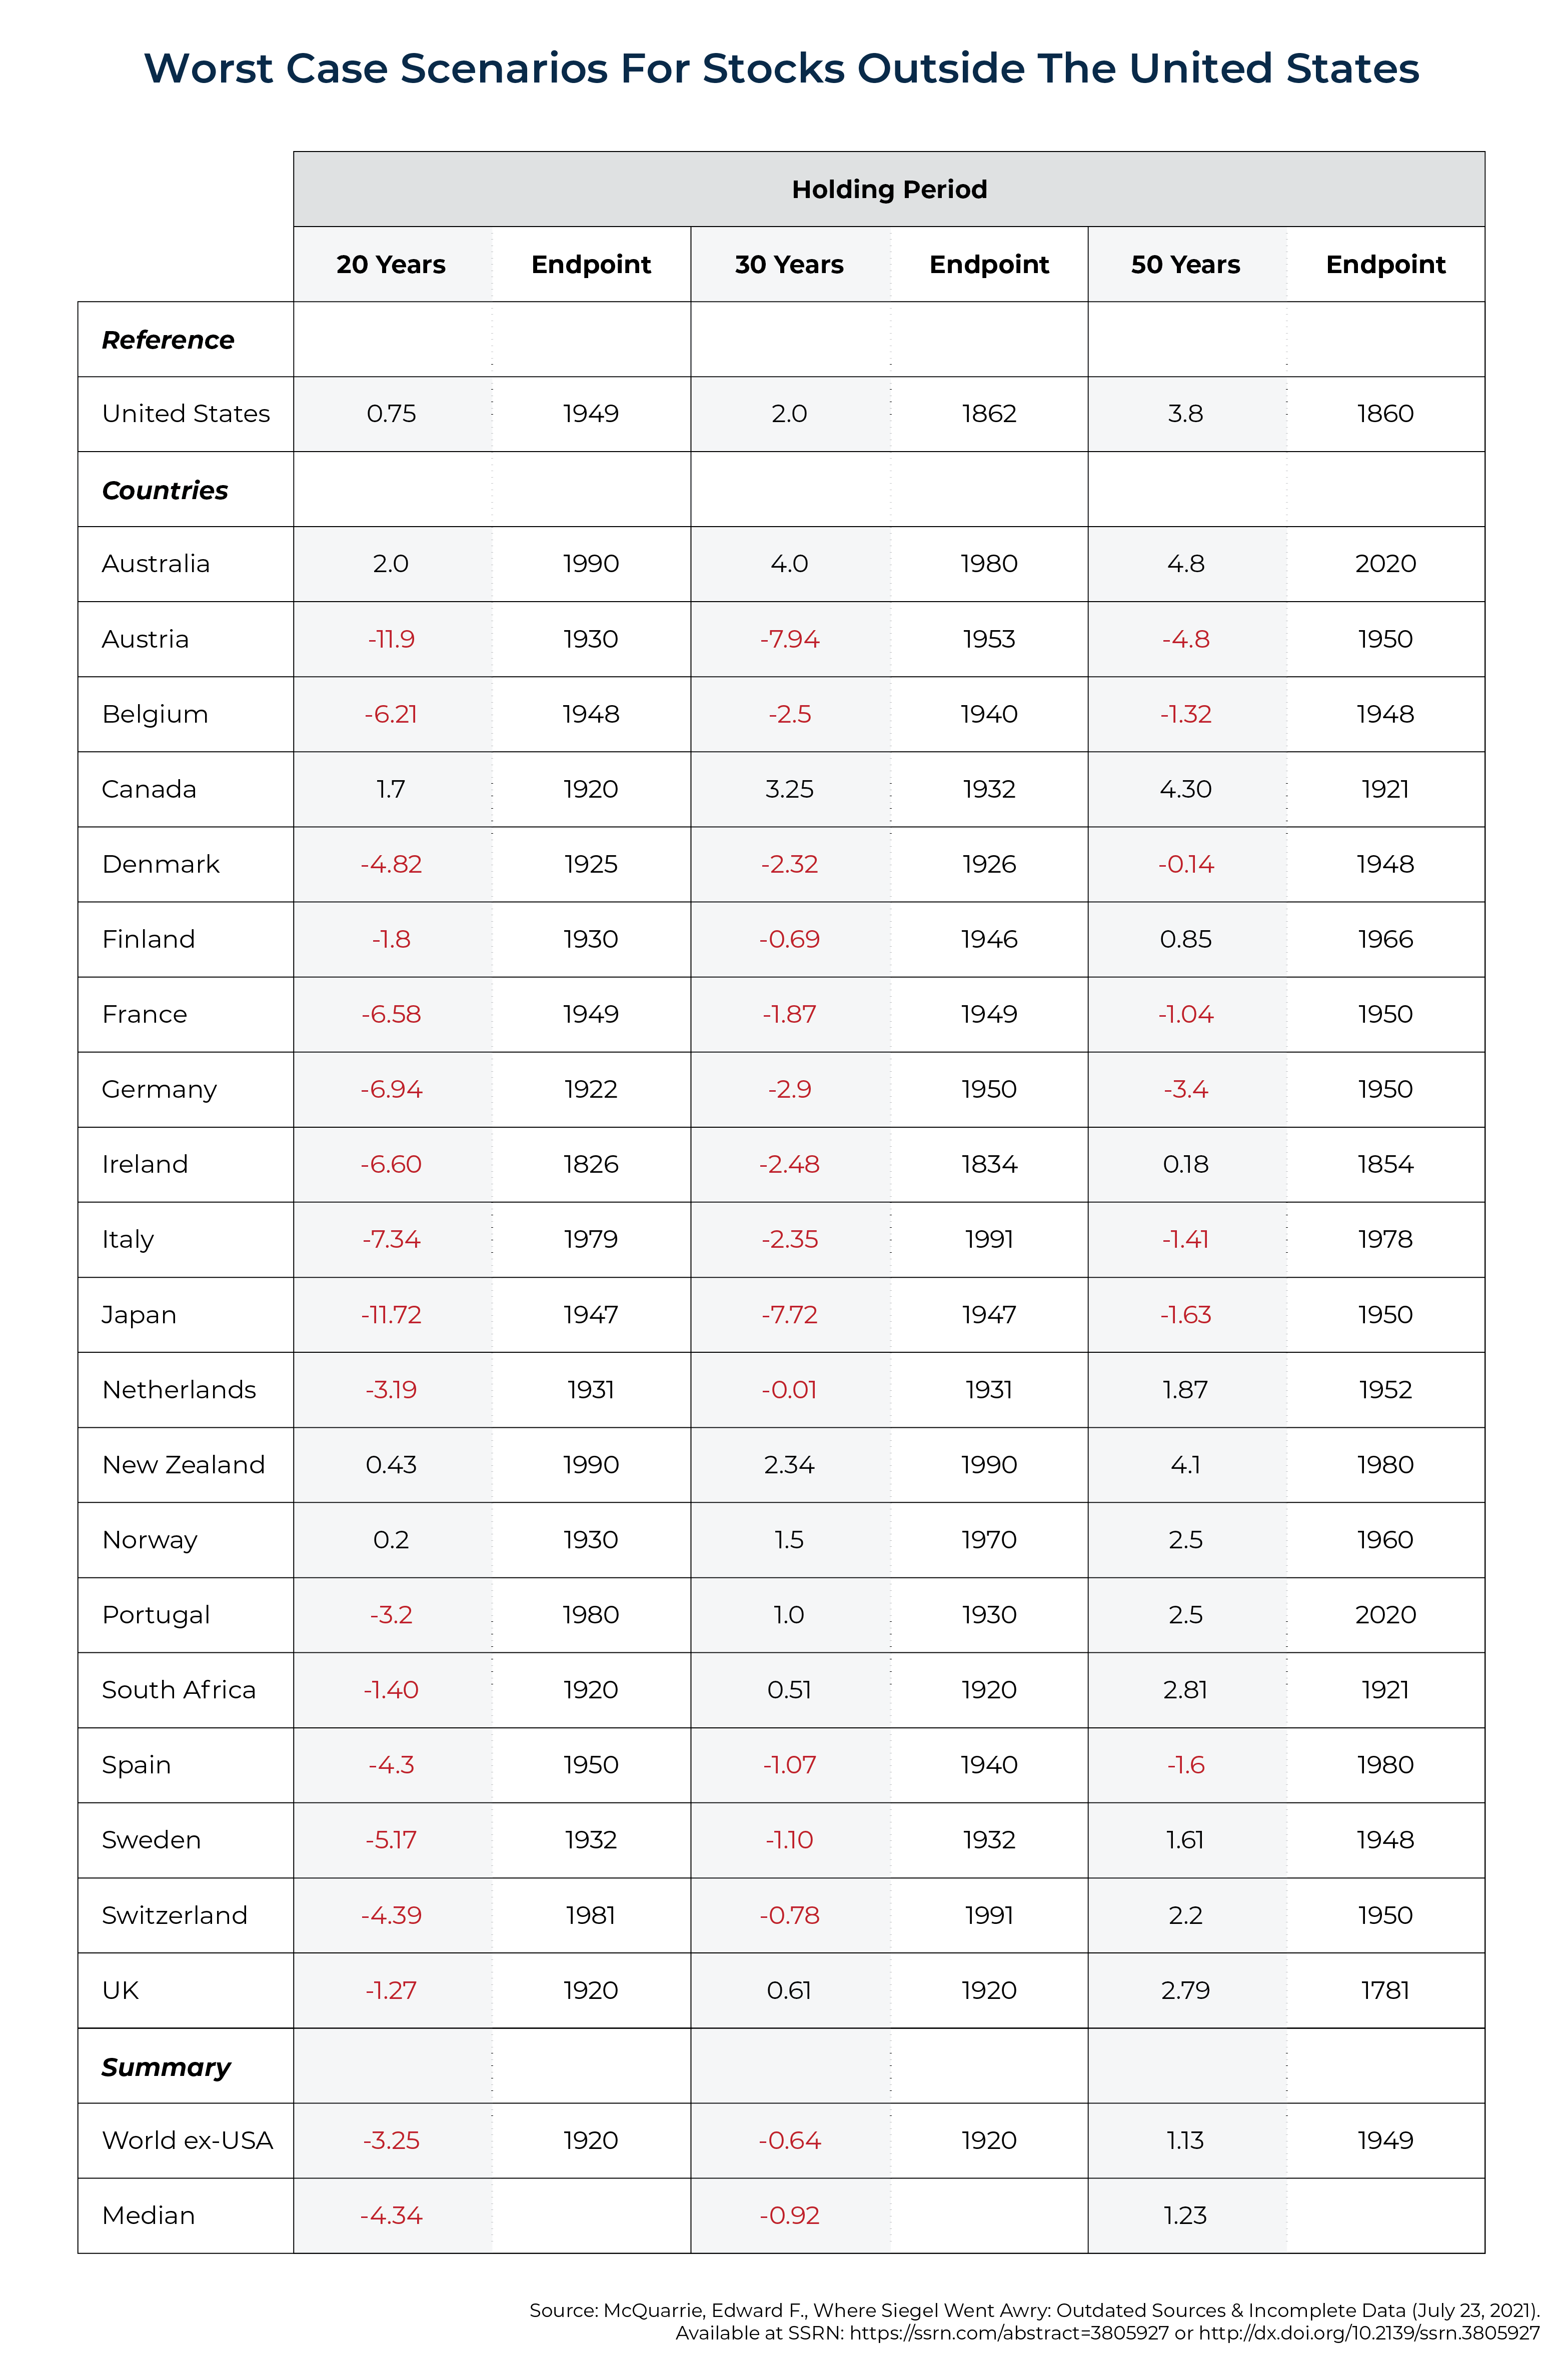
McQuarrie then went on to show that Stocks for the Long Run also fails out of sample, as the favorable experience of U.S. stock investors in the 20th century does not hold internationally. The following table shows the worst-case scenarios for real stock returns outside the U.S.
While major wars fought on one's homeland clearly led to some of the worst cases, other examples demonstrate that Stocks for the Long Run has not always been correct. The most recent of these examples is illustrated by Japan. Over the 35-year period ending in 2023, in U.S. dollar (yen) terms, the Japanese Government Bond Index returned 2.33% (2.68%), outperforming the return of just 1.01% (1.35%) of Japanese large companies.
McQuarrie also noted:
The 2020 Credit Suisse yearbook calls out returns over the trailing 50 years. For the World ex-U.S., for 1970 through 2019, the authors now report parity performance for equities versus government bonds, at 5.1% and 5.0% annualized. Outside the U.S., the equity premium has been just that small in recent decades.
At the country level, the new record shows multiple instances where the equity premium was a deficit for decades, as seen in the new 19th-century U.S. data. Japan since 1989 is a well-known counterexample to Siegel's thesis.
Importantly, McQuarrie found the following:
- 13 developed market countries that had negative real returns for at least 20 years, with the real returns ranging from -7.34% (Italy ending 1979) to -1.2% (Germany ending 1980);
- 7 developed countries with negative real returns for at least 30 years, ranging from -4.40% (Norway ending 1978) to -0.78% (Japan ending 2019); and
- 1 case of negative returns for 50 years (Italy ending 2011, -0.54%). There were 6 other cases with 50-year real returns below 2.41% (Norway, Austria, Sweden, Belgium, Spain, and Switzerland).
McQuarrie also found that each of the 19 developed countries studied experienced an equity deficit over at least 2 decades, and 18 had experienced an equity deficit across 3 decades: "There is no obvious clustering of dates… nor any concentration in one century or another. Some of the worst instances occurred comparatively recently."
Regime Thesis
As noted earlier, McQuarrie believed that his results were best interpreted as showing changes in regimes. He explained: "A regime is a temporary pattern of asset returns that may persist for decades. The regime thesis entails no periodicity and requires no reversion. Rather, it expects to find ceaseless variation, as the permutations and combinations of individual asset returns play out."
Correlation Of Stock And Bond Returns
In addition to examining the relative returns of stocks and bonds, McQuarrie also examined the long-term correlation of stocks and bonds. He began by noting:
Many analysts expect the stock-bond correlation to be low; over the trailing 9 decades the 2020 Stocks, Bonds, Bills & Inflation yearbook has it as 0.17 for corporate bonds and 0.01 for long government bonds. But those values, measured over the arbitrary interval represented by the modern post-1926 era, prove a poor guide to what a longer historical record might reveal.
McQuarrie found that "the correlation has been highly variable over 20-year intervals, ranging all the way from about −0.70 to 0.90" and that "[t]he overall correlation for the modern era of .01, per the SBBI, is much lower than the 0.61 recorded for the preceding 134 years."
In other words, just as there are regime changes in the relative returns of stocks and bonds, there are also regime changes in the correlation between stocks and bonds, suggesting that bonds are not always the strong diversifier of equity risks that many believe them to be. For example, in 2022, both the S&P 500 Index, which lost 18.1%, and long-term Treasury bonds (20-year maturity), which lost 26.1%, experienced double-digit declines.
The fact that both stocks and safe bonds produced large losses was a big surprise to investors who, influenced by recency bias, came to believe that safe bonds were a sure hedge against risky stocks. The data over the period January 2000–November 2022 provided the rationale – the monthly correlation between the 2 was −0.2. That led investors to believe in what came to be referred to as the "Fed put" – if stocks fell sharply, the Fed would rescue them by lowering interest rates.
Unfortunately, as McQuarrie showed, stock-bond correlations are not constant; they are time-varying and economic-regime dependent. For example, over the period 1926–1999, the correlation was, in fact, positive, at 0.18. Positive correlation means that when one asset produces better-than-average returns, the other also tends to do so. And when it produces worse-than-average returns, the other tends to do so at the same time. With stocks and bonds, time-varying correlation is logical.
For example, if we are in an economic regime when inflation is rising from very low levels (e.g., when coming out of a deflationary recession), stocks will tend to do well as economic activity picks up, boosting demand, while bonds will tend to perform poorly as rates rise. However, when inflation increases at levels that begin to concern investors (as it did in 2022), stocks can perform poorly at the same time bonds do. That was the case in 1969 when the Consumer Price Index rose above 6%, the S&P 500 lost 8.5%, and long-term Treasury bonds lost 5.1%.
Before closing, there is another important issue we need to cover, which has to do with regime changes – changes that can lead to misleading conclusions when examining long-term stock return data because they have reduced the risks and costs of equity investing. When costs and risks are reduced, we should expect that the equity risk premium should shrink.
Regime Changes That Have Reduced The Risks Of Equity Investing, Raising Valuations
Consider the following points:
- In 1913, the Federal Reserve was established with the goal of dampening economic volatility. Reduced economic volatility should result in reduced equity volatility, lowering the premium investors require to take the risks of owning stocks.
- In 1934, the SEC was established with the goal of making the world a safer place for investors.
- Over time, accounting standards have greatly improved. The Financial Accounting Standards Board (FASB) was established in 1973, providing investors with more accurate financial reporting and reducing the risks of equity investing. And in 2002 the Sarbanes-Oxley Act (SOX) was passed with the goal of improving auditing and public disclosure in response to several accounting scandals in the early 2000s, again reducing the risk of equity investing.
- We haven't experienced another Great Depression, and there haven't been any worldwide wars since 1945.
- Over time, the U.S. has become a much wealthier country. This matters because as wealth increases, capital becomes less scarce. All else being equal, less scarce assets should become less expensive. The reduced cost of equity capital reduces the expected return to that capital.
- Over time, the cost of trading (both commissions and bid-offer spreads) has decreased. There are several reasons for this, including the decimalization of stock prices and the provision of additional liquidity by high-frequency traders. In addition, financial instruments that allow investors to buy and sell illiquid assets indirectly (such as index funds and exchange-traded funds) also work to lower the sensitivity of returns to liquidity. These instruments enable investors to hold illiquid stocks indirectly with very low transaction costs, reducing the sensitivity of returns to liquidity. With these innovations in markets, all else being equal, we should see a fall in the equity-risk premium demanded by investors.
In fact, we have seen a reduction in equity volatility. From 1926 through 1993, the CRSP 1-10 total market index exhibited volatility of about 19%. Over the 30 years since then, its volatility was 15.6%. Volatility is one measure of risk. Since volatility, as measured by the VIX Index (referred to as the "fear index"), has been negatively correlated with equity returns (higher volatility leads to lower equity returns), lower equity volatility leads to higher equity returns as valuations rise. The rise in valuations led to equity returns being higher than the ex-ante returns were expected to be. However, those same higher valuations mean that future expected returns are lower as investors now pay more for the same dollar of expected earnings.
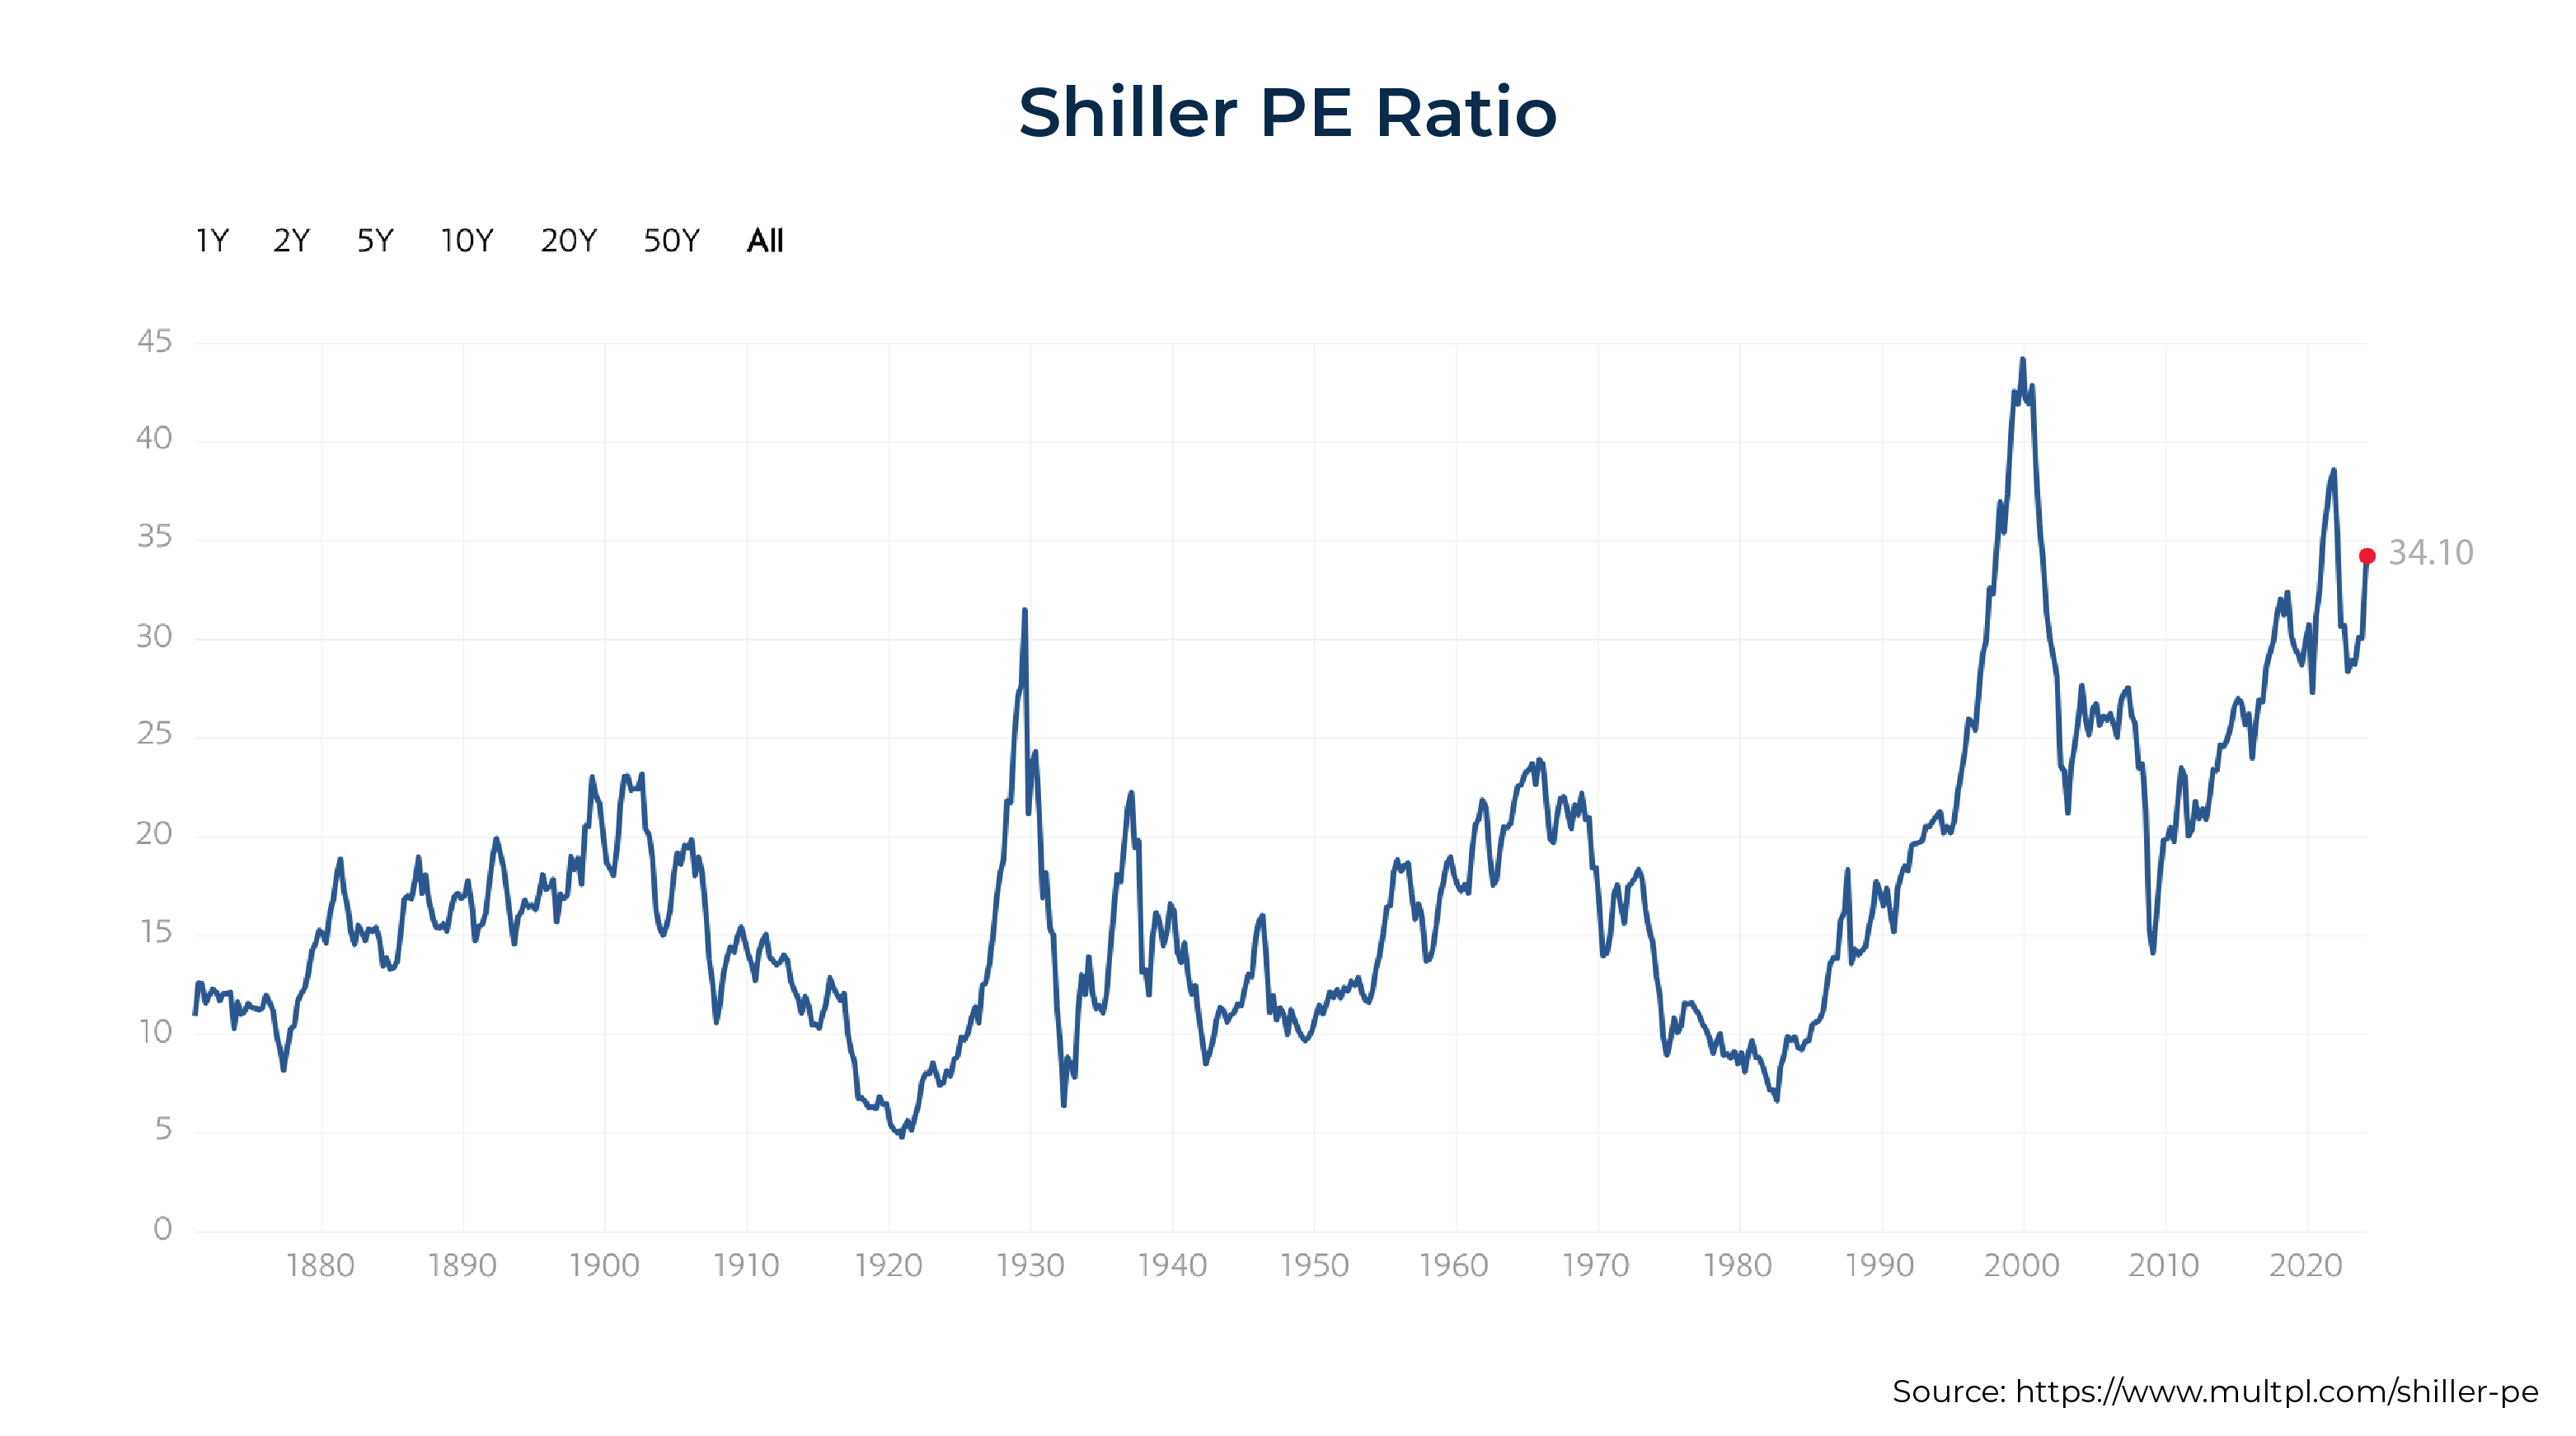
Thus, the same regime changes we discussed that led to rising valuations should cause investors to expect a lower-than-historical equity risk premium because valuations (i.e., the Shiller CAPE 10, the best predictor we have of future expected returns) have been on a long-term upward trend.
As seen in the chart below, as of February 22, 2024, the Shiller CAPE 10 stood at 34.10, almost exactly twice its historical mean of 17.08. A 17.08 CAPE 10 produces a real expected return to U.S. equities of 5.8%, while a CAPE 10 of 34.10 results in a real expected return to equities of just 2.93%. Comparing that to the February 21, 2024, yield on 10-year TIPS of 1.98% ( and 2.11% for 20-year TIPS) results in expected equity performance over a riskless investment of just 1.05% (0.87%).
Given the historical volatility of stocks, it seems hard to make the argument that stocks are highly certain to outperform even over the long term – still likely, but far from certain.
Takeaways
McQuarrie's findings provide several key takeaways for advisors and investors. First, they must accept that stocks will not always beat bonds, no matter the investment horizon. That is only logical because stocks are riskier, and while that risk should result in an ex-ante premium, if stocks always outperformed, there would be no risk and no risk premium!
Said another way, there can be no equity risk premium if stocks are not risky, regardless of the horizon. For advisors and investors, that means that when developing investment plans, they should not consider expected returns in a deterministic manner (the expected return will be the realized return). Instead, they should use Monte Carlo simulations to make sure their plans consider a wide dispersion of potential outcomes and that their plans can survive the left tail of the return distribution.
Second, McQuarrie demonstrated that the outperformance of stocks over bonds has been highly regime-dependent. He also showed that regimes are temporary patterns that can last for horizons – long enough to span investor horizons. In addition, there is neither evidence of how long regimes last nor of mean reversion in returns – regime changes are not forecastable (as the evidence on the persistence of poor performance of active management demonstrates). In other words, advisors and investors should expect "ceaseless variation, as the permutations and combinations of individual asset returns play out".
This leads us to the 3rd takeaway: Since stocks are risky, no matter the horizon, diversification of risks should be a first principle when developing an asset allocation plan.
Fourth, as 2022 demonstrated, there are periods when stocks and bond returns are positively correlated –their correlations are time varying/regime dependent. Thus, bonds cannot be relied on, especially during periods when inflation rises above levels targeted by central banks, to provide ballast to a portfolio.
The Case For Alternative Investments
Given the takeaways proposed by McAQuarrie's work, advisors and investors should be considering moving beyond a traditional 60% stock/40% bond allocation, especially since while stocks only make up 60% of the asset allocation, because they are so much riskier than safe bonds they tend to make up 85% or more of the risk of a 60/40 portfolio! Thus, it is important to consider adding other unique sources of risk (what are called alternative investments), assets that don't correlate highly with traditional stocks and/or bonds.
Among the assets that should be considered are long-short factor strategies (e.g., AQR's QSPRX and QRPRX); reinsurance (e.g., Stone Ridge's SRRIX and SHRIX, and Pioneer's XILSX); senior, secured, and sponsored by private equity floating-rate corporate debt (funds such as Cliffwater's CCLFX); and consumer and small business lending (funds such as Stone Ridge's LENDX).
Note that the relatively recent introduction of what are called interval funds (funds that provide limited liquidity at regular intervals, typically 5% per quarter) has allowed investors to access unique sources of risk in investment vehicles that were previously available only in private (and much more expensive) vehicles.
Instead of building 60/40 portfolios, advisors can build portfolios that are more diversified and have more "risk parity". Depending on the individual investor's risk profile, advisors might recommend a portfolio that was perhaps 45% stocks/15% alternatives/40% bonds or even 35/30/35. And whether the allocation to alternatives comes from the equity or bond side should depend on both the correlation of the alternatives to stocks and bonds and the individual investor's ability, willingness and need to take risk.
 Adding unique sources of risk that meet all of the criteria Andrew Berkin and I laid out in our book Your Complete Guide to Factor-Based Investing (there must be evidence of a historical premium that has been persistent across time and economic regimes, pervasive across sectors, countries, and regions, robust to various definitions, have clear risk- or behavioral-based explanations for why the premium should persist, and survive transactions costs) has historically reduced the tail risk of traditional portfolios while improving risk-adjusted returns.
Furthermore, in our book Reducing the Risk of Black Swans (2018 edition) Kevin Grogan and I provide the empirical evidence demonstrating how adding unique sources of risk has benefited investors.
Larry Swedroe is head of financial and economic research for Buckingham Wealth Partners, collectively Buckingham Strategic Wealth, LLC and Buckingham Strategic Partners, LLC.
For informational and educational purposes only and should not be construed as specific investment, accounting, legal, or tax advice. Certain information based on third-party data may become outdated or otherwise superseded without notice. Mentions of specific securities are for informational purposes only and should not be construed as a specific recommendation. Past performance is not a predictor of future performance. Neither the Securities and Exchange Commission (SEC) nor any other federal or state agency have approved, determined the accuracy, or confirmed the adequacy of this article. LSR-24-626




Leave a Reply