Executive Summary
The fundamental purpose of the so-called “4% rule” is to determine an appropriate “income” or spending floor that is low enough to survive potential sequence-of-return risk – at least, based on the worst return sequences that can be found in the historical data. If market returns going forward turn out to be as bad as scenarios like the Great Depression or the stagflationary 1970s - from which the 4% rule originated - the portfolio is still anticipated to sustain inflation-adjusted spending to the end of the 30-year time horizon. If returns are better, there will simply be “extra” money left over.
Yet the reality is that in the overwhelming majority of scenarios, returns are not so bad as to necessitate a 4% initial withdrawal rate in the first place. In fact, by applying the 4% rule, over 2/3rds of the time the retiree finishes with more than double their wealth at the beginning of retirement, on top of a lifetime of (4% rule) spending! Half the time, wealth is nearly tripled by the end retirement, as retirees fail to spend their upside!
Accordingly, a more dominant approach is to plan in advance that if the portfolio gets “far enough” ahead, spending can be increased - but not increased so quickly that the retiree might have to go backwards shortly thereafter. Of course, the reality is that retirees experiencing a “favorable” sequence of returns will inevitably sit down for a portfolio/retirement review and realize they are so far ahead that it’s “safe” to increase spending anyway. But as it turns out, a relatively simple ratchet-style approach, where spending is increased by 10% any time the portfolio rises more than 50% above its starting value, can “dominate” the traditional 4% rule, generating equivalent or better retirement spending in all scenarios, even while being conservative enough to not require a spending cut in the event of a market pullback in the future.
The Surprising Upside Of A 4% Safe Withdrawal Rate
The origin of the safe withdrawal rate was actually rather straightforward – it’s simply the initial withdrawal rate that would have sustained inflation-adjusted spending in the worst case scenario in (US) history. In point of fact, the historical initial withdrawal rate that would have worked for a 60/40 portfolio over any particular 30-year time horizon has varied between 4% and 10%, and the median is close to 6.5%. But since we don’t necessarily know up front whether the next 30 years will be more like the average, the highs, or the lows, the idea of the safe withdrawal rate was simply to treat every time period as though it might turn out to be the worst.
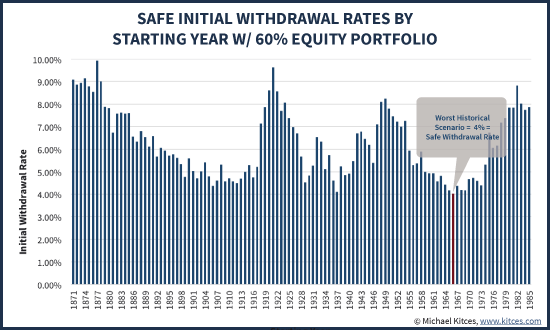
Accordingly, if the next 30 years turn out to be another stretch of horrible market returns like the other time periods that necessitated a 4% initial withdrawal rate, the 4% rule will “work” and the portfolio will make it to the end (albeit just barely). And if the results are better – e.g., a 5%, 6%, or even 10% withdrawal rate would have worked, but the retiree only followed the 4% rule – there will simply be “excess” money left over. Better safe than sorry?
Yet the caveat of the 4% rule is that in reality, the overwhelming majority of historical scenarios do not necessitate a 4% rule, or anything close, and come out with a significant excess of unspent wealth at the end. As noted earlier, the average initial withdrawal rate that would have worked was over 6%. And by withdrawing only 4%, and allowing the portfolio to compound higher, the reality is that the 4% rule actually has a remarkably high probability of leaving over a significant amount of remaining wealth by the end of the 30-year time horizon.
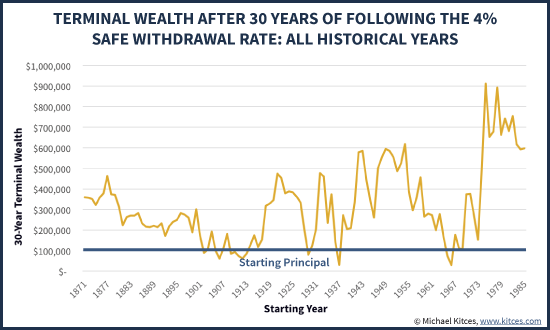
As the chart above reveals, in only 12 of the 115 rolling 30-year time periods running from the early 1870s to present did the retiree who started with $100,000 in an annually rebalanced 60/40 portfolio finish with anything less than the original principal, even after doing a lifetime of inflation-adjusted spending starting at a 4% initial withdrawal rate. And those scenarios that did finish with less were all retirees who had the misfortune of retiring just before a ‘calamitous’ economic event, including the eves before the crash of 1907, World War I (and the post-war inflation spike), the Great Depression (including the second downturn in 1937), and leading up to the stagflationary 1970s. In the “modern era” of markets since the 1920s, such a less-than-starting-principal outcome has only occurred four times: those retiring in 1929, 1937, 1965, and 1966.
In fact, not only do 90%+ of retirees finish with more than their starting principal after 30 years by following the 4% rule (so even if you outlive the time horizon, there’s still funds left over), the “typical” retiree actually finishes with many multiples of their starting wealth with this spending approach! Over 2/3rds of the time the retiree finishes with more-than-double their initial principal left over. And the median wealth at the end of 30 years is almost 2.8X principal! One-in-six scenarios finish with more than quintuple the retiree’s initial wealth! Since the 1920s – the “modern era” of stock investing (as illustrated by the classic Andex Charts based on Morningstar/Ibbotson data) – the odds of doubling wealth is 80% (on top of lifetime spending using the 4% rule), the median wealth at the end of the time period is 3.7X starting principal, and more than 1/3rd of retirees would have finished with over 5X their starting retirement portfolio!
Of course, in some of these situations, final wealth is augmented by decades of compounding inflation. Nonetheless, even on a real (inflation-adjusted) basis, retirees finish with more than 100% of their inflation-adjusted principal 60% of the time, and double their real wealth almost 1/4th of the time, even after supporting a lifetime of inflation-adjusted spending at a 4% initial withdrawal rate!
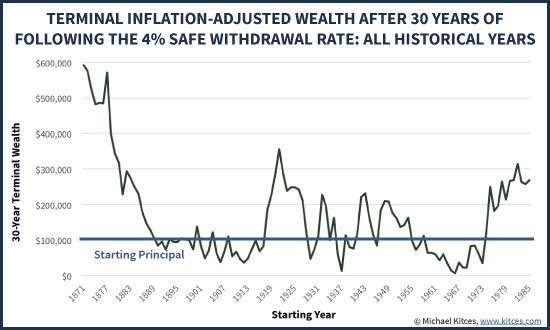
Notably, then, while some have raised the question of whether the 4% rule is “too high” given today’s low return environment (even though the reality is that 4% rule was created for low-return environments, as average returns would allow a nearly 6.5% withdrawal rate!), the alternative criticism raised by some like Bill Sharpe is that the 4% rule is highly “inefficient” because it actually has such a high probability of excess wealth. After all, the data does show that most of the time, following a 4% rule just leaves over many multiples of a retiree’s starting principal left over, revealing (at least in retrospect) that most retirees actually could spend far more, either initially or by increasing spending along the way.
Ratcheted Spending Increases From A “4% Rule” Floor
While the 4% rule was created as a means to set a minimum income floor – a spending amount low enough that, even if “bad” things happen, the withdrawals will be low enough to be sustainable until/as the market recovers – that doesn’t mean spending can never be raised. After all, a few years into retirement, it should be clear whether that adverse sequence-of-return-risk event has or has not occurred. No planner is going to sit down with a client who is 86 years old and retired with $1,000,000, who is now up to $5,000,000 thanks to a great bull market in early retirement, and say “No, you shouldn’t spend a single dime more than $75,000/year, because that’s what your inflation-adjusted spending would be based on that initial 4% withdrawal rate we set 21 years ago” even though that’s clearly far less spending than the account can support given what’s happened during the intervening years. Obviously, at some point, when returns have been good, it’s safe to spend more, and in the real world people can and do make such adjustments.
The caveat is just that such upward spending adjustments were not explicitly covered in Bengen’s original 4% rule research. Instead, it was just “implicitly” assumed, as financial planners (including Bengen himself) still regularly meet with clients on an ongoing basis, that at some point there will be a review meeting where it’s clear that the retiree is so far ahead of the original projections, that it’s safe to spend more. In other words, we know that there will be situations where the results are ahead of the worst case scenario and it’s safe to spend more. But what we don’t know – at least based on the research to date – is how far ahead does the account need to be, in order for it to be “safe” to increase spending and raise the income floor, without the risk of going backwards?
As it turns out, it doesn’t take all that much. A notable consistency amongst all the scenarios where the retiree fully or nearly depletes wealth with a 4% rule (e.g., retiring just prior to World War I, in 1929, in 1937, in 1966, etc.) is that due to early adverse market returns, the account balance never gets much higher than its starting point. Or viewed another way, it turns out that any time the account balance ever grows 50% above of its starting value (after withdrawals), the portfolio is already far enough ahead that it won’t be depleted in a 30-year time horizon and there will be extra money left over.
Accordingly, a simple way to establish a new, higher income floor is simply to commit that spending will only be increased (above and beyond annual inflation adjustments) once the account balance grows 50% about its initial amount. So for a retiree with $100,000, there’s no extra spending increase until the account value is over $150,000. For a retiree starting with $1,000,000, the target is $1.5M.
Of course, the caveat as well is that while growing the account more than 50% above its starting value does allow for “room” to ratchet the spending floor higher, it’s important not to ratchet it up too much or too quickly, or the new higher spending will overwhelm the available assets, even after the early growth, and force a later setback. Thus, for instance, the “rule” might be that any time the account balance is up 50% over the original value, spending is increased by 10% (over and above any ongoing inflation adjustments), but such spending bumps can only occur once every 3 years at most (to avoid having spending ratchet too high too quickly).
As an example of how this might work, the chart below shows inflation-adjusted (real) spending by applying this rule in three different starting scenarios – a retiree starting in either 1966, 1973, or 1982. With the 1966 retiree, the spending “kicker” never happens; due to years of poor market returns and high inflation, the account balance never even gets 20% above its initial starting value, much less to the up-50% target. As a result, a 4% initial withdrawal rate (or $4,000 on a $100,000 portfolio in the chart), adjusted each year for inflation, simply results in $4,000/year of lifetime inflation-adjusted spending with no positive adjustments. For the 1973 retiree, the account balance falls behind initially (with the market crash in 1973/1974), but eventually in the second half of retirement, it has more than fully recovered and finally grows above the 50%-of-starting-balance threshold, resulting in a series of upwards ratchets that occur in the last decade of retirement. In the case of the 1982 retiree, and a bull market from the start, the retiree benefits from a ratchet every three years throughout retirement.
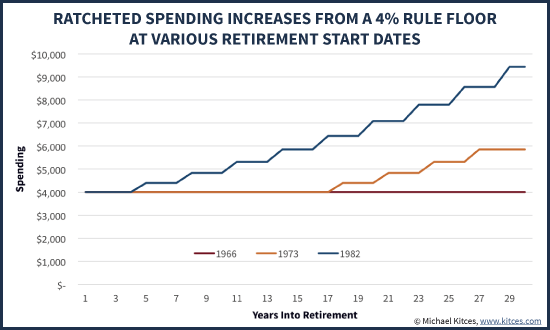
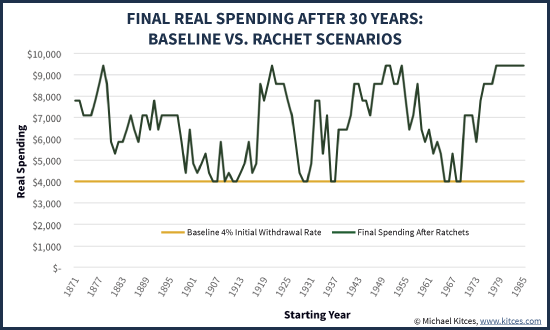
In fact, the ratchet approach increases spending at least once (if not multiple times) in almost all historical scenarios; the only times a ratchet does not occur are the scenarios that had adverse sequence-of-return events, where the portfolio barely had enough money to last for 30 years in the first place. In those scenarios, the positive spending adjustments never occur because the up-more-than-50% threshold is never reached; as a result, even with the potential for spending increases, final spending is simply the same as following a no-increase 4% rule in the first place. The chart below shows these outcomes (assuming an initial withdrawal rate of 4% on a starting balance of $100,000), and how much higher inflation-adjusted spending was in the 30th year with the ratchet approach versus the traditional 4% rule approach; in scenarios where the results are the same (the two lines are both at $4,000), an unfavorable sequence of returns meant there was no upwards spending ratchet ever applied (the account balance never grew to more than 50% above its starting value, and so the ratcheted spending was simply the same as no-increase spending).
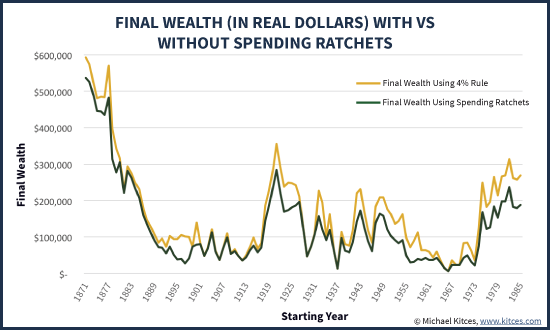
Of course, these ratcheted spending increases along the way do have a “cost” – the cost is that final wealth will be lower, as the retiree is literally spending more of that excess wealth during retirement. Which, of course, is the whole point!
Nonetheless, none of the scenarios run out of money, even with the spending increases, nor does spending ever need to be cut to ensure the sustainability for 30 years. In other words, just as the purpose of the 4% rule is to set spending low enough that even if an adverse event occurs, spending can be maintained, the point of these ratcheting rules is that – like a ratchet – spending adjustments only move in one direction (up) and never backwards, by applying them in a manner conservative enough that they simply maintain an ever-increasing income floor, not unlike setting a rising spending floor with an annuity guarantee (but without an actual annuity contract and the associated cost).
In fact, arguably these particular targets for the size of spending increases and the target threshold to apply them are still “too” conservative, as even with the spending ratchets, many scenarios still finish with significant wealth left over. Nonetheless, the excess wealth is at least “somewhat” diminished - especially in the scenarios with the greatest upside - in exchange for retirees being able to spend as much as double their inflation-adjusted spending throughout their retirement! Of course, in situations where final wealth was already quite low, there are generally no upwards spending adjustments, and final wealth simply finishes at the same level it would have been anyway.
The Ratcheting 4% Rule Is A Dominating Floor-With-Upside Dynamic Spending Strategy
In the world of game theory, a strategy achieves “dominance” compared to the available alternatives when it provides superior outcomes in all situations. In the context of safe withdrawal rates, the “ratcheting 4% rule” can be called a “weakly dominant” strategy over the traditional approach; while the lifetime spending outcomes are not always better, they are usually better, and at worst they are merely the same (and never worse). And because the spending floor moves upwards when it is “safe” to do so, in a manner that never needs to move backwards, it is never triggered in situations that could lead to a more-rapid depletion of assets.
Notably, the idea of “dynamic” spending strategies – as opposed to just using safe withdrawal rates as a blind autopilot program that is never adjusted – is actually not new. Financial planner Jon Guyton did a series of studies in 2004 and 2006 applying what he called the “Capital Preservation” and “Prosperity” decision rules; the former was a rule that allowed for spending to be cut if withdrawals rose to be a dangerously high percentage of the then-current portfolio (because spending growth was outpacing portfolio growth), while the latter was a rule that allowed spending to be increased if portfolio growth was especially favorable.
However, the caveat of dynamic spending strategies like Guyton’s decision rules is that they did include the potential for spending cuts, albeit in exchange for what was a materially higher initial withdrawal rate. For some clients, such spending flexibility is quite feasible, and they are willing to engage in the trade-off of higher initial spending in exchange for the risk that spending may have to be cut in the future.
For others, however, a pure “spending floor” approach is preferred – a scenario where spending increases may happen, but are done in a manner conservative enough to avoid any anticipation of future spending cuts. In essence, the ratcheting 4% rule is done as though the Guyton decision rules are being applied, but using only a prosperity rule and not a capital preservation rule; as a result, initial spending isn’t any higher (as that cannot be “safely” done if no spending cuts are permitted), but future spending can still be adjusted with favorable market results that ratchet spending higher when it’s clearly safe to do so.
Notably, while this simple ratcheting 4% rule dominates the outcomes of the “traditional” safe withdrawal rates approach, there is clearly still room for further research about other/”better” ways to apply ratchet thresholds, as well as the magnitude of the ratcheted spending increases. For instance, given that some scenarios have truly extraordinary excess wealth – e.g., those who retire on the eve of a significant bull market – it may be feasible to apply a second threshold, perhaps more than 200% of initial wealth, where even greater spending increases can be applied.
Nonetheless, while the purpose of this brief study is not to be the conclusive and perfectly optimized version of a ratchet rule, it is a demonstration that such rules can be created and applied relatively easily, in a manner that quickly dominates the traditional approach – or at least, can be applied in a more rigorous manner than retirees simply making ad hoc decision that their account balance is “far enough” ahead without any clear threshold criterion for knowing when to make the change.
In turn, these results also suggest that at least some of the criticism of the “inefficiency” of the 4% rule – a la Bill Sharpe – are based on an inappropriate and overly strict application of the 4% rule as though it’s a blind autopilot program, even though in practice it was likely never intended to be (as Bengen himself was a financial planner who regularly met with and monitored the situation for his retired clients!). In fact, the higher lifetime spending supported by the ratcheting 4% rule is arguably a better baseline against which all future retirement research should compare, given its strategic dominance in all historical scenarios.
So what do you think? Does the ratcheted 4% rule seem like a prudent approach to retirement income, to manage the potential upside of a conservative initial spending floor from a portfolio?


Another possible strategy “if the portfolio gets “far enough” ahead” is to be able to continue a lifetime of spending at the needed/desired rate with a more conservative asset allocation than 60/40. Or, as I sometimes recommend, bifurcating the portfolio into an extemely conservative “spending” portfolio (with enough money in it to just spend all the principal) and a more aggressive “family growth” portfolio (which of course could be invaded by the client if necessary or desired.) Sort of a “buckets on steroids” approach.
So what happens after the spending portfolio is depleted and the family growth portfolio has just gone through a lost decade (i.e., you’ve got about what you started with), or longer, and your clients are still kicking and their cost of living has doubled? Too much in the spending portfolio, and there’s not enough allocated to the growth portfolio for a pay increase down the road. (Assuming the markets perform.) Too much in the growth portfolio, and you’re again exposed to the very risk you were trying to mitigate. Great idea as a sales pitch, but not so much in practice.
So far I have only implemented this with an 82 year old widow. I’m not too worried about her depleting the spending portfolio. Not sure what you mean by sales pitch. She has the spending portfolio in a CD ladder for which she pays no fees.
I really enjoyed the article, and agree that this is a well thought out prudent approach that could be a base from which to build strategies to take better advantage of upside. One word of caution, this strategy only weakly dominates the 4% rule if you accept that the worst case scenario for total return and sequence of return risk exists in your backtest set. Since you cannot guarantee this, there are times when the 4% rule could outperform a ratcheted approach. An example would be a retiree who’s portfolio doubles in year 1, then loses 65% in year 3, and doesn’t recover during their investment timeframe. A 4% portfolio may survive while a ratcheted one may not. Just because we’ve never seen it doesn’t mean it can’t happen. But I think this is the type of risk you should accept given the instruments we have available to us today. The plan should be to mitigate this type of risk through human and social capital (reduced spending, part time work, family, etc).
Very interesting. Wade Pfau has been publishing a lot of research on this recently as well. Similar to the logic of a reverse glide path, the point is that the sequence of returns matters tremendously — and as more actual returns are known, better decisions can be made.
Nice article Michael. Thanks! I have one question. Would you apply the same ratcheting affect if you were planning a 40 or 50 year retirement? My amateur opinion would say yes, as if you’re up 50% then a slight increase should be sustainable no matter the length. Or maybe apply it at a slight discount, especially if you’re in the first decade. Is that the correct way to think about it?
I prefer using a % of portfolio subject to a cap % on previous year income. You reinvest the gains, if any, that exceed the cap. Guaranteed income for life with dynamic spending.
The ratcheting concept makes perfect sense and is a powerful retirement planning tool.
It’s a mistake, though, to tie the ratcheting concept to the 4 percent rule. The default withdrawal rate needs to be tied to the valuation level that applies on the day the retirement begins. At times of moderate valuations, there really is a legitimate 4 percent rule. At times of high valuations, the safe withdrawal rate can drop to 2 percent or lower. At times of low valuations, the safe withdrawal rate can rise to as high as 9 percent.
But all of those numbers can be adjusted as time passes and real-world returns are revealed. The worst-case scenarios are those in which the portfolio takes a big hit in the early years. Even a withdrawal rate a good bit higher than the safe one becomes safe if the portfolio survives 10 years without taking a bit hit. So ratcheting makes good sense in the right circumstances.
Rob
Michael, Excellent discussion, as always.
Has research been done on starting with a portfolio that begins with less than a 60% stock allocation, say a more conservative 40/60 allocation, rather than a 60/40 allocation? Also, has there been updated research on the impact of the current low interest rate environment? If interest rates remain low for a long period, lower returns on the fixed income allocation are likely less than interest rate returns from the period for which the original study was based. Thanks!
Michael,
Great thought provoking article as they so often are. Might not a much simpler ratcheting rule, though, be that you can always start a new “4%” (really 4.5%) period? After all, if I started my 30 period 3 years ago and start a new 30 year period today based on today’s values if they are now higher, I can hardly be taking more risk than I was taking then since I am still 3 years closer to the day I am going to die. It’s rather like “today is always the first day of the rest of your life”, isn’t it?
Michael,
I find that many articles confuse folks when it comes to the 4% rule. Most articles are not clear as to the details, such as, are we talking about gross withdrawal or net after taxes? Are they including investment expenses? As I am sure you know, these issues make a big difference.
I suspect most (as well as yours) are dealing with a gross withdrawal, and not taking into account investment expenses which reduce returns naturally.
I suspect some folks run with the 4% rule and then pay 1% or so in fees, so in other words, they are really spending at a 5% level.
Can you shine some light on this issue?
Love your work!
Paul Ruedi
Interesting article, no surprise there.
I’m surprised no one has pointed out a big problem with the 4% rule, which is that it simply isn’t applicable when one has uneven withdrawal requirements due to variable income flows and/or uneven spending requirements during retirement. This isn’t a theoretical problem; a couple who will be receiving ramped-up amounts of Social Security over time — e.g., no benefits at first, then one spouse’s benefits, then the second spouse’s spousal benefits, and finally the second spouse’s full benefits — will find the 4% (or 3% or 2%) rule useless. (If you don’t believe that, think about how much the couple will need from their portfolio early in retirement vs. later. They might need 6% at first, which seems excessive unless you also know that they will only need 2% once they are receiving all of their Social Security benefits.)
A far better tool is Monte Carlo, which can take uneven cash flows into account. MCS can take into account changes in portfolio value as well, by setting an initial desired probability of success, and running simulations periodically to see what (new) inflation-adjusted withdrawal amounts leads to that same probability of success. When portfolio values are low (high), the withdrawal amount will decrease (increase). Or, if one wants to set a “floor” and only ratchet up, then one can adjust the withdrawal amount only when values are high.
BTW, to Michael’s point about the 4% rule never really being a set-it-and-forget-it rule, anyone who read Bengen’s seminal paper, “Determining Withdrawal Rates Using Historical Data,” could be forgiven for thinking that it was. Bengen wrote [emphasis mine]: “The withdrawal dollar amount for the first year (calculated as the withdrawal percentage times the starting value of the portfolio), will be adjusted up or down for inflation every succeeding year. After the first year, the withdrawal rate is no longer used for computing the amount withdrawn; that will be computed instead from last year’s withdrawal, plus an inflation factor.” That certainly sounds like set-it-and-forget-it.
Great article! Two questions:
1. Is the 50% threshold for the ratcheting rule based on the nominal value of the portfolio, or the real (inflation-adjusted) value?
2. Your historical SWR data in this article and others are significantly more optimistic than what is reported by http://www.firecalc.com and http://www.cfiresim.com. For example, those sources show the historical safemax withdrawal rate (in the worst case starting year of 1966) as 3.67 and 3.34, respectively (with the difference between the two, I believe, due to differences in their methodologies for calculating historical bond returns). Do you happen to know why your data produces more optimistic results than either of these sources?
Thanks!
Yup. He used only nominal withdrawals, which in the case of the 1970s is a pretty bad assumption. Your purchasing power would have eroded substantially between, say, 1966 and 1996. By over 75%. The fact that Mr. Kitces then inflation-adjusts the final value (and only the final value, not the withdrawal) doesn’t make the calculation any more credible. So, with all due respect, this entire line of research seems pretty nonsensical.
That’s not correct. We inflation-adjust all spending each year to run the projections, akin to the other tools. We don’t and have never used stable-nominal withdrawals, for all the reasons you state about the problem with ignoring the impact on purchasing power.
We only separately report the inflation-adjusted final value because some advisors ask to see final results in current dollars rather than future dollars.
But all actual projections are either projected with inflation adjustments, or in the case of many examples in this article, simply projected using real dollars (and inflation-adjusted real returns) in the first place.
– Michael
I get a SWR of between 3.4% and 3.9% with a starting date 1966, depending on the equity weight. Not quite as low as the “BrooklynGuy” above who was using cFIREsim, but still below 4%. My conjecture was that you didn’t do the the COLA over time. But you’re right, that would have raised the the SWR to a lot more than 4%. Still, I’m puzzled what’s the source of the difference: I use S&P500 for equities and the 10y Benchmark total return index.
Thanks!
We’ve found separately that SWRs seem to be slightly higher using T-Bills (essentially 1-year yield rates, assumed to be rolled at par annually) rather than 10-year Treasuries. See https://www.kitces.com/blog/accelerating-the-rising-equity-glidepath-with-treasury-bills-as-portfolio-ballast/ for some of our work on this.
Accordingly, this data set was large-cap US equities (Shiller data), and 1-year yields. We get a slightly higher SWR in 1966 with that data (slightly minimizing the damage of rising rates in the 1970s). Thus the SWR slightly higher than 3.9%. (Sorry, I don’t have exact details of full data set in front of me right now. 🙂 )
– Michael
why not just take 4% of the high water mark rather than wait for a 50% increase? if a portfolio goes from $1mm to $1.2mm you should be able to increase income from $40k – $48k and never run out of money.
The problem with that is that portfolios don’t only go up, they also go down. If you rachet up to $48K and then the portfolio drops down to $1M you are looking at a 4.8% draw. If it drops down to $900K you’re at 5.3%.
fred,
the point of the 4% rule is you never run out of money over a 30 year period even if the market goes down. if you took 4% of the starting value before the depression, you still could maintain after a 50% decline for 30 years. even though to your point, at the bottom you were taking out 8%. so the 4% of the high water mark should hold even if the market drops.
I second tim’s thoughts.
How would a straight (inflation adjusted) 4% initial withdrawal or this rachet compare to re-assessing the 4% each year. If they retire and take 4% in year 1
and the portfolio goes up 10% after their withdrawals, couldn’t year 2
just be a year 1 for a new 30 year period? Example, starting with
$100k, they withdraw $4k and end the year with $110k. The next year
their inflation adjusted withdrawal (+3%) is $4,120. Wouldn’t the same
methodology show that they could start over with a safe “initial”
withdrawal rate of 4% and increase their withdrawal from $4,000 to
$4,400?
I’ll be looking at some versions of this approach as a follow-on study. Stay tuned! 🙂
– Michael
It seems like a good idea to treat every year as year 1. It would be great if you could look at Ken Steiner’s version http://howmuchcaniaffordtospendinretirement.blogspot.com/p/articles-spreadsheets.html
When it comes to dynamic withdrawals, portfolio and longevity are both important. We should not ignore the dynamic nature of the latter.
Good article. good concept. except that it still leaves higher spending when one is older and least able to spend it. If one spends down more in their 60’s when they can enjoy their money more, that leaves less funds for later. Would this concept still apply then?
It is a good idea to spend more when you are most healthy and all of your friends are still alive. Instead of “ratcheting,” consider “front-loading.” http://howmuchcaniaffordtospendinretirement.blogspot.com/2015/04/revisiting-guyton-decision-rules.html
I like this article as it is more progressive than the 4% which might not work well for international wealth builders. It will be interesting to see it go against Guyton’s Guardrail and Zolts TPA methods, which enables a higher withdrawal rate but adjusts downwards.
Kyith,
Functionally, this IS Guyton’s guardrail approach – where you optimize assuming you’ll JUST the Prosperity Rule but not the Capital Preservation rule!
– Michael
ah i see! i tot you are modding this idea with a certain variation but its good u see value there.
A comment and a question. First, the comment: For those seeking to maximize spending in the early years of retirement, consider segregating or siphoning off a “draw down” account that is not part of the long-term asset base supporting retirement income needs. For example, if a client has $3 million, perhaps $400,000 – $500,000 is allocated to travel, enjoyment, funding 529 plans for grandchildren, etc; And the remaining $2.5 million is considered as the asset base used to fund retirement income. Of course, the asset base needs to be sufficient, or the spending needs to be reduced, such that there is enough to cover long-term needs on an inflation adjusted basis. But this is an easy idea for the client, and if you physically segregate the assets, everyone can track the discretionary spending.
Now the question: If there commercially available planning software that implements the ‘guardrails’ planning as discussed in this and other articles by Guyton and Kitces?
I think the rule should be age-adjusted. When you are 75, you don’t have a 30-year horizon, but a 20-year and that’s optimistic. And rather than start with the fear we are in 1929, how about assuming a more normal year and then correcting *if* indeed the first year is another 1929?
Does anyone have a high quality photo of the first graph showing what the safe withdrawal rate would have been in each year using a 60% equity portfolio?