
Executive Summary
Monte Carlo analysis has become a common standard amongst financial advisors for evaluating the health of a prospective retiree's spending plan in retirement. And while the framework itself may be a rigorous way to look at a wide range of potential outcomes, there's one big problem: it's difficult to know how to interpret the results, and what to do with a scenario like a "95% probability of success". Who wants to risk being part of the other 5%?
In this guest post, Derek Tharp – our new Research Associate at Kitces.com, and a Ph.D. candidate in the financial planning program at Kansas State University – delves into behavioral biases and challenges that influence our ability to interpret the results of a Monte Carlo analysis, and in particular the so-called "wrong-side-of-maybe" fallacy.
The wrong side of maybe fallacy refers to our tendency to interpret a projection as "wrong" if the outcome is inconsistent with the most likely outcome forecasted, and can quickly interfere with the proper interpretation and understanding of probabilistic forecasts. Because unfortunately, we have a tendency to try and evaluate the accuracy of a forecast based on a single outcome - if there's a 95% probability of success, and it turns out to be a failure, the forecast must have been "wrong" - even though in reality, the accuracy of probabilistic forecasts can only be evaluated over a series of multiple outcomes (i.e., to see if a 95% probability of success is really success in 19 out of 20 attempts, on average).
Of course, when working with retirees, the reality is that they do only get one shot at retirement. Which means it's unlikely that advisors are going to encounter retirees who are sympathetic to the nuances of proper probabilistic interpretation if their retirement is turning out poorly! Furthermore, the wrong side of maybe fallacy isn't the only psychological barrier to properly interpreting Monte Carlo analysis. Behavioral research suggests that when clients are asked to express their comfort level with a particular Monte Carlo probability of success, rather than giving a response that answers the question at hand, they may be substituting in an expression of their intensity of feelings regarding failure instead. In other words, a retiree's indication of their comfort with a 90% probability of success may actually be an expression of how much they dislike the idea of 10% outcome (e.g., running out of money in retirement) rather than their actual willingness to tolerate the 10% risk of it occurring.
Fortunately, there are steps advisors can take to help retirees avoid misinterpretation of Monte Carlo analysis. From re-evaluating terminology – such as framing Monte Carlo analysis in terms of probability of "adjustment and excess" rather than "success and failure" – to emphasizing the importance of ongoing planning, and using "squishy" language to guard against clients being overly critical in their interpretation of an advisor's advice. Ultimately, if advisors want to help retirees make better decisions when evaluating Monte Carlo analyses, the cognitive and behavioral biases which may interfere with proper interpretation should not be ignored!

The “Wrong-Side-Of-Maybe” Fallacy
The wrong-side-of-maybe fallacy refers to our tendency to assess whether a prediction was right or wrong based on which side of “maybe” (i.e., 50%) the prediction was on. In the world of making predictions, it can have a major impact on our ability to assess the accuracy of someone who offers up a forecast.
For example, suppose you turn on the radio and hear there is a 90% chance of rain today. You make it through the day and there wasn’t a drop of rain. Was the meteorologist wrong?
The answer is “no”, or at least “not necessarily”, but most people say “yes”. Why? Because the prediction turned out to be on the “wrong-side-of-maybe”.
When the forecast for rain is greater than 50% (e.g., 90% in the example above), we tend to say the forecast was “right” if it does rain or “wrong” if it doesn’t. Yet, this is the completely wrong way to look at forecasting. In reality, we can never assess the quality of a forecast based on a single observation. We can only evaluate probabilistic forecasts over many observations.

Unfortunately, though, our brains don’t seem to like this probabilistic way of thinking. We prefer to boil complex things down to a “yes-or-no” forecast of whether rain is likely or not, see if it happens, and judge accordingly.
Another example was the most recent election. How many headlines followed claiming the pundits/models/pollsters were “wrong” for forecasting that Hillary Clinton would prevail over Donald Trump when she actually lost? That narrative was everywhere, but the reality is, Donald Trump’s victory didn’t prove the poll predictions wrong at all, as even those predicting a 95% likelihood for Clinton should still see Trump win 5% of the time… and maybe this was just his 5%. Similarly, Nate Silver of FiveThirtyEight—one of the most widely followed election forecasters—gave Hillary Clinton a 71.4% chance of winning the election as of November 7th, and has since been called wrong given Trump’s victory. But again, Silver’s prediction may have been high, low, or spot on. We simply don't know. Given that Silver gave Donald Trump a 28.6% chance of winning, he should have been expected to prevail 2 out of 7 times!
So why does this matter for financial planners? Well, one of the most crucial things we do for our clients is help them forecast. Whether it’s forecasting income and expenses, tax changes, the potential for a bull or bear market in the next year, or, most commonly, a Monte Carlo probability of retirement success, forecasting plays a significant role in creating a financial plan.
And as we make those forecasts, our clients are constantly evaluating us. Unfortunately for those of us who may wish to be evaluated based on the soundness of our forecasting and advice, there’s little reason to believe that we’ll be evaluated properly – i.e., by looking at our cumulative forecasts and seeing how often our probabilities were right. Instead, the wrong-side-of-maybe fallacy looms large, and our clients are likely to evaluate our forecasts the same way they evaluate a meteorologist – by looking at a single instance that is the opposite of the “most likely” outcome, and deeming the forecast wrong, even if it really wasn’t.
For instance, what will happen when a client was told they had a 99% chance of success and a 1-in-100 scenario occurs? An advisor could have made a perfectly sound projection, but will a client appreciate the nuances of interpreting probabilistic forecasts when confronted with the possibility that they may run out of money? Probably not. More likely, the advisor is going to have a very dissatisfied client. And if their forecast happened to impact many clients, then client satisfaction and retention could be negatively impacted.
Potential Problems Interpreting Monte Carlo Analysis
Unfortunately, the psychological challenges of Monte Carlo analyses are not constrained to succumbing to the wrong-side-of-maybe fallacy in evaluating whether the advisor made the “right” forecast or not. The increased prevalence of Monte Carlo analysis in retirement planning has certainly been an improvement relative to traditionally oversimplified straight-line projections, yet clients themselves may also have difficulty properly interpreting such forecasts as applied to their own situation and drawing appropriate conclusions.
One concern is that it's possible that clients who are asked to express their comfort level with a particular Monte Carlo probability of success may actually be substituting in an expression of their intensity of feelings regarding the failure instead. In other words, we don’t judge a 90% probability of success by our actual comfort with 90% probability, but instead, by how intensely we dislike the potential of the other 10%. Yet saying we intensely dislike the outcome of the other 10% – running out of money, or at least needing to make a material retirement adjustment – isn’t the same thing as evaluating our comfort with taking the risk that it might occur.
Another communication concern identified by Tetlock and Gardner is that people both translate odds into ordinary language and ordinary language into odds, but they often don’t do so consistently. One example of this referenced by Tetlock and Gardner is a story involving Sherman Kent – a former Yale professor who worked with the CIA and is commonly referred to as the “father of intelligence analysis”. Kent and his colleagues at the CIA would examine information and try to formulate predictions that might help the US government. In 1951, each member of Kent’s team signed off on a National Intelligence Estimate sent to State Department officials for review. That report claimed there was a “serious possibility” of attack on Yugoslavia that year. When casually asked what exactly “serious possibility” meant, Kent replied he personally thought about 65%, but was troubled to hear that the State Department official thought the report meant much lower odds. He went back to his team and asked each member how they interpreted the statement they had signed off on. Their answers ranged from odds of 20-to-80 to 80-to-20! If a team of highly trained analysts making serious assessments regarding the risk of war can have this much misunderstanding in probabilistic communication about what a “serious possibility” means, it’s highly likely that you and your clients aren’t always on the same page, either!
In the context of financial planning, this means that using language like “your retirement plan has little risk of running out of money” could still be interpreted quite differently; some might assume “little risk” means just a 1-in-100 chance, while others might assume it means “just” a 20% chance of failure (which is a highly material difference!).
One possible solution is to always express predictions as probabilistic forecasts, but problems can run the other direction as well. Most financial planning software does distil a Monte Carlo analysis down into a single number, but converting numbers to words won’t necessarily result in less confusion. Not only may we apply different subjective meanings to different levels of confidence, but a singular percentage still fails to answer many important questions. What’s the magnitude of failure? Does a plan failure mean merely cutting back on a few luxuries, or is a client left completely broke with no backup plan? How sensitive is a plan to various risks and trade-offs? Is the plan with the lowest risk of failure necessarily the best plan for a client if it has the worst magnitudes of failure when they do (rarely) occur? Unfortunately, oftentimes advisors don’t even know the answers to these questions. Though that’s not necessarily the advisor's fault or an inherent flaw of probabilistic projections – in part, it’s just a reflection of a current generation of Monte Carlo software excessively focused on reporting a single probability of success.
We also know that people display irrational discrepancies in interpreting probabilistic information based on how it is presented to them. For instance, one study found that framing risk information using mortality curves resulted in lower interest in preventative surgery relative to using survival curves, even though both were based on the same probabilistic forecasts. For instance, researchers have found that people make different medical decisions when told they have a 30% chance of survival (positive framing) versus a 70% chance of death (negative framing).
It’s also important to recognize that it may not just be clients who struggle with probabilistic thinking; even the most technically competent advisors may struggle to overcome the wrong-side-of-maybe fallacy and other probabilistic biases. While there is still a lot we don’t know about cognitive bias mitigation, we do know that knowledge alone is not always enough to overcome bias. In fact, in some instances, knowledge can make biases even worse! For instance, when it comes to framing medical outcomes, physicians can be impacted just as much as their patients, and one study found that physicians are more supportive of treatments when they are framed in terms of gains or relative reductions in risk rather than losses or as absolute reductions in risk. And the effect may well be present for financial advisors as well; are you more comfortable if a client has a 90% probability of success, compared to a 1-in-10 chance of running out of money?
Addressing Probabilistic Biases
While you don’t have to spend too much time reviewing the literature on probabilistic decision-making within the medical setting to realize that addressing probabilistic biases is complex and there’s still a lot we don’t know, there may be some steps advisors can take to try and help their clients (and themselves) make better decisions.
Reevaluate Terminology
How advisors frame Monte Carlo results matters. As noted earlier, using actual percentages rather than words to describe results (like “very likely to succeed” or “little risk of failure”), can help. Reframing the description of outcomes can help, too. We most commonly talk about probabilities of success or failure, but saying “probability of adjustment” and “probability of excess” as alternatives can provide more practical insight into the actual consequences that result from various outcomes.
After all, while it’s true that Monte Carlo analysis captures the percentage of plans that “fail” (i.e., run out of money), a Monte Carlo analysis also assumes clients will charge forward blindly and fail to make any adjustments along the way. In many cases, relatively minor adjustments can “save” a plan, and “probability of adjustment” may more accurately convey the consequences of encountering an unfortunate combination of circumstances. Similarly, “probability of excess” better captures the reality that “successful” iterations of a Monte Carlo analysis often aren’t just “successful” in not running out of money, but leave significant “excess” assets behind. This may be favorable as a means to hedge longevity risk or leave assets to heirs, but framing the probabilistic decision as one between “excess and adjustment” rather than “success and failure” arguably gives a client a clearer understanding of the alternatives ahead of them.
For instance, consider a scenario in which the initial Monte Carlo analysis for a retiree showed a 50th percentile outcome of having the portfolio last all the way to age 90. Further, suppose that an individual encounters an actual retirement path that results in running out of money at age 85, as indicated below.
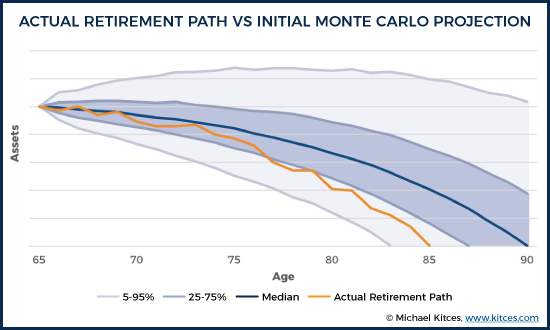
It's worth noting that just because the retiree ran out of money at age 85 does not mean the initial projection was "wrong". The original analysis did project a roughly 15% chance of depletion by age 85. A single instance of running out of money 5 years short of 90 doesn't mean it was wrong to project that the portfolio would last to age 90.
Of course, with an ongoing monitoring process, it would have been clear along the way that the portfolio was already veering off in the less-likely-but-possible direction of depletion by age 77, when the portfolio that started out with a 50% chance of making it to age 90 dipping down to the 25th percentile. Rather than blindly staying the course, the retiree would have an opportunity to make an adjustment at that point, getting back on track to sustain the asset base longer.
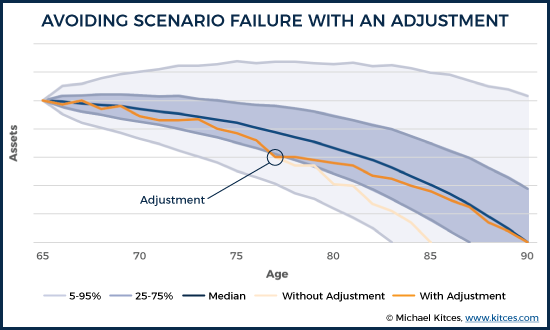
At a minimum, framing the outcomes in less extreme terms (adjustment vs excess rather than failure vs success) may reduce the intensity of retirement-related fear, and make it easier for clients to evaluate their situation more objectively. Especially since highly adverse "running out of money early" scenarios rarely happen terribly suddenly. With ongoing monitoring, and continuously updated Monte Carlo analyses, a portfolio that is veering off track will be evidenced by a probability of success that steadily declines over time (prompting spending to adjust before "failure" is assured).
Emphasize The Importance Of Ongoing Planning
Clients should understand planning is not a one-time occurrence. One advantage of focusing on “probability of adjustment” is that it implies that there’s a continued need to monitor and evaluate potential adjustments. Additionally, monitoring the trend in the probability of adjustment (or success) over time may provide more valuable and motivating feedback for clients – particularly those who have significant time before retirement.
Suppose a couple in their 40s is way behind pace and their plan shows a 30% probability of success. Further, suppose that over the past year they paid down some debt and increased their savings. What’s likely to be more motivating: Telling them that despite their efforts over the past year, they still only have a 35% probability of success? Or, instead, telling them that their probability of success increased 5%? Ultimately, some combination of both messages is probably needed (i.e., they need to know they are behind pace but moving in the right direction), but the point is, the trend may actually be more important than a client’s position at any given time, and the trend can only be analyzed through ongoing planning.
In addition, ongoing monitoring can help to spot potential problems before they become serious. For instance, if a plan has a 10% probability of adjustment, and the next year it rises to 15%, that means the client has at least started down that 10% path – such that the risk is rising – but is also still early enough that a moderate adjustment can get them back on track.
Present Information In More Than One Way
In a review of published literature on describing treatment effects to patients, researchers found that methods for describing probabilities of side effects and treatments need careful consideration, and their main takeaway for physicians was that treatment effects need to be communicated to patients in multiple ways. They found that presenting information in more than one way increased the likelihood that patients would understand the information being presented and make informed decisions.
In the context of retirement planning, this might mean presenting probabilities of adjustment and excess, but also a visual look at the range of retirement outcomes and potential paths that might occur. It could also include scenario planning to look at how making upfront or mid-course adjustments can improve the situation or a look at how sensitive the outcomes are to adjusting the planning assumptions in the first place.
Consider Using Squishy Language
Superforecasters highlights the fact that many people use “squishy language” to avoid being held accountable for their predictions.
We see this often from people who make bold assertions in the media. For instance, in January of 2012, Harvard economic historian Niall Ferguson’s claimed that: “The Greek default may be a matter of days away.” Yet, Tetlock and Gardner note that Ferguson’s statement provides many ways to avoid criticism and being proven “wrong” about the prediction. First, “default” has both colloquial and technical definitions. Second, Ferguson’s use of the word “may” also necessarily implies that it may not. While this isn’t a problem in itself, without any actual probability assigned, Ferguson could retroactively claim that he either meant there was a high or low likelihood of occurrence, depending on the outcome. Finally, “matter of days” provides no definitive and measurable guidelines. He could mean 3-days, 30-days, or 300-days. Without a more precise statement, we have no way of knowing.
The point isn’t to pick on Ferguson’s squishy language (which may equally be the fault of the interviewer for not demanding a more precise answer), but to acknowledge that forecasters can and often do get away with fuzzy predictions using squishy language, and minimize their responsibility for being “wrong” about their prediction.
In the context of financial planning and Monte Carlo analysis, explaining risks as a probability of “adjustment” instead of “failure” is one form of squishy language, as it dampens the severity (adjustment is ostensibly less severe than failure), though it doesn’t necessarily explain what the adjustment might be (and whether it might still be quite severe). Ongoing updating of the financial plan, where the probabilities are only likely to move slightly from year to year, and therefore can merit an intervention before a seriously bad outcome occurs, is another way to minimize the risk that the forecast is ‘proven’ wrong.
Obviously, these techniques also present some serious ethical considerations for advisors. While squishy language may help guard advisors against their clients’ fallacious use of wrong-side-of-maybe reasoning, or their own imprecise application of probabilities, there’s a clear risk of breaching of fiduciary duty by misleading clients if the advisor is trying to avoid accountability altogether – particularly when that ambiguity interferes with a client’s ability to make an informed financial decision. While helping clients avoid wrong-side-of-maybe reasoning is certainly a legitimate goal, it shouldn’t be used to pursue self-serving ends.
Ultimately, the role of the financial advisor in “de-biasing” a client’s various behavioral biases is both important, and under-researched, when it comes to the best communication techniques to do so effectively and ethically. Nonetheless, the first step is to at least recognize and understand the kinds of behavioral biases that may be at work, to spot opportunities to clarify that the client really understands the information and decision being presented to them… and, perhaps, to reduce the risk that the advisor is inappropriately blamed for the client’s own biased misunderstanding of that information or decision.
So what do you think? Have you ever had a client fall victim to the wrong-side-of-maybe fallacy? Do you think clients struggle interpreting Monte Carlo analysis? What can advisors do to communicate a Monte Carlo analysis more clearly? Please share your thoughts in the comments below!

All of this makes sense until we hit the technological singularity.
Just like everyone who thinks their own house is worth more than the average price on their street, everyone also expects to outlive whatever I tell them their life expectancy is. SO advisors face a bias in that if they only used the data, the reality in the clients head about life expectancy is usually different.
One development I see is that 20 years ago Money magazine had financial advisors recommending a certain withdrawal rate to the life expectancy. Such a strategy would of course fail about 50% of the time. Fortunately, there is now more understanding in the financial press about life expectancy.
First I want to commend the author for a well researched and well presented paper. Unfortunately, it is based on a fundamental biological assumption that may soon be overturned, just as digital communication was absolutely limited to 300 baud before the inadvertent discovery of chaos theory which overturned that “natural law’s” effect.
If I am to believe my son, who is in a biotech start-up, there are a lot of dollars betting that sineace (genetic aging) can be overcome. Considering what is and has already happened in genetic engineering the only surprise to me would be that it did not happen at some point. Yes, it may not be the sixty-somethings like me who reap the benefits, but at least for the relatively wealthy, extensive life extension may well be in the works. We have already changed our client joint life expectancies to 100, and structure portfolios and withdrawal rates whenever possible to create an endowment effect instead of an annuity effect.
There are more than a few venture capitalists who believe that within the next 30 years on the outside, a genetic modification that will reverse sineace will be found. That means that if the article’s natural maximum life expectancy of 115 becomes reasonable, a person younger than 85 today could have a shot at life extension if he or she had the wealth to do so. Even if they are wrong and the discovery is 50 years in the future, then a person who is 65 today might need the money to pay for it.
Add in the uncertainty of market conditions, and the ability to bring a portfolio to a “soft landing” on the day the second member of a couple dies approaches non-existence, I have played around with historic market scenarios and found that once the total portfolio value starts decaying and the resultant withdrawal rate rises the decline can become precipitous abruptly in about half the historic scenarios I tried over the past 36 years. Holding the portfolio with a target of at least a nominal dollar constant value is about as close to preparing for the limited life span you so well explain.
Derek maybe you can speak to why I keep seeing different ages thrown around for mean life expectancy of 65 year olds.
The Kitces article you linked to implies age 83 for males, 86 for females and 90 for joint. Other pieces I come across say as high as 88 for males, 89 for females, and 94 for joint. Most seem to be around 86-87 for males, 87-88 for females, and 92-93 for joint.
Now I know that tables used by private industry (CSO, etc.) are more reliable than government (social security), but thats about it.
Any chance you can add some more color.
Among those surviving to their life expectancy, increasing portions will live with dementia. How can we accommodate for the cost of surviving with dementia?
Just for fun … list of verified oldest people and their ages … note many are still alive! https://en.wikipedia.org/wiki/List_of_the_verified_oldest_people
Not to mention the effects on Social Security and Medicare.
After explaining a Monte Carlo simulation and the range of possible outcomes, before asking their interpretation, I will add that I like to make recommendations that target a 60-80% probability of success because lower than that introduces more sequence of returns risk and if we get up around 90% or more, the most likely scenario is that their $1M at the start of retirement ends up around $2M-$5M and might look back and realize they could have spent more early in retirement.
If you will pardon a comment from experience, after 35 years doing financial plans and clients who indeed now have millions of dollars, I have yet to hear the first complaint from any of them about having too much money now. I have heard and suffered through complaints from those whose outcomes were far worse than the worst case Monte Carlo illustration we did back in the 90’s.
I appreciate that insight. My objective is trying to help frame the conversation and decision making process upfront. If your clients knew 20 years ago that they would have too much money now, would they stay on the same path or consider spending a little more?
I know you might consider this odd, but I have asked them that question and in this admittedly small sample of the public, they have uniformly stated that they would have not spent more and are very happy they did not.
There are, of course, some qualifiers here. The clients we have who have gone from a comfortable level to now having substantially more than that are classical “savers” who derive a great deal of comfort from a portfolio value twice what even a conservative estimate would call for. They have experienced both the 2000-2002 and the 2008-2009 market declines and have incorporated into their personal, internal “Monte Carlo” estimates a <50% market decline. They consider a combination of significantly higher interest rates and an equity market panic to be a very reasonable future event and wish to be cushioned against it.
The ones who got into trouble and were quite unhappy fell into the definition of classical "spenders" who indeed were concerned they would spend too little. Those investors saw a doubling of their investment portfolio as cause to double their spending level, and were quite insistent about it. In every case where there was significant unhappiness, the wealth either came from inheritance or lucky chance, e.g. working at DELL in the "golden years" when employee stock options created "Dellionaires."
I recall a famous economist (but inexplicably can’t remember which) saying that given all the inherent uncertainties of life, trying to push confidence above 85% is essentially a fool’s errand. I suspect he might be right.
First, this was a good article and addressed what it addressed in a very rational manner. (Do you hear the “but” coming?)
But… Inputting the data available in the mid to late 1990s and running a Monte Carlo analysis on a portfolio results in a predicted set of outcomes that today would be considered absurd. In fact, an 8% annual withdrawal rate adjusted for 3% future inflation can easily produce a 95% probability of success. Drop the withdrawal rate to 6% in a moderate-allocation portfolio and the success probability rises to around 99.9%. In short, according to the Monte Carlo analysis, there was a less than 1/10 of one percent chance of failure.
There were several articles that ran in the Journal of Financial Planning which indicated that an historical analysis of market behavior taken from the data bases used by Frontier Analytics and by Ibbotson’s analytical software indicated that two 50% or greater drops in the S&P 500 in the decade following 1999 was something like a 16th standard deviation probability. In other words, the universe is not yet old enough for that to have had a 50% probability of happening.
There were more than a few financial planners and retirees in the late 1990s and going into 2000 who, based on Monte Carlo analysis, considered their investment and retirement plans “ultra-safe” and unfortunately made long-term commitments for the planned cash flow. What followed, of course, has been described as not one, but two “black swans:” events that were outliers to such a degree that no statistical forecast would consider them a realistic probability.
It might be better to simply design a portfolio and an income plan that used asset allocation history to find the worst possible scenario, e.g. retiring in mid 2000, or in late 2007. For whatever it is worth, there was another article in JFP several years ago that explained why even nuclear physics no longer uses Monte Carlo to forecast probabilities.
I strongly suspect if there was a study of actual versus probability predictions of Monte Carlo illustrations the Monte Carlo predictions would be shown to be quite seriously misleading.
You nailed it Loden. I run a second plan as a backstop through a program that utilizes past market cycles. Good analysis.
In the reports I look at there tends to be a pretty strong correlation between withdrawal rates and Monte Carlo success rates.
In eMoney, you can also customize rate of return and standard deviation numbers that go into the Monte Carlo simulation. To be conservative, we reduce the rate of return without reducing the standard deviation.
Monte Carlo simulations, yes, have become chic w/ fin planning. And they are tissue paper.
When I studied statistics for managers it made sense; if you have processes you can control, e.g., mfging, service processes, you can control the sample space. You can make corrections. Six Sigma is just the application of empirical statistics.
But you have no idea what the future population of returns will be and cannot control that space, so you can’t get a valid sample. This is a priori statistics and I’m surprised very smart people… ones of talked at length to… just don’t get this obvious point when predicting the opinions of billions of people across the world with information you don’t have access to. It’s not like adjusting a machine for a deviant part… which you can control.
Use historic returns for diversified assets (like the DFA Matrix book or a database), inflation adjust them on an Excel spreadsheet (you can make one and update it each year for each risk adjusted portfolio)
and show the client what would have happened at any given point in time, from any given date had they invested their money. You can also do a withdrawal adjustment on top of the inflation adjustment. Show them 3 or 4 of these scenarios you and say, ‘We can’t have any idea of what the future holds, but if it’s like the past it could be this, this or this.” It’s not as ‘clever’ and impressive, but it’s certainly more honest than the wizard behind the curtain.
Hi, Michael,
You are spot on! We’ve created an application that runs historical simulations of the exact sort you describe. I think you’ll find it superior to Excel…
If you’re curious, please check it out and maybe we can connect and exchange ideas? Our contact details are on our site. http://www.BigPicApp.co
I’m the firm’s founder, Ryan McLean. Cheers.
Of course all of this uncertainty can be completely removed by focusing on known sources of guaranteed income. Start with maximized Social Security, add any pensions, and then employ a fixed index annuity for the rest. AIG has a killer product that if you hold it for 10 years will provide 8%-10% of initial premium as income for life on a joint and survivor basis. Add to that the fact that it has 10% liquidity every year, and if death occurs prior to beginning the payout or depleting the account, the balance of the annuity value goes to beneficiaries, and it can’t be beat. If you are 60, and have taken care of 70 and beyond, you can now do some simple math for the 60-70 ages and wallah! you have a retirement plan that will hold up for however long you need it.
It discourages me when I see someone trying to push insurance GICs in this kind of venue.
If you’re looking to eliminate uncertainty over a 10 year period, and you have 10 years, and you or the client understands the power of a globally diversified portfolio a GIC is generally superfluous. But if you or the client insist, Michael had a great article sometime back on how to build your own GIC or one for a client (if you’re willing to take clients who don’t understand capital markets, or you don’t understand the power of globally diversified portfolios yourself). You get full liquidity in addition.
The discount rate on any of these GICs is always rather poor compared to a fully equity position in a globally diversified portfolio for any 10 year year rolling period since 1973 (i.e, the period for which we have this data). This is fine if you have 10 years which anyone buying a insurance company GIC will have to have.
If you’re looking to guarantee income any time in the next 3 or 5 or 7 years then just create your own GIC and then just buy an immediate annuity from an insurance company at the end of your self-created GIC as needs require. The overhead costs are very low. And you won’t have expensive add-ons like guaranteed death benefits and liquidity guarantees. Just pure income insurance.
Great article. Reminds me of statistics class from years ago – The teacher was trying to explain to the students that the odds of winning the lottery were one-in-several million. But one genius insisted that the odds were actually 50-50 – “either you win or you don’t”…
Hi Michael,
Great topic! You should consider turning this particular topic into one of your available presentations. Perhaps present it at FPA NorCal this year? As you mentioned, you could expand the discussion by showing examples of how mid-course financial adjustments change the possible future outcomes to more desirable PoS (or PoA).
I read with interest the article on Monte Carlo analysis. I am not a professional, I am retired and living on my investments, Social Security and pension. I first became aware of Monte Carlo several years ago and instinctively understood the usefulness of the concept without completely grasping the math. I was trying to maximize my probability of having enough money while spending as much as prudent. I have run simulations often ever since, more recently through “Financial Engines” and then through Vanguard, who apparently bought them. I continue to use it to analyze my situation today. With the way Vanguard has set it up, I can input allocations, dollars, years and spending and calculate probabilities of success and failure.
I first of all understand that I am not predicting the future. The numbers are probabilities, not predictions. However I can use those probabilities to gamble my nest egg if I am willing to accept what the numbers represent. To me they represent knowledge that I would not otherwise have. I have to decide what level of failure is acceptable and have a plan for that probability. With that, then I can adjust my spending to the most prudent level. The rest is up to all the factors that effect my money – markets, nature, governments, etc.; everything that went into the Monte Carlo simulation.
Try firecalc. It allows for more options for both the soon to be retired and already retired (social security future start dates and amounts, flexibility on retirement start dates, options for inflation rate, many more options for portfolio design/construction, lump sum add-ons). I’ve been using this calculator since the early 2000’s.
cFIREsim is also an interesting alternative calculator as well. Enjoy!
This one is very good too!
Portfoliovisualizer
In your Executive Summary, you state that “Behavioral research suggests that when clients are asked to express their comfort level with a particular Monte Carlo probability of success, rather than giving a response that answers the question at hand, they may be substituting in an expression of their intensity of feelings regarding failure instead. In other words, a retiree’s indication of their comfort with a 90% probability of success may actually be an expression of how much they dislike the idea of 10% outcome (e.g., running out of money in retirement) rather than their actual willingness to tolerate the 10% risk of it occurring.” In writing this you seem to be implying that this is not the way that a person should evaluate their risk tolerance. I beg to differ…this is exactly what a person should use to evaluate their tolerance of a risk (or actually half of it). The decision about tolerating a risk scenario should be effectively an expected value decision, weighing the probability of success and its positive value to the person versus the risk of failure and its negative value. So for example I might be willing to go for a nice long walk in a city where I judge that I have a 10% chance of getting rained on, but likely would not go if I judged that I had a 10% chance of getting mugged. The odds of a successful walk are the same, but the difference in my tolerance for the 10% risk of failure has to do with the intensity of my feelings about the failure. A 90% chance of success is meaningless without an evaluation of the cost of failure. Similarly we have to consider the value of the success scenario. So in that same city, if I judged that the positive value of the walk were high enough (say, I knew where to find the last ticket for the tour of Willy Wonka’s chocolate factory) I might be willing to take that 10% chance of being mugged. Written simplistically, POS * Vsuccess – POF * Vfailure = EV = decision.
Okay, having said that, the reality as you have pointed out, is that POF is really the probability that an adjustment to the withdrawal scheme needs to be made. So it is this that needs to be substituted for Vfailure in the EV risk evaluation, decision-making process. Thus providing the customer with a quantitative estimate of the potential magnitude and timing of realistic withdrawal adjustments is how to give the customer the information s/he needs to make a rational risk evaluation decision.
By the way, very nice article!