Executive Summary
In order to deliver the best service to their clients, financial advisors often take on responsibilities beyond giving financial advice, including compliance, marketing, team management, and other operational duties. With only so many hours in a day and demands coming from every direction, it can be challenging to prioritize the most important things for growing an advisory firm. As a result, advisors can find themselves busy all day, month, or even year without making meaningful progress on their most important goals.
A key challenge in regaining control of time is identifying exactly where the time is going. Job responsibilities often shift as firms grow and scale, with new tasks added faster than they are delegated, automated, or eliminated. Over time, this can easily lead to overwhelm – or, eventually, even burnout. While this risk can be prevalent in any role, founders and lead advisors may be particularly susceptible due to the sheer number of responsibilities they manage.
To regain control, advisors can begin by tracking their time with various software tools such as Toggl or Harvest. Many of these tools are easy to integrate into daily workflows, requiring minimal effort to log and categorize tasks. Simply recording hours worked and categorizing tasks can help advisors get a clear picture of the total hours they're actually working, where the time is going, and how long each task takes. Over time, patterns may emerge, revealing potential opportunities to reduce inefficiencies such as task-switching and interruptions of deep work periods. Additionally, time-tracking can provide valuable qualitative insights, such as identifying which weeks felt energizing versus overwhelming – and why.
For advisors who tag and categorize their work effectively, time-tracking can yield even deeper insights. For example, they might discover they are spending significantly more time on administrative tasks than expected, suggesting a need for support staff or automation. Comparing activities against benchmarking studies (such as the Kitces Research on Advisor Productivity) can reveal additional areas for improvement. Advisors can also gain further insight using tools like the DRIP matrix (Delegate, Replace, Invest, Produce) to categorize tasks based on their energy requirements and revenue potential, helping to identify which activities to delegate, eliminate, or prioritize. This structured approach provides clarity on which tasks are most energizing and income-producing – and which are not – helping advisors realign their efforts for greater productivity and satisfaction.
Regaining control of one's time is not a quick process. The difference between a productive advisor and one who is struggling often comes down to making small, incremental changes in how their time is managed. However, by using time-tracking software and staying committed to improvement, advisors can gain clear, actionable insights that lead to significant progress over time. And with a positive attitude and determination, even small adjustments can lead to meaningful results!
To deliver the best service to their clients, financial advisors often have to take on responsibilities that go beyond giving financial advice. An advisor's day may also be filled with compliance work, marketing, managing other team members, and other operational duties alongside their client-focused tasks.
In some ways, this diversity of duties isn't all bad. Even in firms with highly optimized processes that allow advisors to focus solely on prospecting and client servicing, few people thrive on doing only 1 or 2 tasks all the time; a mix of responsibilities can provide variety and engagement. For most advisors, however, their issue isn't overoptimization – in fact, it's likely the opposite. With only so many hours in a day and demands coming in from every direction – clients, team members, prospects, coaches, and others – focusing on the most important things can be a challenge. Advisors might end the day feeling that they've been busy all day… and yet their most critical priorities didn't get addressed.
Advisor Jobs Change As The Firm Changes, And Our Understanding Of Capacity Often Lags Behind
It is often difficult to pinpoint exactly where one's time is going, especially in small business environments where roles and responsibilities can shift quickly. Consider, for example, how an advisory firm founder's role evolves over time:
David started a financial planning firm in 2019. He spent the first year building marketing pipelines, finding prospects, and refining his firm's branding and value propositions. After a few years, the inflow of prospects became more consistent and his client base grew. Soon, David was leading a small team of contractors and full-time employees.
On the one hand, this was exactly what David had envisioned – growing and scaling his firm, including managing employees, was great! It was like a dream come true. On the other hand, David was busier than ever, juggling increasing demands (Compliance! Marketing! Management! Networking!). Work days often went long and crept into weekends, and everything on David's plate felt like "the most important thing". Which made each day packed and productive – but also overwhelming.
In a way, things were starting to feel good – because of the professional achievement of building a thriving firm – yet they were also starting to feel bad – because there was less and less time to manage it all!
The firm founder's role is perhaps the clearest example because the process of building and scaling a firm so visibly reshapes their responsibilities. But the reality is that when firms grow and scale, everyone's role changes. This is further amplified by shifts in staffing, evolving responsibilities, and a firm culture that encourages team members to step up, down, or move 'sideways' into different roles.
Furthermore, employees are often eager to contribute to the firm's growth, which can lead to taking on additional responsibilities. This is great – until a job grows from 'just' servicing clients to servicing clients and leading tax prep… and training a new paraplanner… and writing the monthly client newsletter!
At this point, a person's capacity becomes stretched to the limit. They may not yet be burned out – since burnout usually requires a sustained period of overwork and stress – but they may be on the verge unless something changes. And, ironically, when someone is over-capacity, it can become even harder to find the time to evaluate and correct how their time is being spent.
How Task Drag Impacts An Advisor's Ability To Delegate
A person's capacity often becomes overwhelmed when new tasks and responsibilities are being added faster than current tasks are being delegated, automated, or eliminated. (I'll pause here for you to note, "OK, thank you, Sydney, but it's more complicated than that." And you'd be right – it is more complicated than that, but not much. Stay with me.)
Let's take a moment to acknowledge the psychological factors that make delegation challenging:
- Especially for firm founders, busyness often feels intrinsically tied to survival – keeping the lights on and paying the bills. The idea of an empty (or emptier) schedule can be terrifying.
- While the "lifestyle practice" community values work-life balance, there's also a broader culture that equates visible busyness with success. Full calendars, large teams, full travel schedules, and other tangible metrics of activity are often seen as proof of achievement.
- Fear Of Loss Of Quality. If an advisor has been doing a task since the firm's inception, they may have difficulty letting it go – especially when it directly impacts client satisfaction.
- Loss Of Efficiency. Yes, others could learn how to do the task, but they wouldn't do it as quickly, even if they managed to do it as well as the advisor.
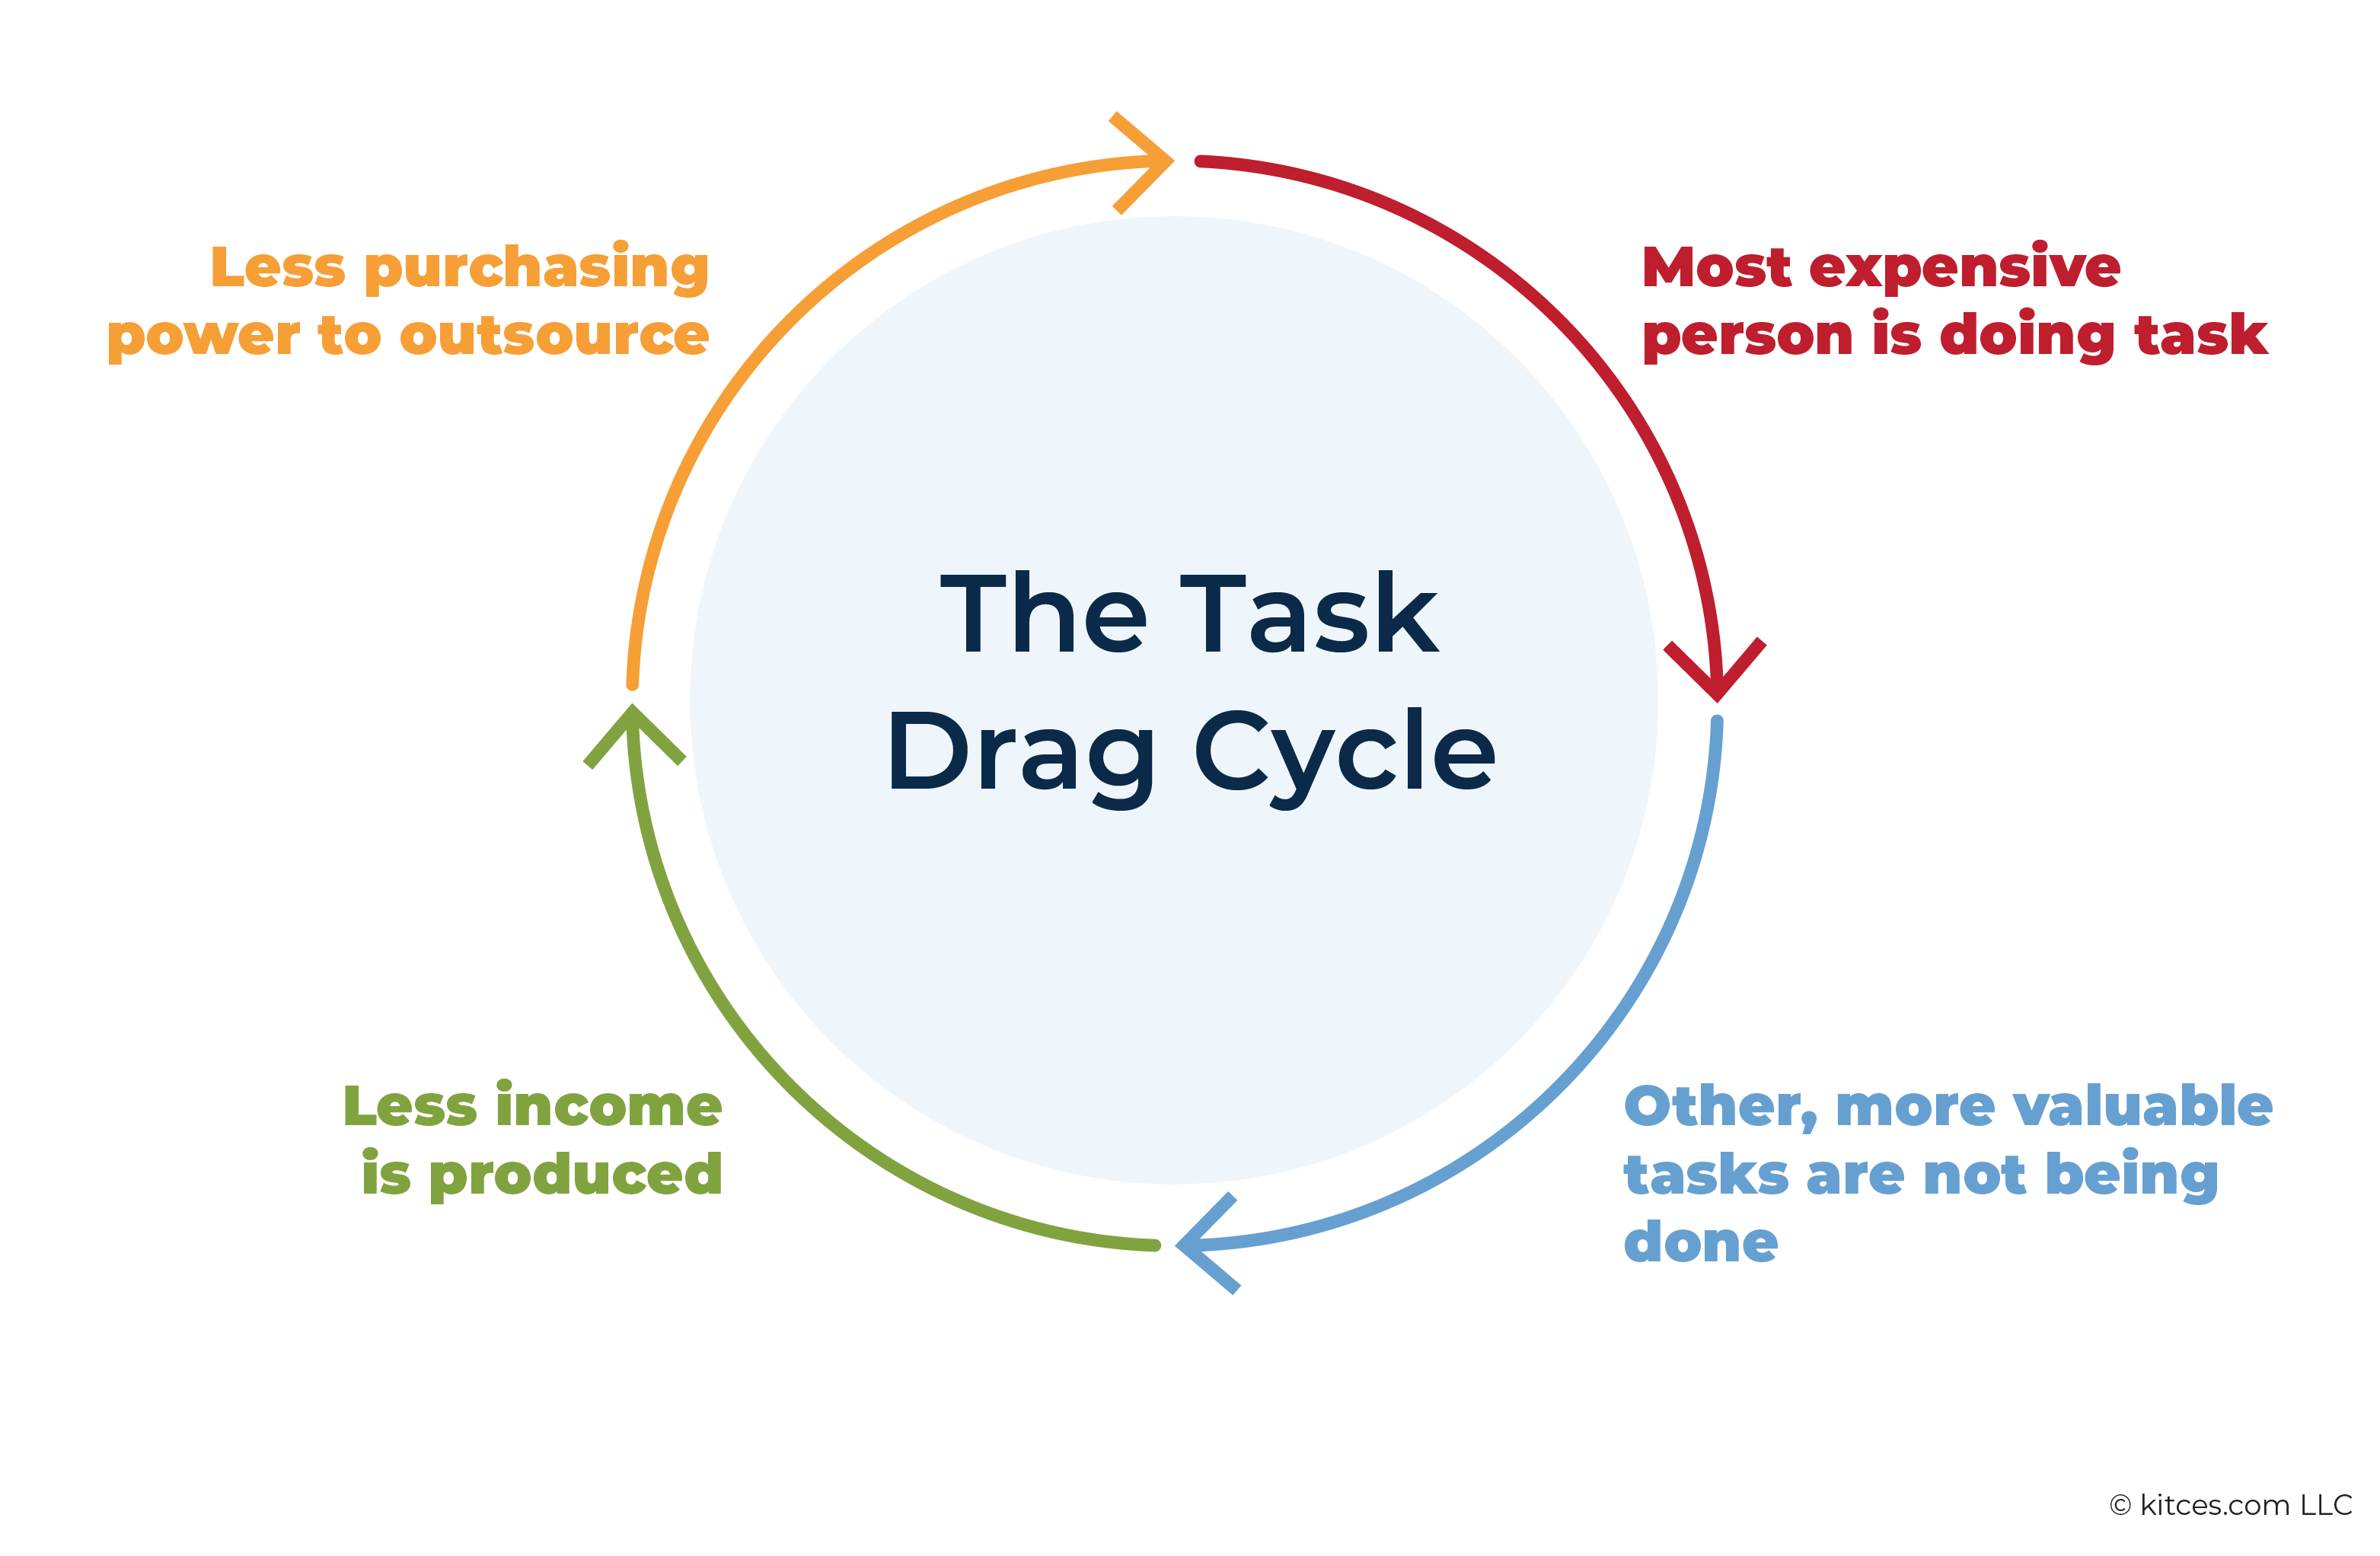
Furthermore, compounding these challenges is the fact that most people struggle to accurately estimate how long tasks will take. This makes it easy to downplay the cumulative impact of 'quick tasks'. (Think of all those 'weekend' house projects that didn't actually get finished in a weekend!) As a firm grows, the issue becomes even more pronounced because an advisor's time becomes increasingly valuable. So, if tasks aren't being delegated (or automated, or eliminated) diligently, then all of those 'quick' tasks can accumulate into a phenomenon known as 'task drag'.
Task drag arises from a few dynamics that increase the overall cost of undelegated tasks:
- Tasks are more expensive because they're being done by the firm's 'most expensive' (per-hour) person – the advisor.
- When an advisor spends time on one task, they're not available to focus on other, more valuable activities. This amplifies the true cost of those lower-priority tasks.
- Because an advisor isn't prioritizing income-producing work, the advisor also generates less revenue, which reduces their ability to invest in outsourcing or automating tasks to free up their capacity.
Ultimately, analyzing and regaining control of one's time comes down to understanding how an advisor is spending their hours and aligning that with the long-term vision of the firm's growth. A practical place to start is to begin collecting objective data about where the time is really going. By using time-tracking software over the course of several weeks, advisors can truly evaluate where their time is going, find potential areas of improvement, and position themselves for long-term success!
Organizing Time-Tracking Software To Get Useful Data
Getting useful time-tracking data to make informed decisions about how to better align time with key priorities is largely about 2 key elements: 1) setting up the system correctly and 2) tracking data consistently.
The first step is selecting and setting up a time-tracking software that will meet the advisor's needs. At a minimum, the software should have the following capabilities:
- Ability to differentiate tasks by project or client
- Ability to tag and sort time entries
- An intuitive user interface
- Integration with relevant software and browsers
- Robust task analysis, including filtering by tags and exporting data in a CSV format
When I've done this personally, my software of choice has been Toggl because of its ease of use and its ability to analyze time by the client, project, or tag. However, Clockify and Harvest are also good options with similar capabilities.
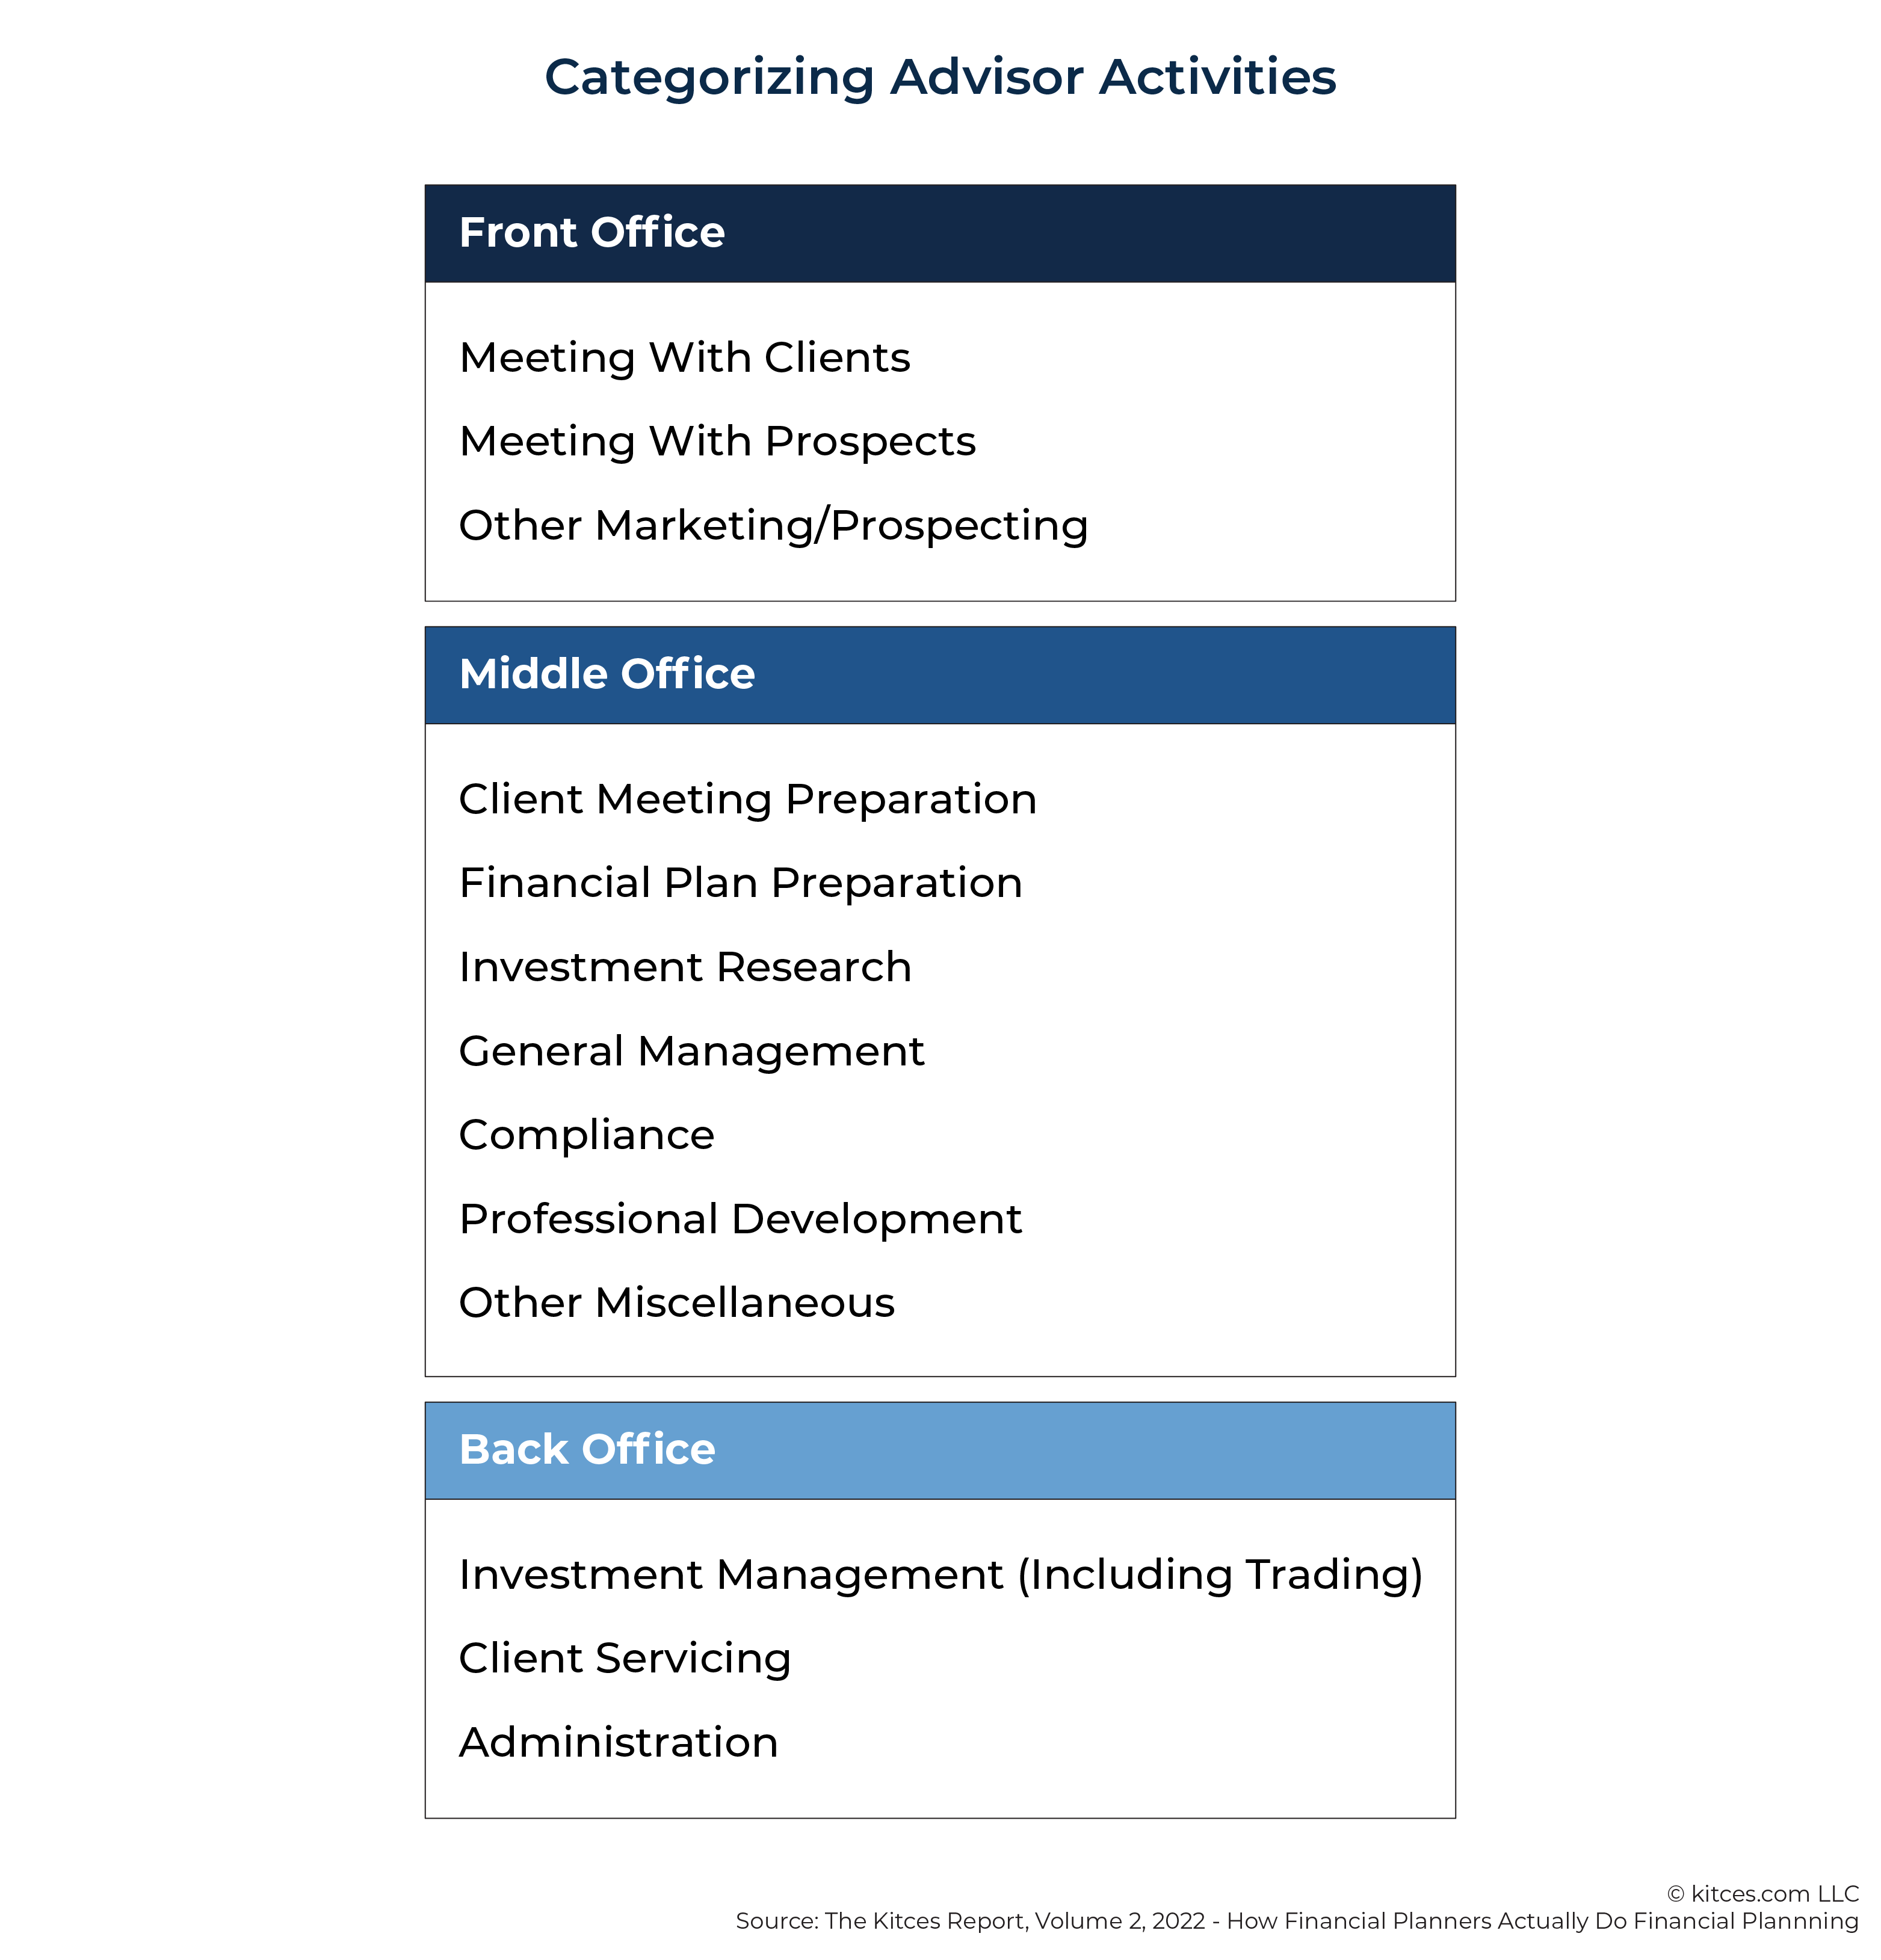
After selecting the software, advisors can begin by setting up tags to organize their time-tracking data effectively. The 2022 Kitces Research on How Financial Planners Actually Do Financial Planning provides a useful framework for categorizing advisor tasks as front, middle, or back office activities. Front-office tasks involve client-facing activities, such as meeting with clients or prospects. Middle-office tasks often include client meeting preparation, compliance work, and professional development. And back-office tasks typically cover client service, administrative work, and investment management.
Advisors who want to benchmark their time-tracking results against data from the 2022 Kitces Research on Advisor Productivity can use the front/middle/back office framework, which provides a helpful starting point for categorizing tasks. This framework allows for an easy 1:1 comparison with the study's results while maintaining consistency across time-tracking efforts.
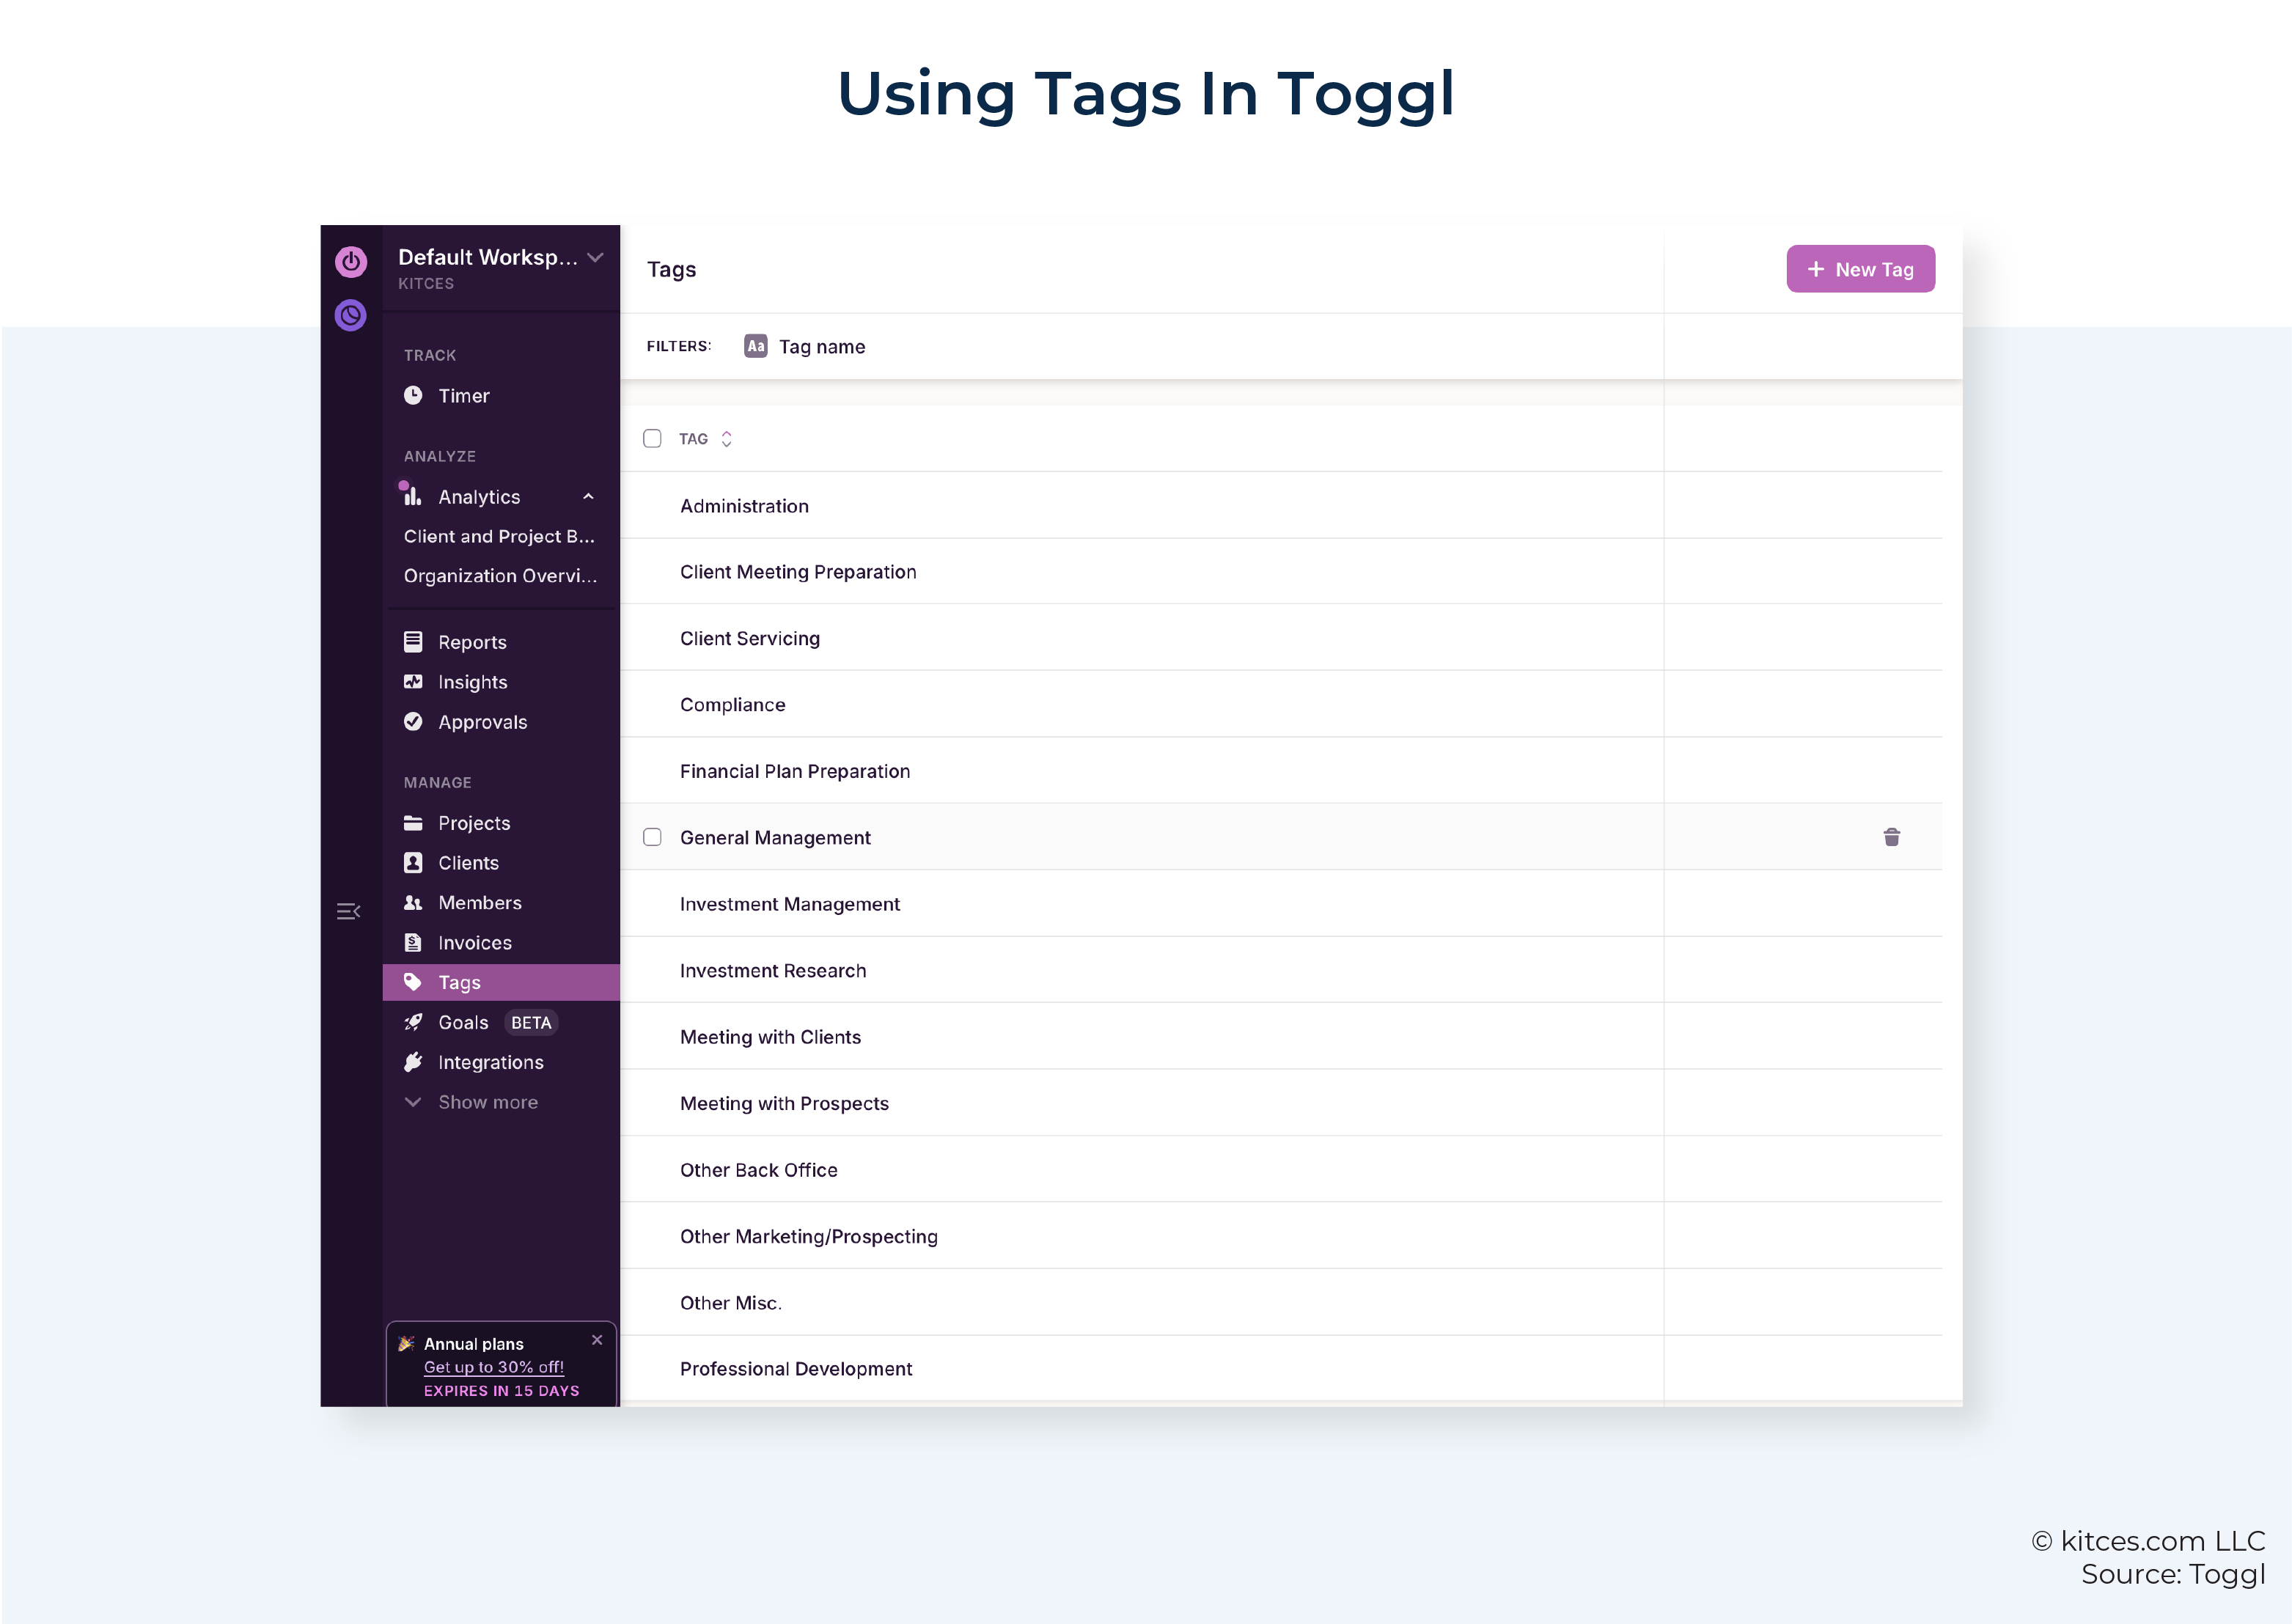
Below is an example of what a project set-up might look like in Toggl. (Note: In alignment with the Kitces Research study, "Other Miscellaneous" is categorized as a subcategory of Middle Office work and thus is not shown here.)
In Toggl, each session can only be assigned to a single project, so each task can only be counted as front, middle, or back office. Dividing tasks as such can help advisors get a clear view of where their time is actually going. For example, in the sample screenshot above, it's easy to see that the majority of this advisor's time is spent on front office work.
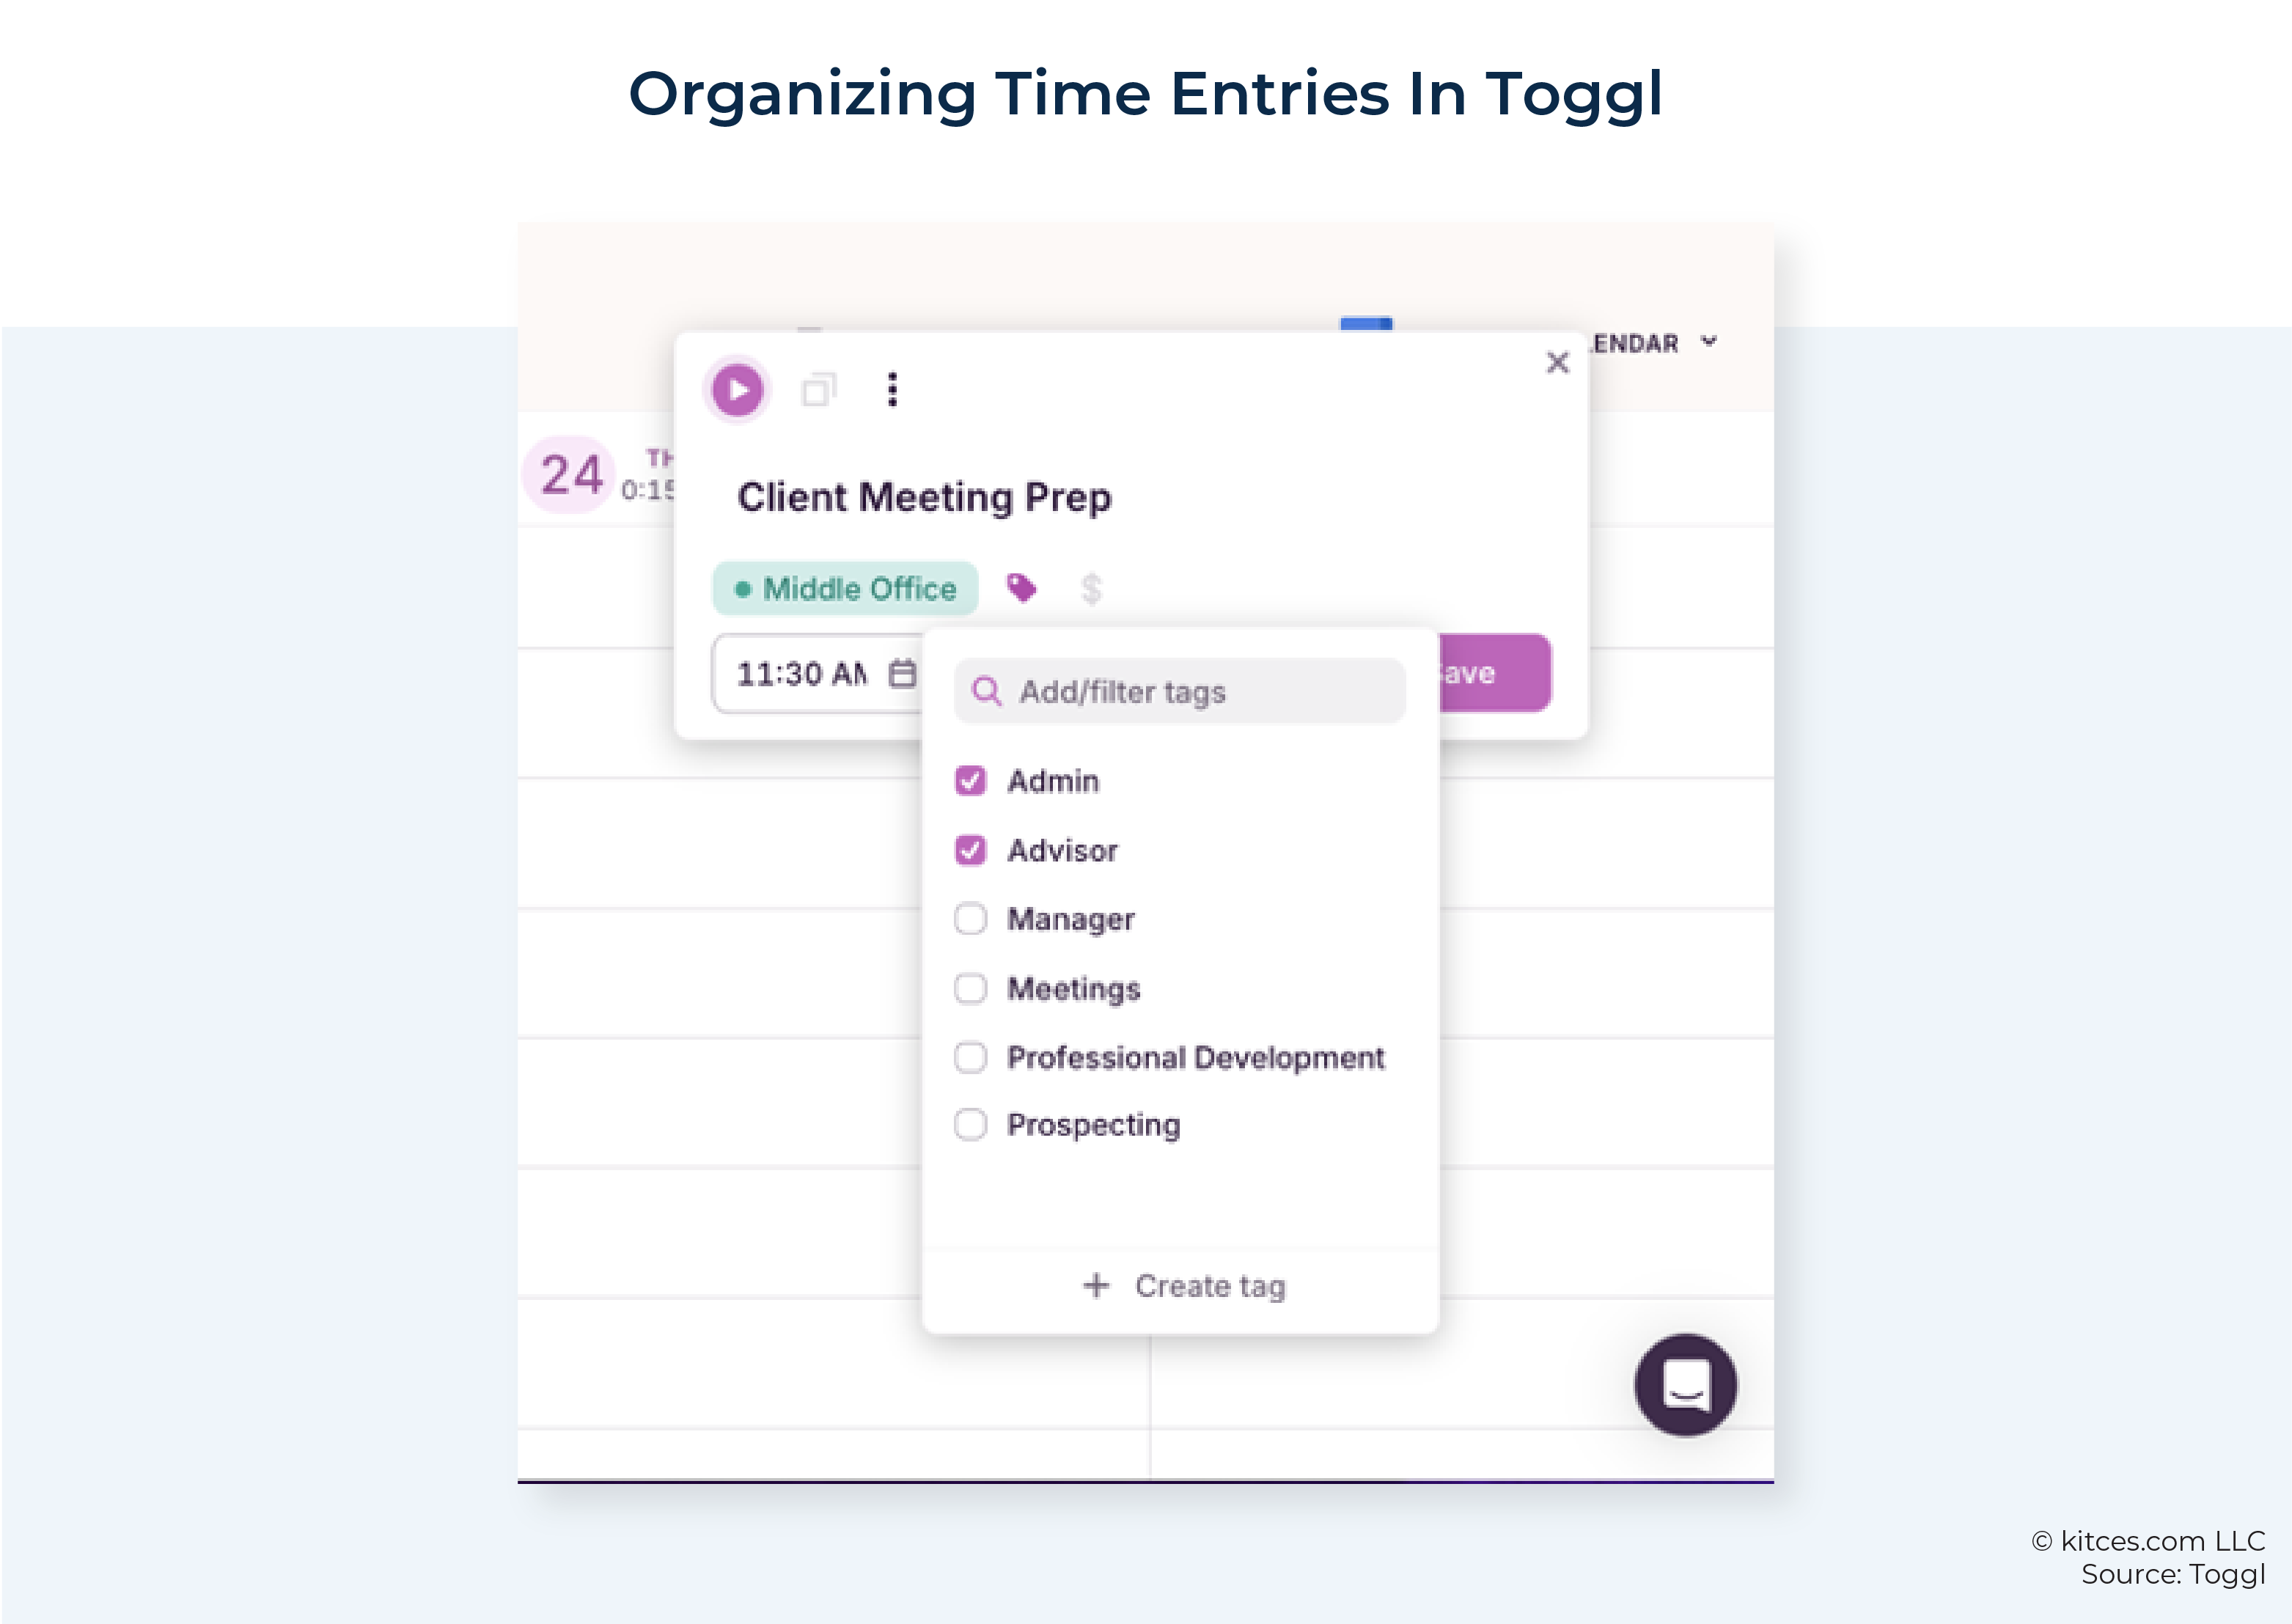
Tags, however, add another layer of clarity by specifying what actually happened during that work time. Tags are a quick way to subcategorize project tasks. To align with Kitces Research on Advisor Productivity, the tags should match the advisor activities outlined earlier. For example, a work session categorized under the "Back Office" project might include an "Investment Management" tag.
Nerd Note:
Depending on the structure of the firm – or the specific insights that advisors are seeking – time-tracking may not align perfectly with the data framework in the Kitces Research on Advisor Productivity. In such cases, it's best practice to limit the number of projects to no more than 5. If the tracking becomes too fractured across several projects, then it can become more difficult to derive meaningful insights.
Good alternatives for organizing projects include sorting by the roles or 'hats' (e.g., admin, advisor, marketer, compliance) or by broad work categories (e.g., management, advice, prospecting).
Once the projects and tags are set up to suit the advisor's needs, the next step is to begin tracking time.
Tracking Time
In general, tracking time for 3–6 weeks is usually sufficient to gather meaningful insights about how time is being spent throughout the workweek. If advisors have less than 3 weeks of data, then the averages may be disproportionately skewed by the activities of a single week. On the other hand, going beyond 6 weeks may be too long to go, delaying the opportunity to start making iterative improvements.
All an advisor needs to do is start a session whenever they begin a new task. Then, add a task title, select the affiliated project, and apply the relevant tags.
To ensure a successful time-tracking process, consider these three key strategies:
- Track real weeks. All weeks are 'real' weeks, even if they feel atypical. It may be tempting to discount certain weeks due to unique circumstances – such as a hiring phase, an unusually low (or high) number of prospecting meetings, client emergencies, or covering for an absent team member. Additionally, conferences and surge meeting schedules may skew where an advisor's time goes. However, time-tracking is not about capturing the 'optimal' week – it is about tracking each week as it is. Unexpected things happening is a natural feature of work, not a flaw. While the unexpected can certainly be mitigated, it can never be fully removed.
- Pay attention to task-switching. Be diligent about noticing and recording task-switching, even for seemingly minor activities. It can be easy to downplay a 5-minute 'quick glance' at the inbox... but those quick glances can add up over time. This is one reason why it's important to track time for a few weeks – the first week can induce a "Goldilocks Effect", where the person tracking their time unintentionally modifies their activities to be on their best behavior.
- Adopt a curious mindset. As time-tracking over the weeks progresses, an advisor might notice places for improvement. While it's OK to make notes about potential changes, it's important to avoid slipping into self-judgment, such as thinking, "I should be able to do this faster". Instead, maintain a positive, curious attitude, focusing on learning where the time is going without judgment.
At the end of each week, advisors may opt to review their tracking for a few minutes and 'clean up' the data slightly with minor adjustments – such as correcting tags, checking time stamps, and refining project and tag categories. Beyond that, the main focus is simply hitting "start" and "stop" and tagging tasks as they go. Overall, the goal is to end every week with a clear, accurate overview of how time was spent and what tasks were accomplished.
An example of how this time actually breaks down is shown below, in a weekly overview. This can give insight into how the time is spent in a few ways. The first is the daily total, which is calculated as the raw number of hours worked in each day or week. The topmost wheel in the bottom right gives a breakdown by project (in this case, by Back Office, Middle Office, or Front Office tasks). The bottom wheel breaks down how tags are used.
This overview can provide a good snapshot of how the week was used – even (and perhaps especially) if the tracked week was an unusual one in terms of task coverage or firm processes.
Analyzing Time-Tracking To Regain Control Of One's Time
After a few weeks of tracking their time, advisors should have a solid dataset to work with. Now, the real fun begins!
A good starting point is reviewing the data and reflecting on initial reactions and observations. Scanning through the averages and scrolling week by week can reveal useful patterns. What was surprising? Which weeks felt the most productive or the most draining, and why? Are there recurring "Miscellaneous" tasks that are detracting from overall productivity that could be delegated or adjusted? Which tasks took the most time? Did any tasks feel like they took much longer to complete than they did in reality? Was there anything that another team member was responsible for that the advisor ended up covering? How much time was actually spent on the most important high-priority tasks versus the plethora of other demands, distractions, and unexpected requests?
Advisors can also reflect on how often uninterrupted deep work was achieved. How many instances of deep work were actually completed? During those times, was the intended task actually accomplished, or was the time diverted and reassigned to other last-minute demands?
While there is a lot of quantitative data to analyze where one's time goes, taking a moment to note the qualitative data and write down their observations may help reveal other adjustments that can make daily schedules more efficient and aligned with personal energy levels. For example, when I reviewed my own time-tracking documentation, I realized that starting my workday at 8:00 AM rarely worked well – I am not a morning person! So why was I doing that to myself? When I started my workday closer to 9:30, I started off much more energized and got into my work faster. My personal schedule usually allowed me to work effectively until 6:00 PM, creating a better overall rhythm.
Candidly, there's a lot to be said about the small adjustments that just fit better with how a person naturally shows up (as far as a workplace will allow it). Taking the time to reflect on both the numbers and personal experience of tracking can uncover meaningful opportunities for change.
Exporting Time-Tracking Data For Analysis
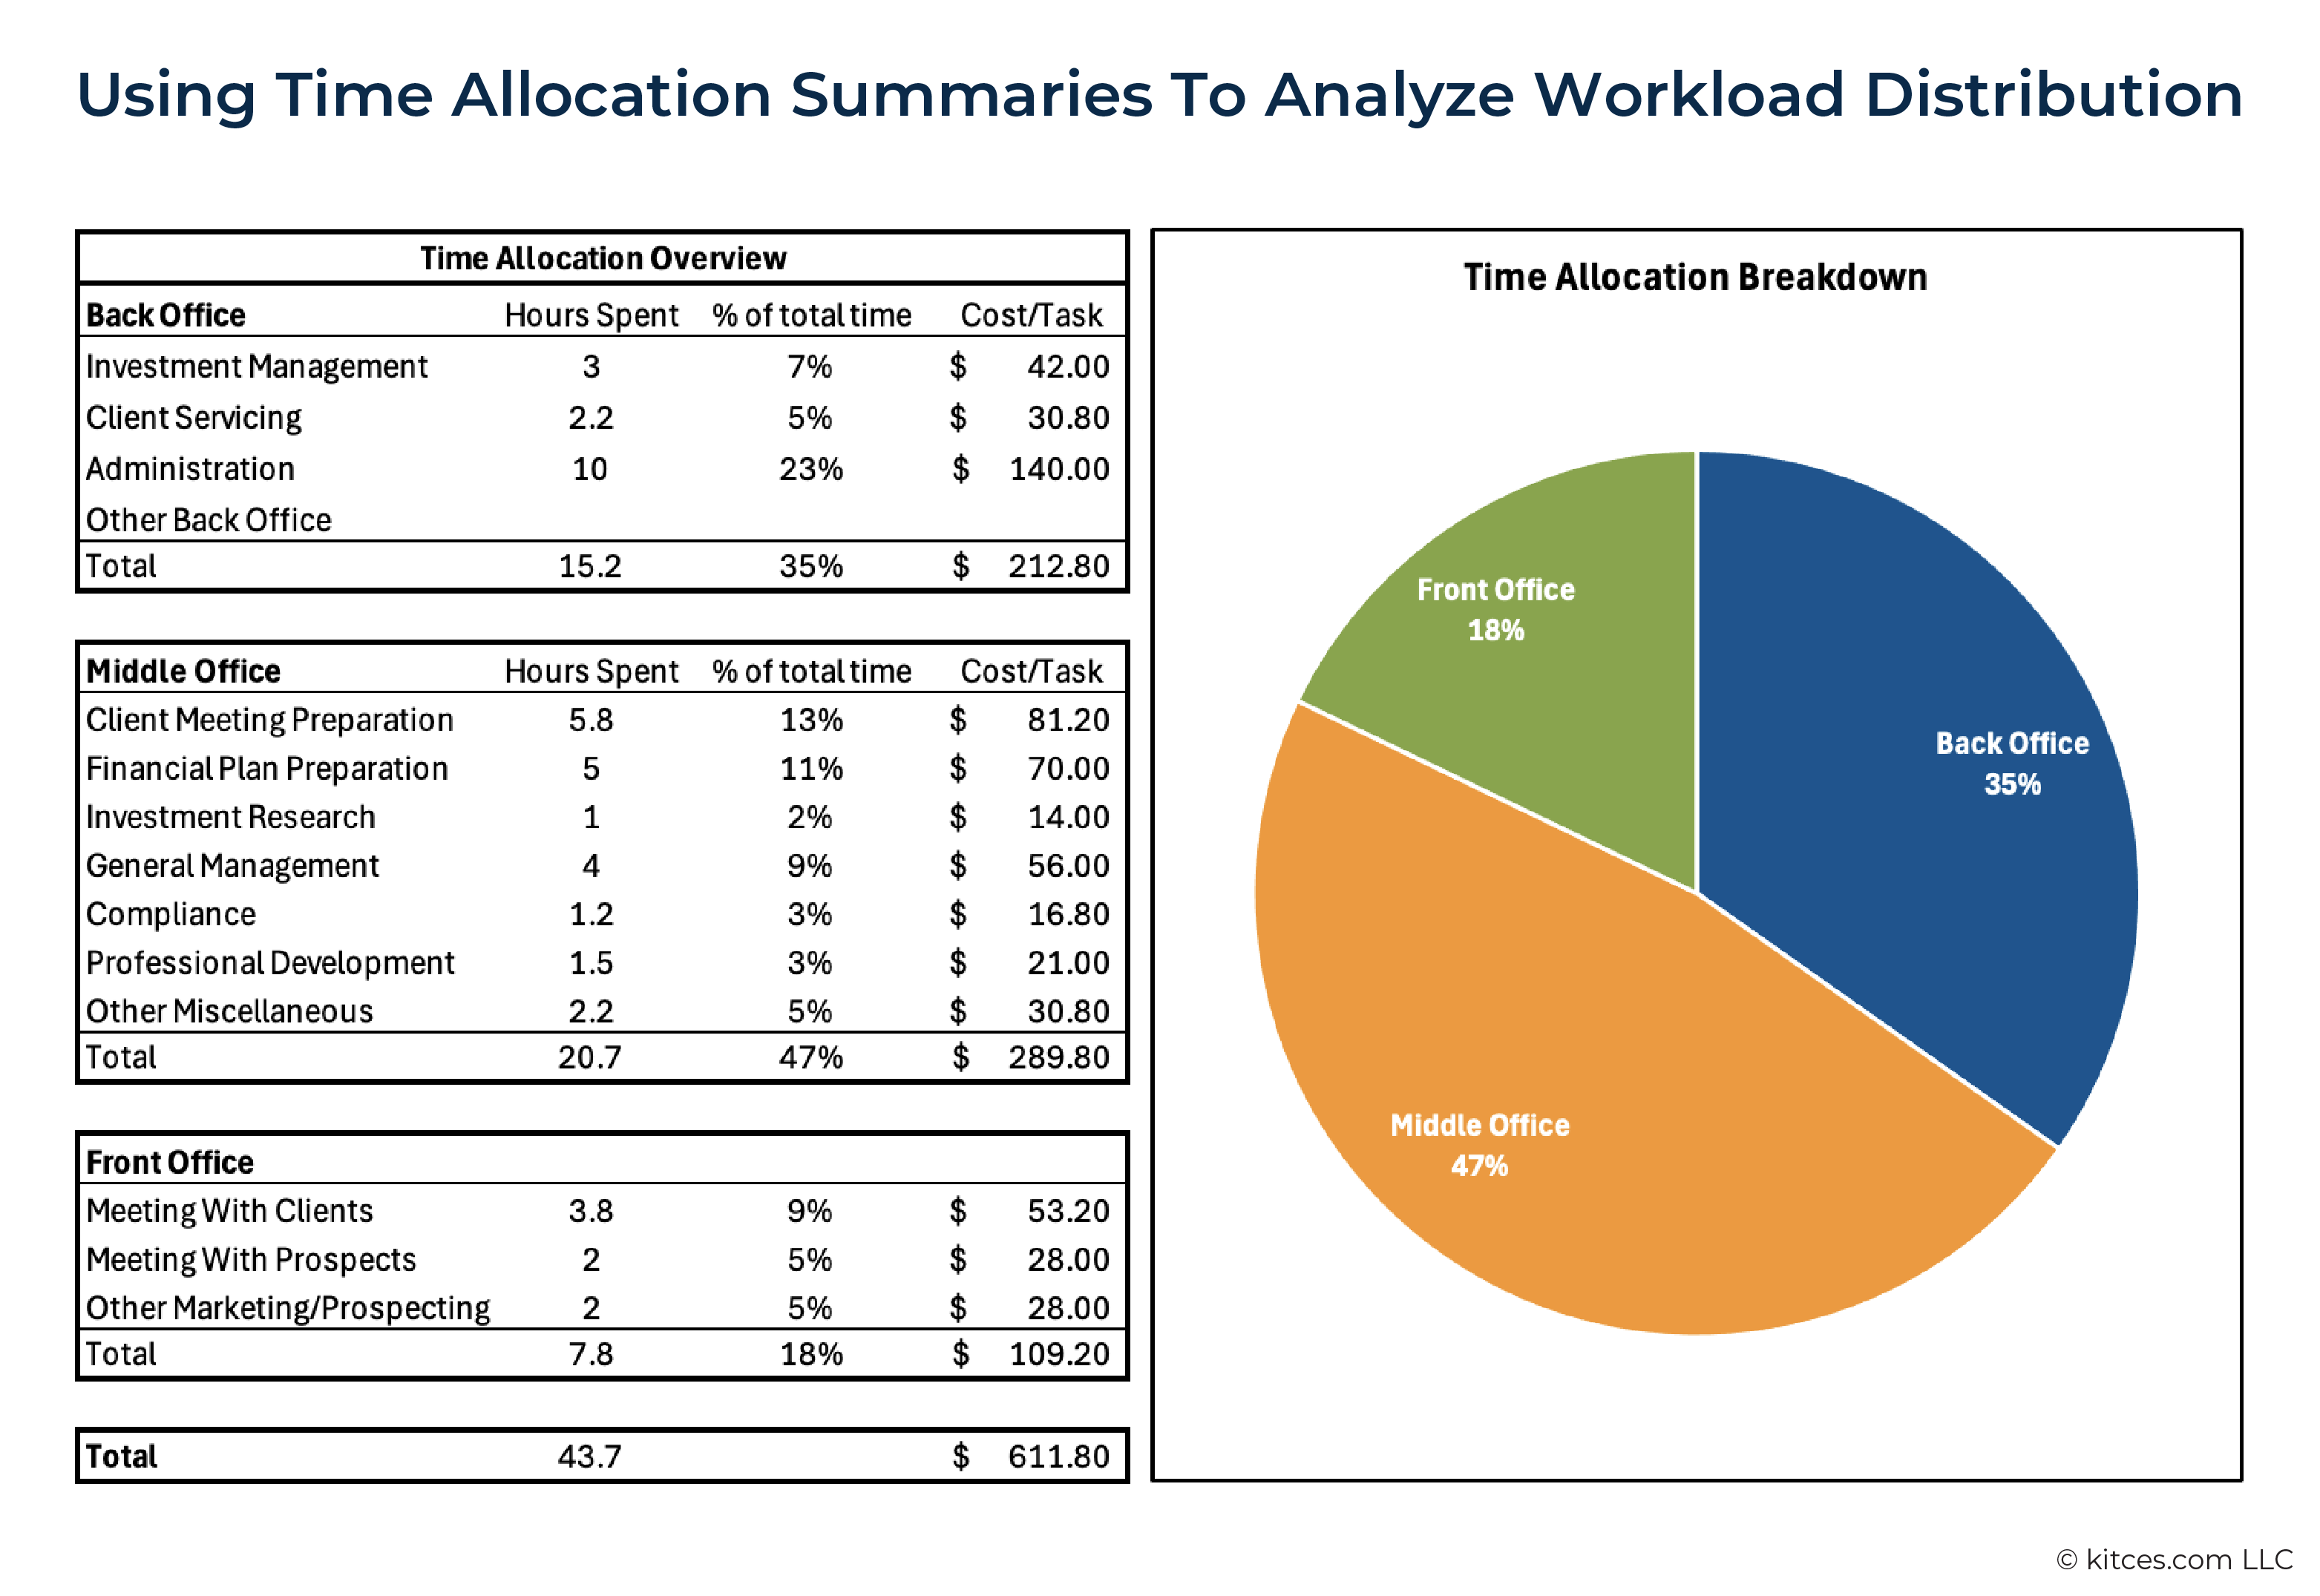
With initial observations ready, advisors can export their data into the Excel spreadsheet that can be downloaded here. This spreadsheet offers a template that organizes the downloaded data and shows how their time compares to the benchmarking averages, as illustrated below.
In Toggl, time-tracking data can be downloaded from the "Reports" section. Advisors can view the detailed summary and then select "Export" from the top right menu to download a CSV file.
The Excel spreadsheet is formatted specifically for data imported from Toggl software (notably, Toggl does require a paid subscription to download data in CSV or Excel format, though they do give extended free trial periods. Advisors can either time their free trial period to align with the analysis portion or may choose to manually transfer their time analysis data. The most scalable way to manually transfer this data is to just focus on the tag totals over the last few weeks [e.g., how long was spent on general management], rather than the wholly comprehensive data.).
Those using other types of technology for time-tracking who wish to use Kitces Research data as a time-tracking benchmark can still use the Excel benchmarking spreadsheet. After downloading their respective data as a CSV or Excel file, they simply need to adjust the column to match the formatting of the spreadsheet. In the "Data" tab worksheet, the columns used for analysis are marked in blue – everything else is extraneous and is not required for the analysis.
The key data points for analysis are whether the work was categorized as front, middle, or back office; the individual category tag; and the duration of the task. As long as this information is correctly formatted within the spreadsheet, the same insights should be generated.
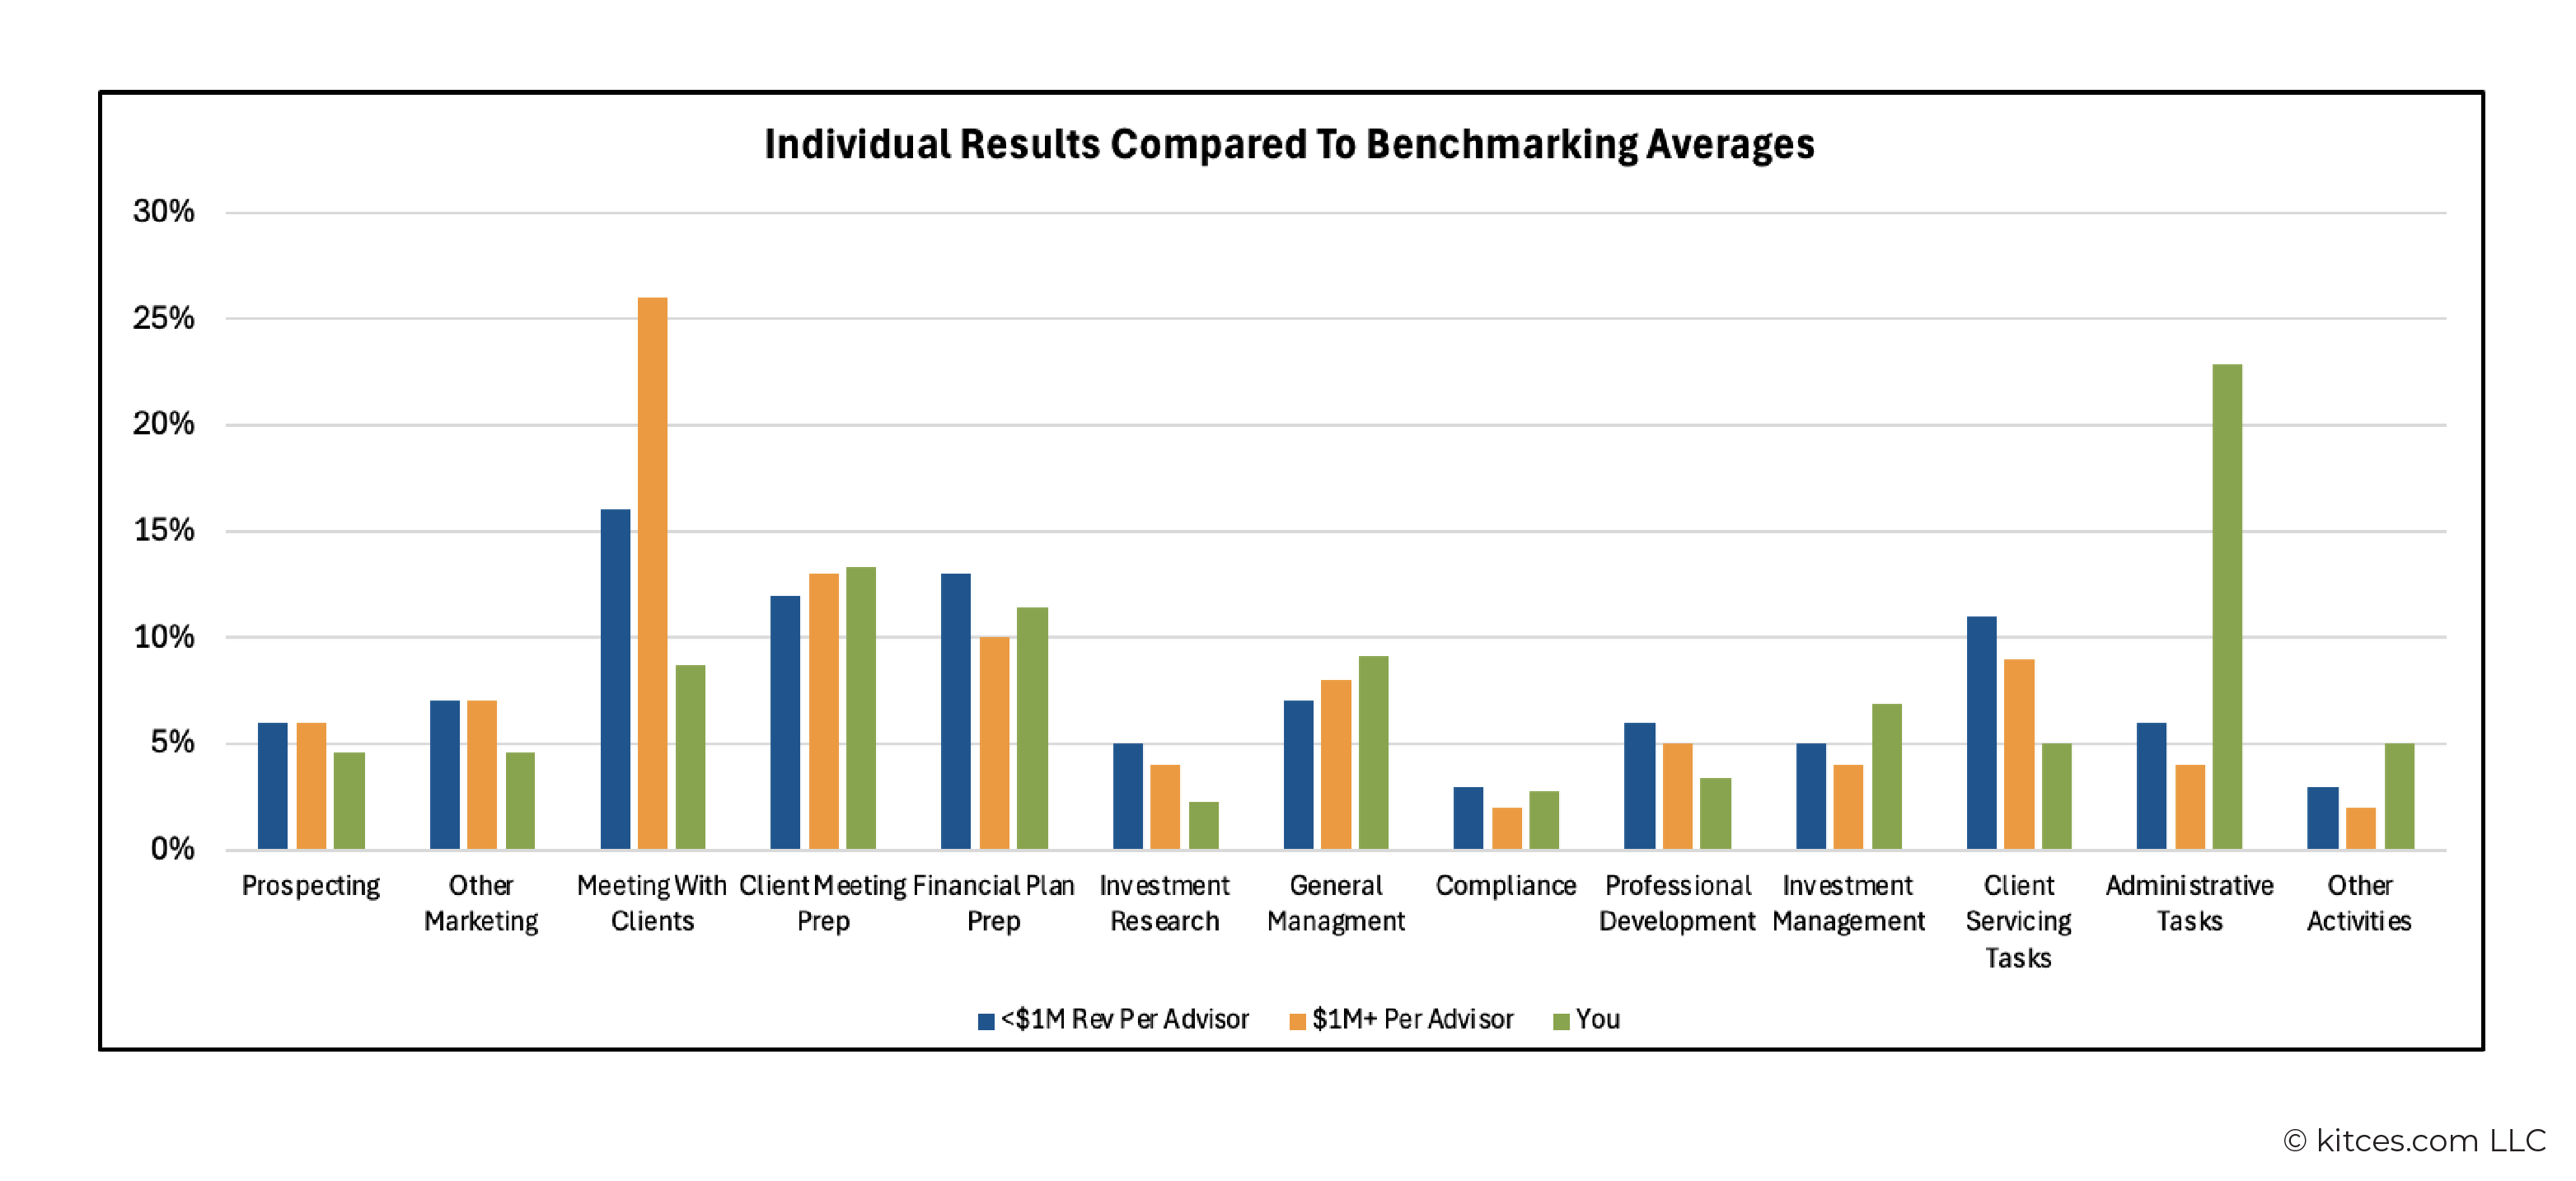
The Excel sheet gives advisors a few different perspectives on how to think about their time. First, advisors can review their time allocation data in the "Benchmarking" tab. This same tab also allows advisors to compare themselves with advisors from the Kitces 2022 benchmarking study, distinguishing by revenue per advisor.
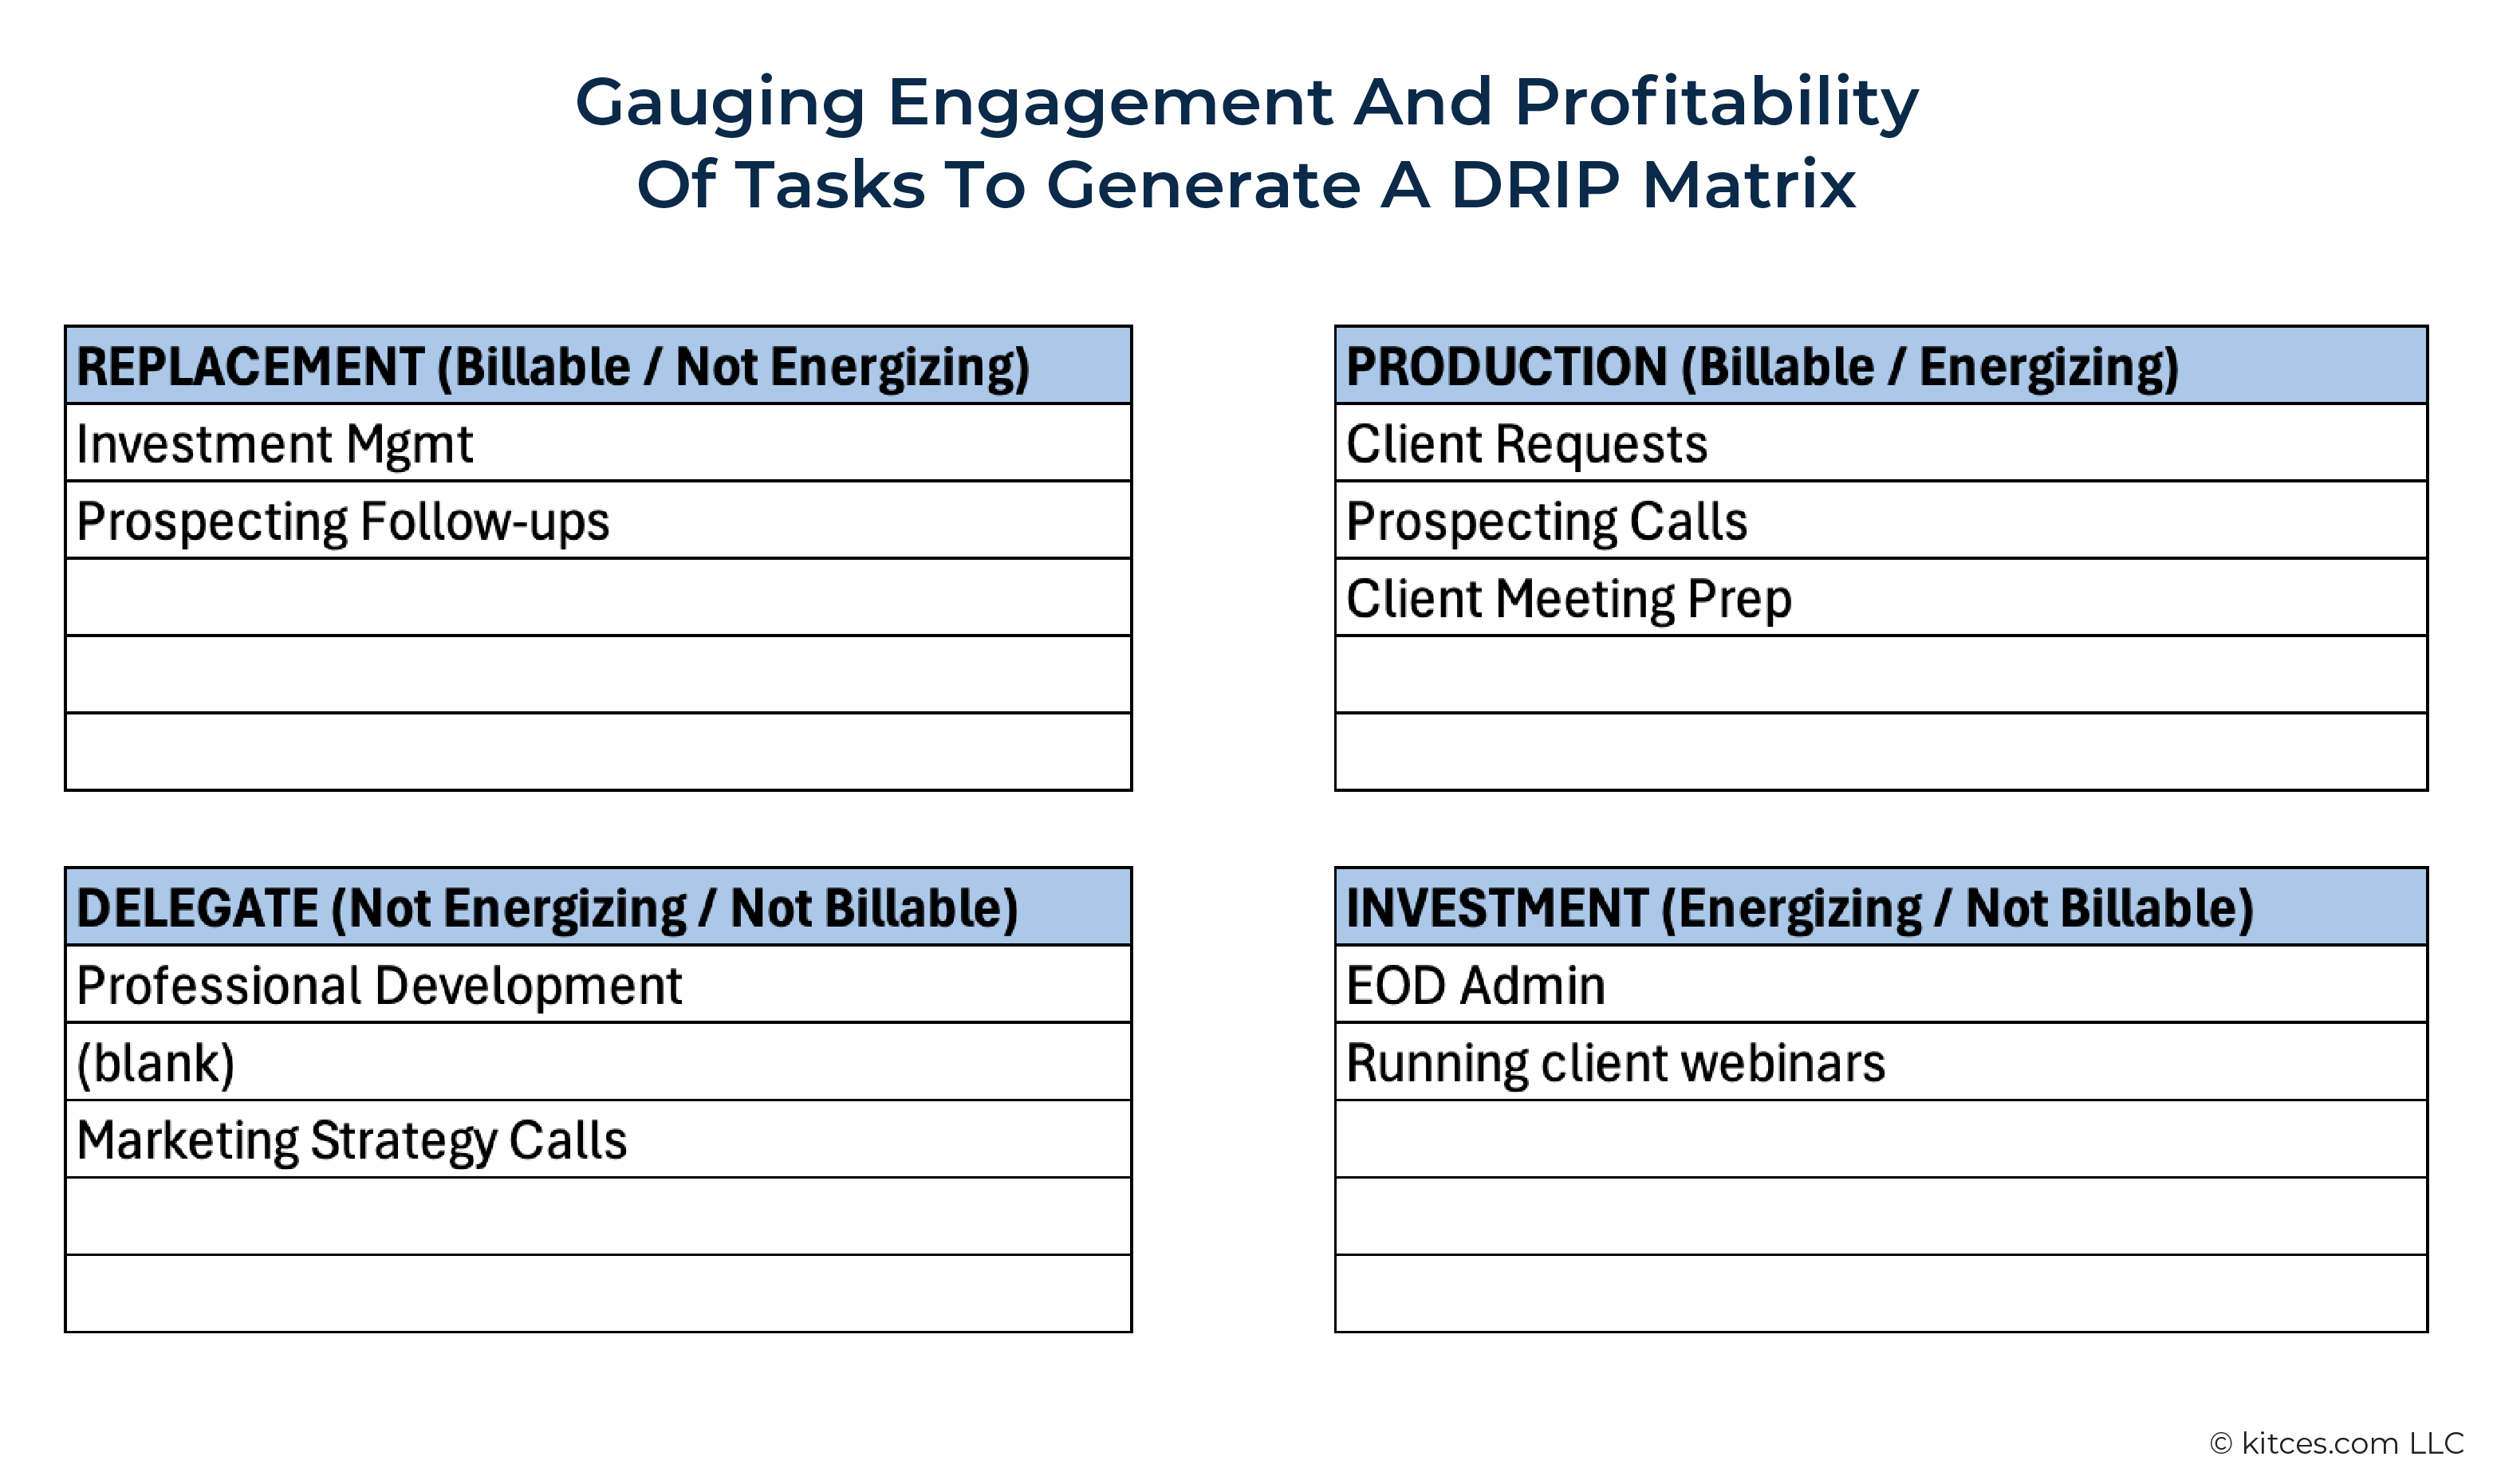
Additionally, advisors who track their billable tasks can also use the spreadsheet to indicate which tasks are "energizing" or "not energizing" (i.e., identifying work that fills an advisor with energy and work that is draining and distracting), which will allow them to generate a DRIP (Delegate, Replace, Invest, Produce) matrix, shown below. This tool provides another useful layer of information about where to start to (re)gain control of their time, which is discussed later in more detail.
Analyzing The Cost Per Task
With qualitative insights in hand, advisors can move on to a more analytical approach to understanding how their time is allocated. The first step is to calculate the aggregate cost of their time. This begins with determining the cost of an hour of an advisor's time, which can be calculated by dividing annual income by 2,000 (a baseline assumption of 40 hours per week for 50 weeks a year). For example, for an advisor who makes $150,000 each year, an hour of their time is approximately worth $150,000 ÷ 2,000 = $75.
With this information, advisors can also calculate the annual cost of specific tasks by determining the total number of hours spent on each task, and then multiplying by their hourly cost:
Total Hours spent on Task Throughout The Year × Advisor's Hourly Cost = Annual Cost of Task
For example, assume that David (from the example earlier in the article) spends the industry average of 9 hours creating a financial plan, as reported in the 2022 Kitces Research on Advisor Productivity. If David completes the entire plan himself at an hourly rate of $75, the total cost of creating the plan is $675.
Alternatively, if he hires a paraplanner at $37 per hour to complete 7 hours of the work, the cost for the paraplanner to create it is $259. David's remaining 3 hours spent (1 hour to review the paraplanner's work and an additional 2 hours to complete the plan) would cost $75 × 3 = $225. This brings the cost to $259 + $225 = $484. Even if the paraplanner takes an additional 2–3 hours to complete the plan, the total cost is still lower than if David did the entire task himself.
This analysis also highlights the significant cost of 'task drag'. Tasks that don't require an advisor's unique expertise – such as the 1–2 hours of "miscellaneous" or administrative work – can become disproportionately expensive when done by the advisor instead of a team member or outsourced professional. Over time, these seemingly minor inefficiencies can add up, underscoring the importance of delegating lower-value tasks to maximize an advisor's efficiency and overall productivity.
How Do Advisors Stack Up Against Industry Averages?
Digging a little deeper, advisors can compare their time-tracking data against industry averages, which can provide valuable context and benchmarks. This is where things get very interesting.
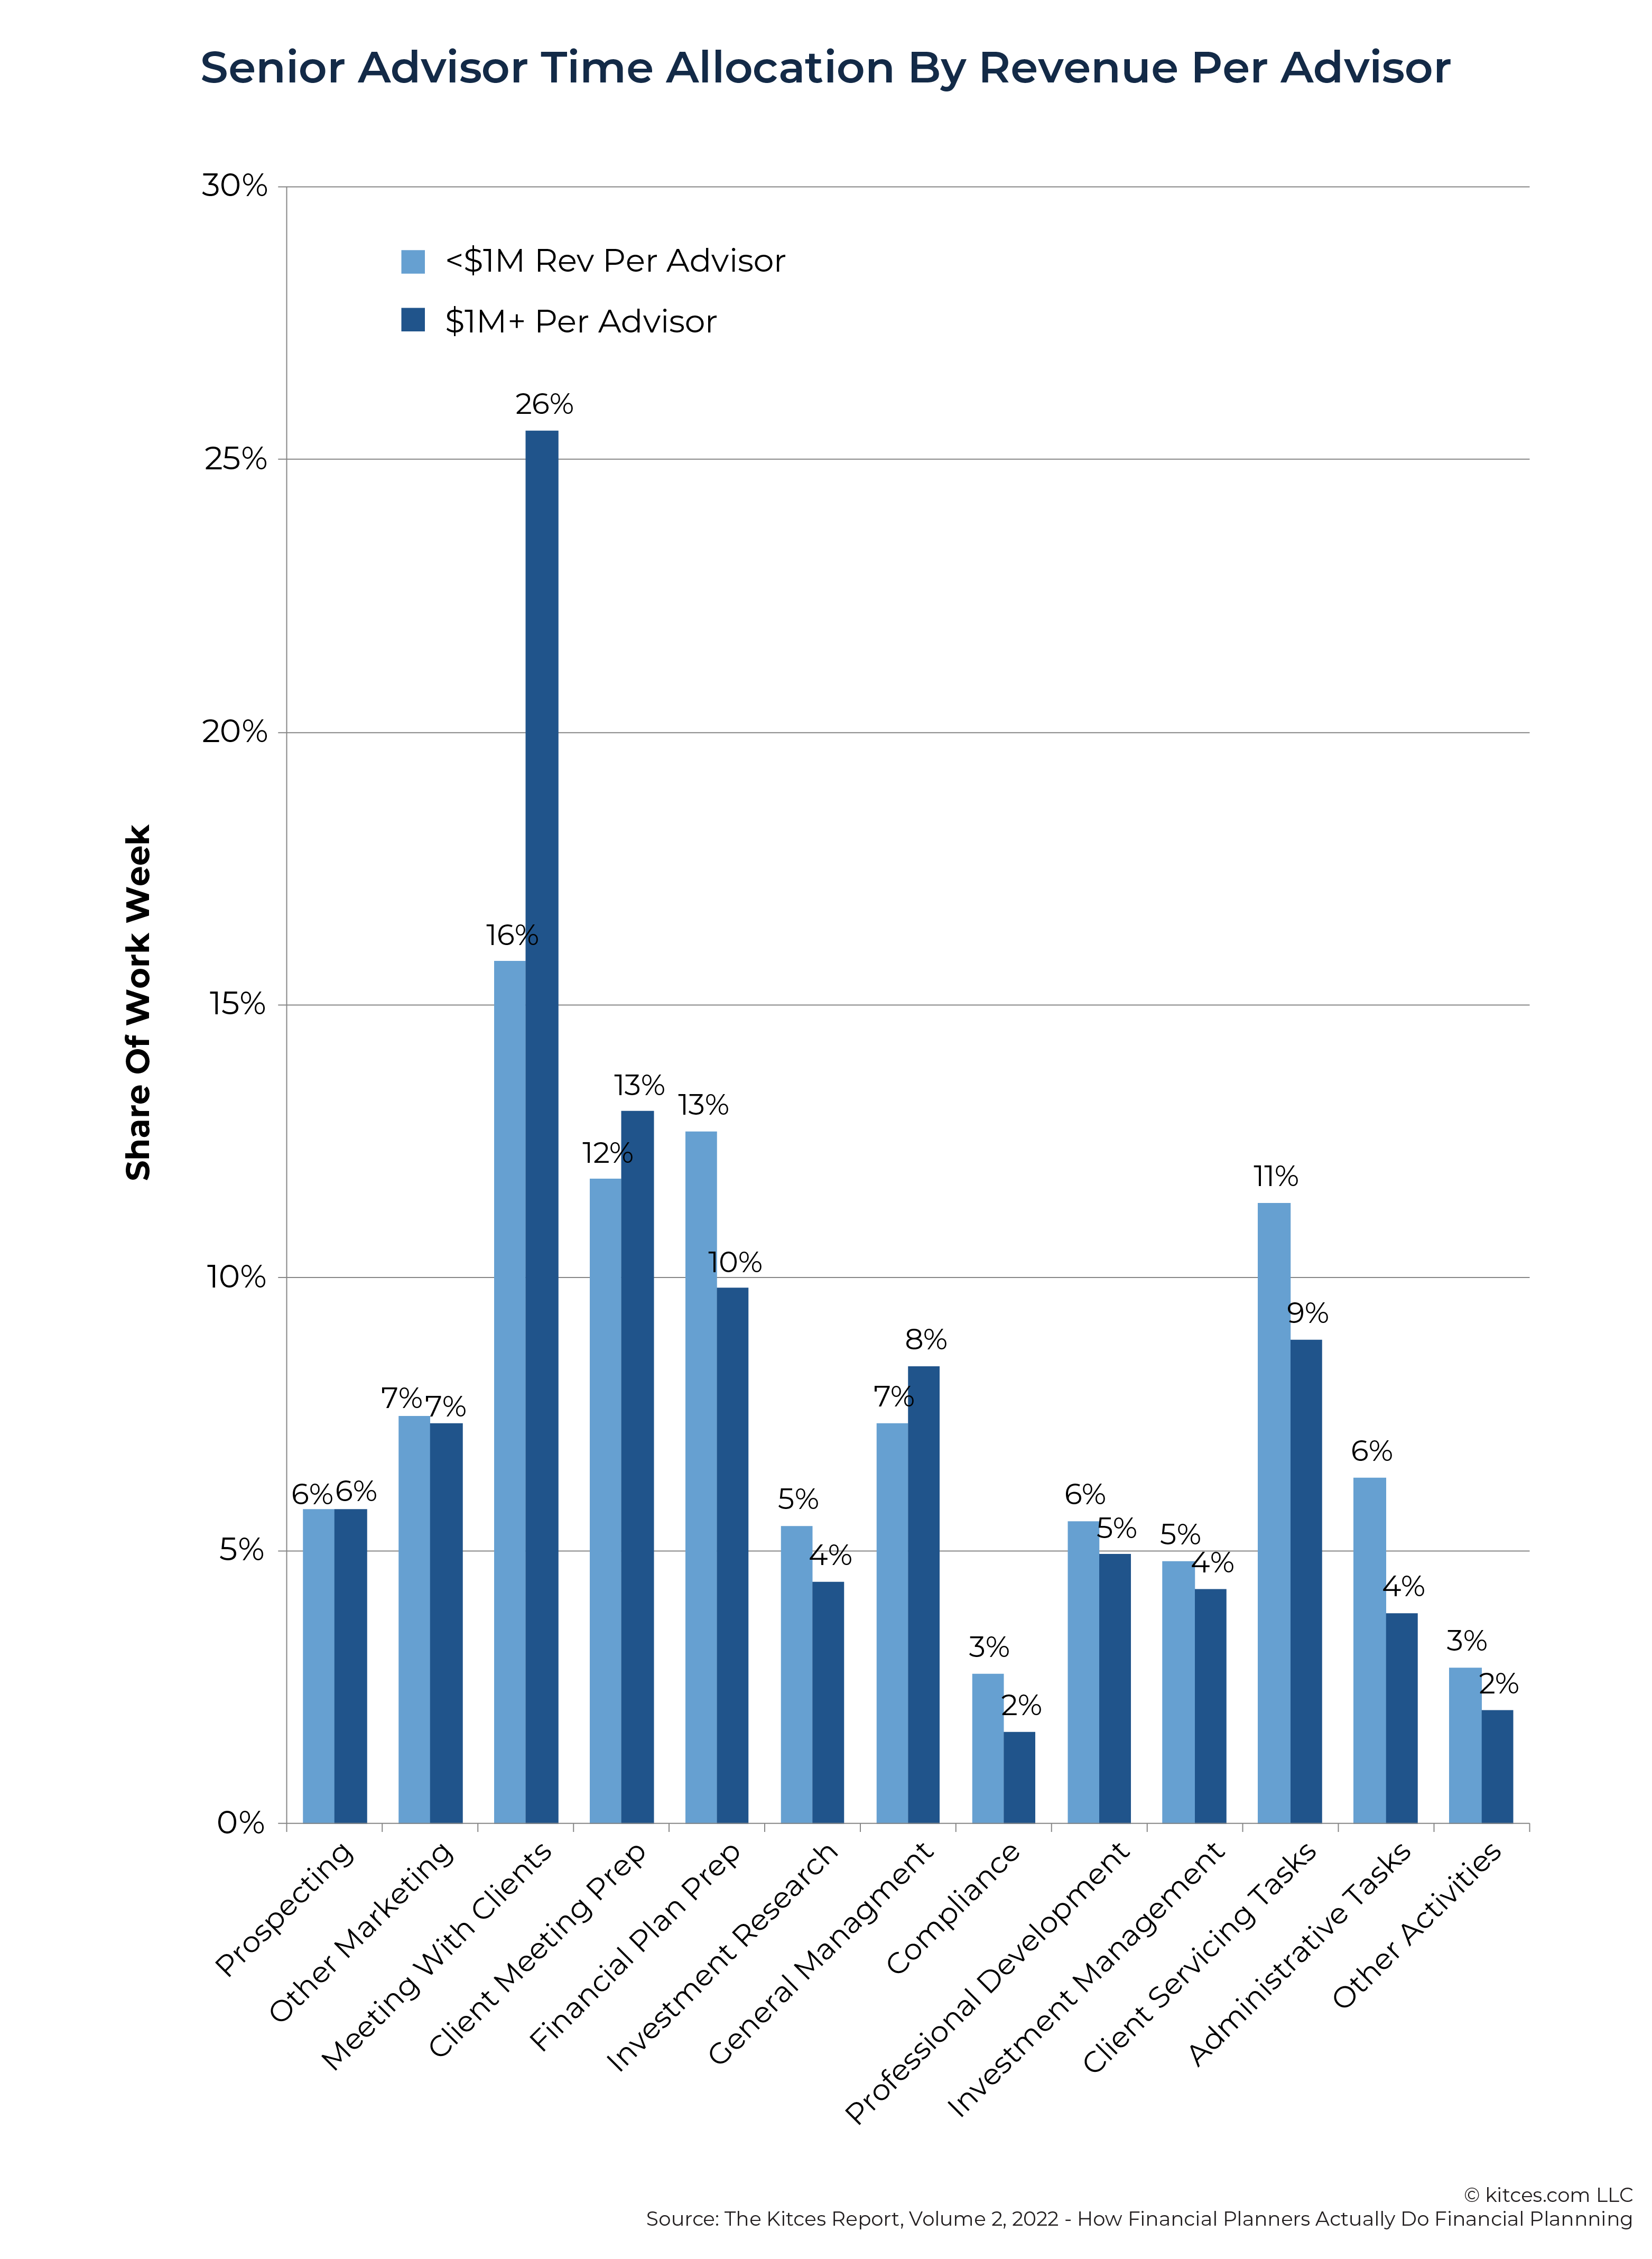
As the Kitces Research on Advisor Productivity notes, advisors in highly efficient, high-revenue firms (generating more than $1M per advisor) achieve success largely by maximizing client-facing time. This allows them to build deeper client relationships while minimizing middle- and back-office tasks through automation or delegation. According to the study,
…focusing on face time with clients is clearly a path to great productivity, but it is far more a 'game of inches' than one of radical change. The most productive advisors are doing this largely through 1/2–1 hour per week on financial planning preparations as well as client servicing and administrative tasks (whether automated or, more likely, via delegation to other roles). In turn, these few hours of savings can then be reallocated to pick up 'just' another 2–4 client meetings per week.
This "game of inches" is illustrated below, showing the breakdown of specific activities that contribute to productivity and efficiency.
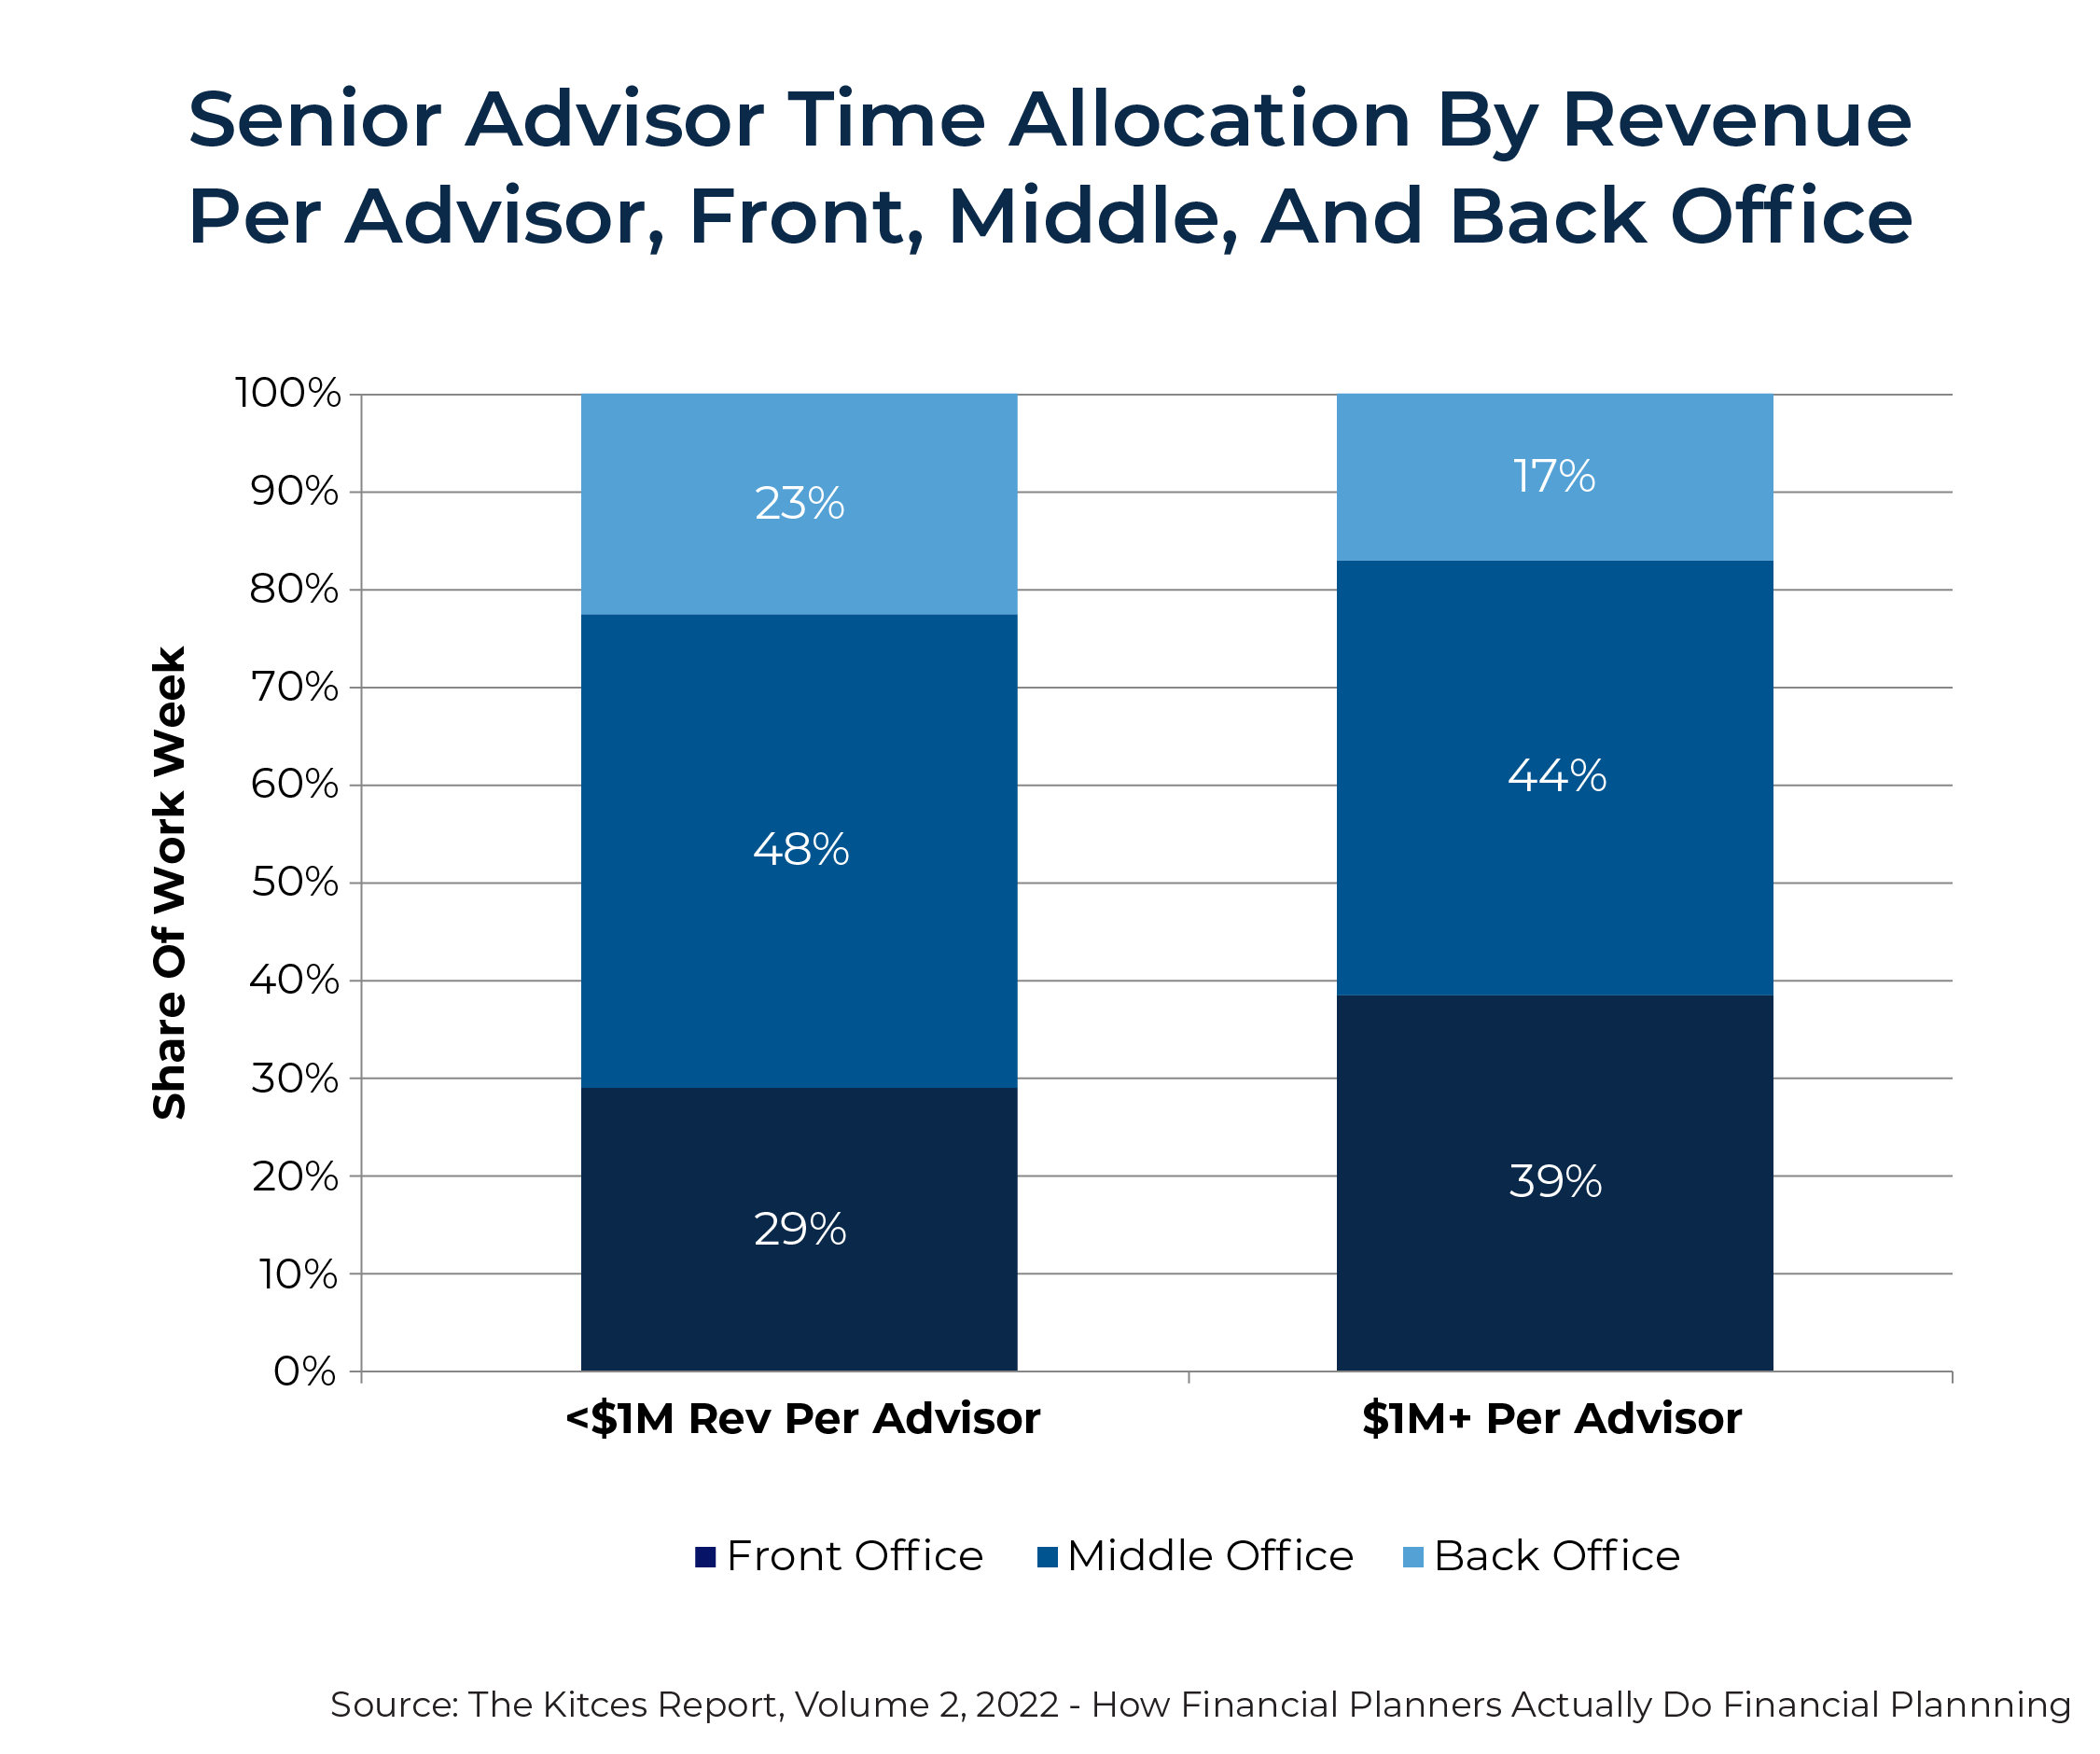
Additionally, the aggregate breakdown for front, middle, and back office time allocations shows notable trends between firms generating <$1M and > $1M in revenue per advisor.
Advisors can use their time analyses to compare their results against these benchmarking averages – first, to ensure they're at least "on track" with their peers, and second, to identify concrete steps for getting ahead. And while almost every advisor will differ slightly from industry averages, those differences should reflect conscious decisions that align with their unique priorities and goals. It's also important to weigh the potential trade-offs between growth, cost, and efficiency.
Regaining Control Of Time: Using The DRIP Matrix To Prioritize With Small Adjustments
Advisors who have tracked both the aggregate cost of different tasks and whether those tasks were energizing can use these insights to create their own DRIP matrix. This tool uses a 2-dimensional scale to rank tasks based on their revenue-generating potential and their level of personal engagement. The DRIP matrix can serve as a powerful checklist to determine which tasks are best suited for delegation, automation, or elimination and to identify other areas for potential improvement.
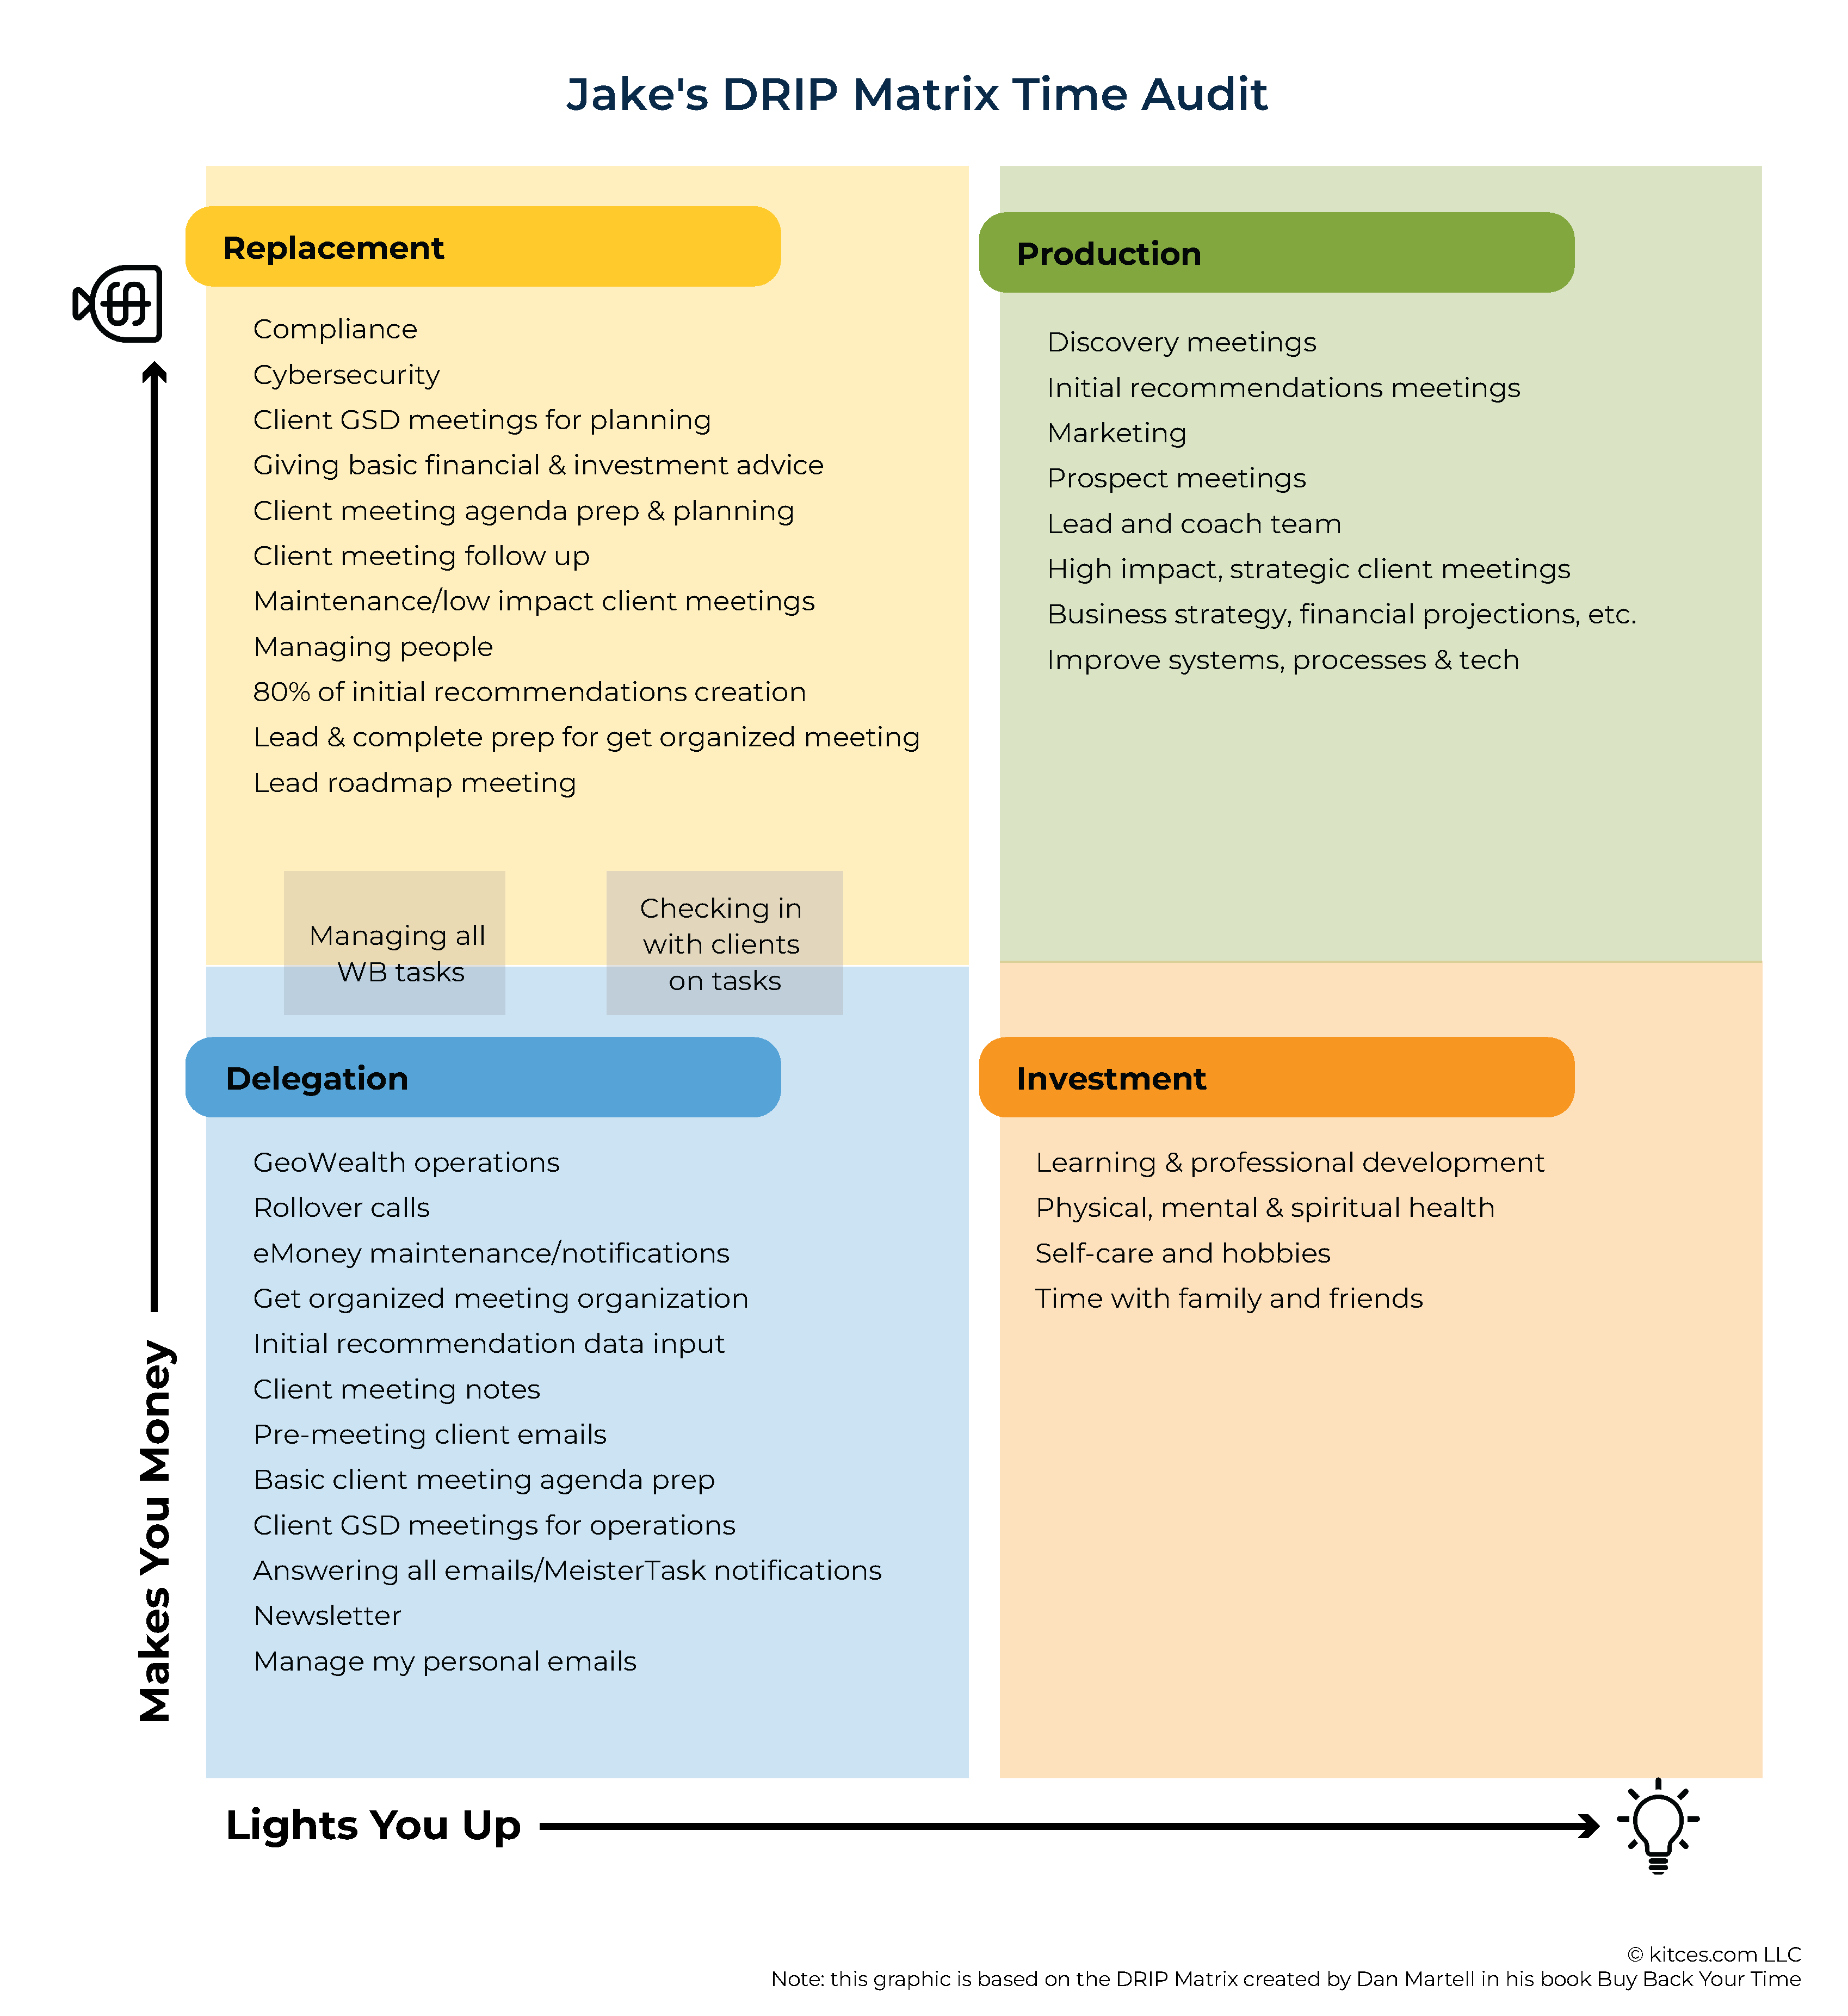
For example, in the DRIP matrix shared by Jake Northrup below, discovery meetings are marked as both lucrative and engaging, making them a clear priority. Conversely, rollover calls neither generate revenue nor spark enthusiasm for Jake, suggesting they are strong candidates for elimination or automation.
Tasks that neither energize the advisor nor directly contribute to revenue are in the "Delegation" quadrant and are the obvious first options for delegation or automation. From there, the focus can shift to addressing tasks in the "Replacement" quadrant, which gradually creates more time for the "Production" tasks that drive the firm forward and that, in turn, give the firm the resources it needs to address the tasks in the "Investment" quadrant.
This process will likely leave advisors with a long list of potential improvements. However, it's unlikely that all of them can be implemented at once – at least, not without creating disruptive shocks to other team members and processes, which may even lead to some unhappy clients. A more effective approach is to start small with 1 –2 things that can be improved quickly, and 1–2 longer-term projects to work on over the coming weeks or months. Remember, improving time management is a "game of inches".
Ultimately, the key point is that advisors looking to regain control of their time are best served by analyzing their own data to understand where their time is going. While this data may be useful on its own, taking it a step further and combining it with internal analysis and benchmarking studies can provide deeper insights. This approach enables advisors to get the most out of their time and take meaningful steps toward moving their firm to the next level!


