Executive Summary
Financial advisors often discuss how futile it is to try and predict what will happen in the stock market, and yet the reality is that a core component of creating a financial plan involves making a prediction for how markets will behave, at least in the long run. An assumed rate of return is needed, for example, to illustrate how much a client might need to save for retirement, how much savings they'll have when they do retire, and how long their savings will last after they stop working. Which means that advisors need some way to create a reasonable return assumption, even as just a starting 'average' scenario around which the advisor can build other scenarios to illustrate better or worse cases.
One way to predict future market returns is to use the past as a guide, with nearly 100 years of continuous market data since the 1920s covering a wide range of economic conditions showing that, for instance, the S&P 500 has had nearly a 10% average compounding return (7% above inflation) since 1926. And yet the problem with using that long-term average return is that investors generally don't have 100 years to invest – their time horizons are much shorter, usually spanning a few decades at most, and in those instances the conditions at the beginning of the time period (namely the market valuation compared to the underlying business and economic conditions at the time) can significantly impact the actual returns experienced over that period.
The Shilller Cyclically Adjusted Price-to-Earnings (CAPE 10) Ratio is one example that takes into account current market valuations versus company earnings, generally predicting that the higher the valuation at the beginning of a period the lower the expected return for that period. Which, at today's current high valuations, suggests that, for instance, the S&P 500 might 'only' return just over 5% over the next 10 years (as opposed to the 10% that it has averaged over the last nearly 100 years). Additionally, when breaking down current conditions even further to factor in the impact of the returns on cash, dividend yields, expected tax rates, and corporate leverage, U.S. equities could have a very difficult time trying to match or exceed the average returns of the past (and would need a tech bubble-like increase in valuations to come near the market's performance of the last decade)!
The key point is that when projecting future market returns, simply using historical averages without factoring in current evaluations risks painting an overly optimistic return scenario that could lead to under-saving for retirement (which could be exacerbated by a combination of higher life expectancies, increasing long-term care costs, and governmental funding difficulties around Social Security and Medicare). The good news, however, is that there are ways for advisors to address the current issue of high U.S. equity valuations, including diversification with international stocks (which have much lower valuations) to help mitigate the risk of the S&P 500 failing to repeat its past performance in the future, the use of value stocks, and alternative investments.
From 1926 through 2023, the S&P 500 provided an annualized (compound) rate of return of about 10% and a real annualized rate of return of about 7%. For financial advisors and investors with short memories or more subject to recency bias, the last decade's returns were even higher, with the S&P 500 returning close to 12%.
Unfortunately, many financial advisors and investors make the naive assumption of extrapolating historical returns when estimating future returns. They do so without considering the sources of the high returns, whether from abnormally high (or low) earnings growth or multiple expansion (or contraction). Today, this is a particularly bad mistake because much of the return to U.S. stocks over both the full period and over the last decade has been a result of a declining equity risk premium, resulting in higher valuations. Those higher valuations forecast lower future returns, as the best metric we have for estimating future returns is based on the Cyclically Adjusted Price-to-Earnings ratio known as the Shiller CAPE 10.
As we entered 2024, the Shiller CAPE 10 was more than 32. The best predictor we have of real future returns to equities is the inverse of the P/E ratio (i.e., E/P), or the earnings yield, producing a forecasted real return of about 3%, less than half the long-term average real return of 7%. We can estimate future inflation to be about 2.2%, determined by calculating the difference of the yield on the 10-year TIPS (about 1.7 % in early January) and the 10-year Treasury note (about 3.9% in early January). Adding the estimated future inflation of 2.2% to the forecasted real rate of 3% results in a forecasted nominal rate of just over 5% (about half the long-term return).
Before diving into the implications of these figures for advisors and their clients, we need to review the evidence on the CAPE as a predictor of future returns. The key message is that while the CAPE 10 is the best predictor we have, explaining about 40% of future long-term equity returns, there is still a wide dispersion of potential outcomes – high valuations can go higher and low valuations can go lower.
The Use (And Abuse) Of The CAPE 10
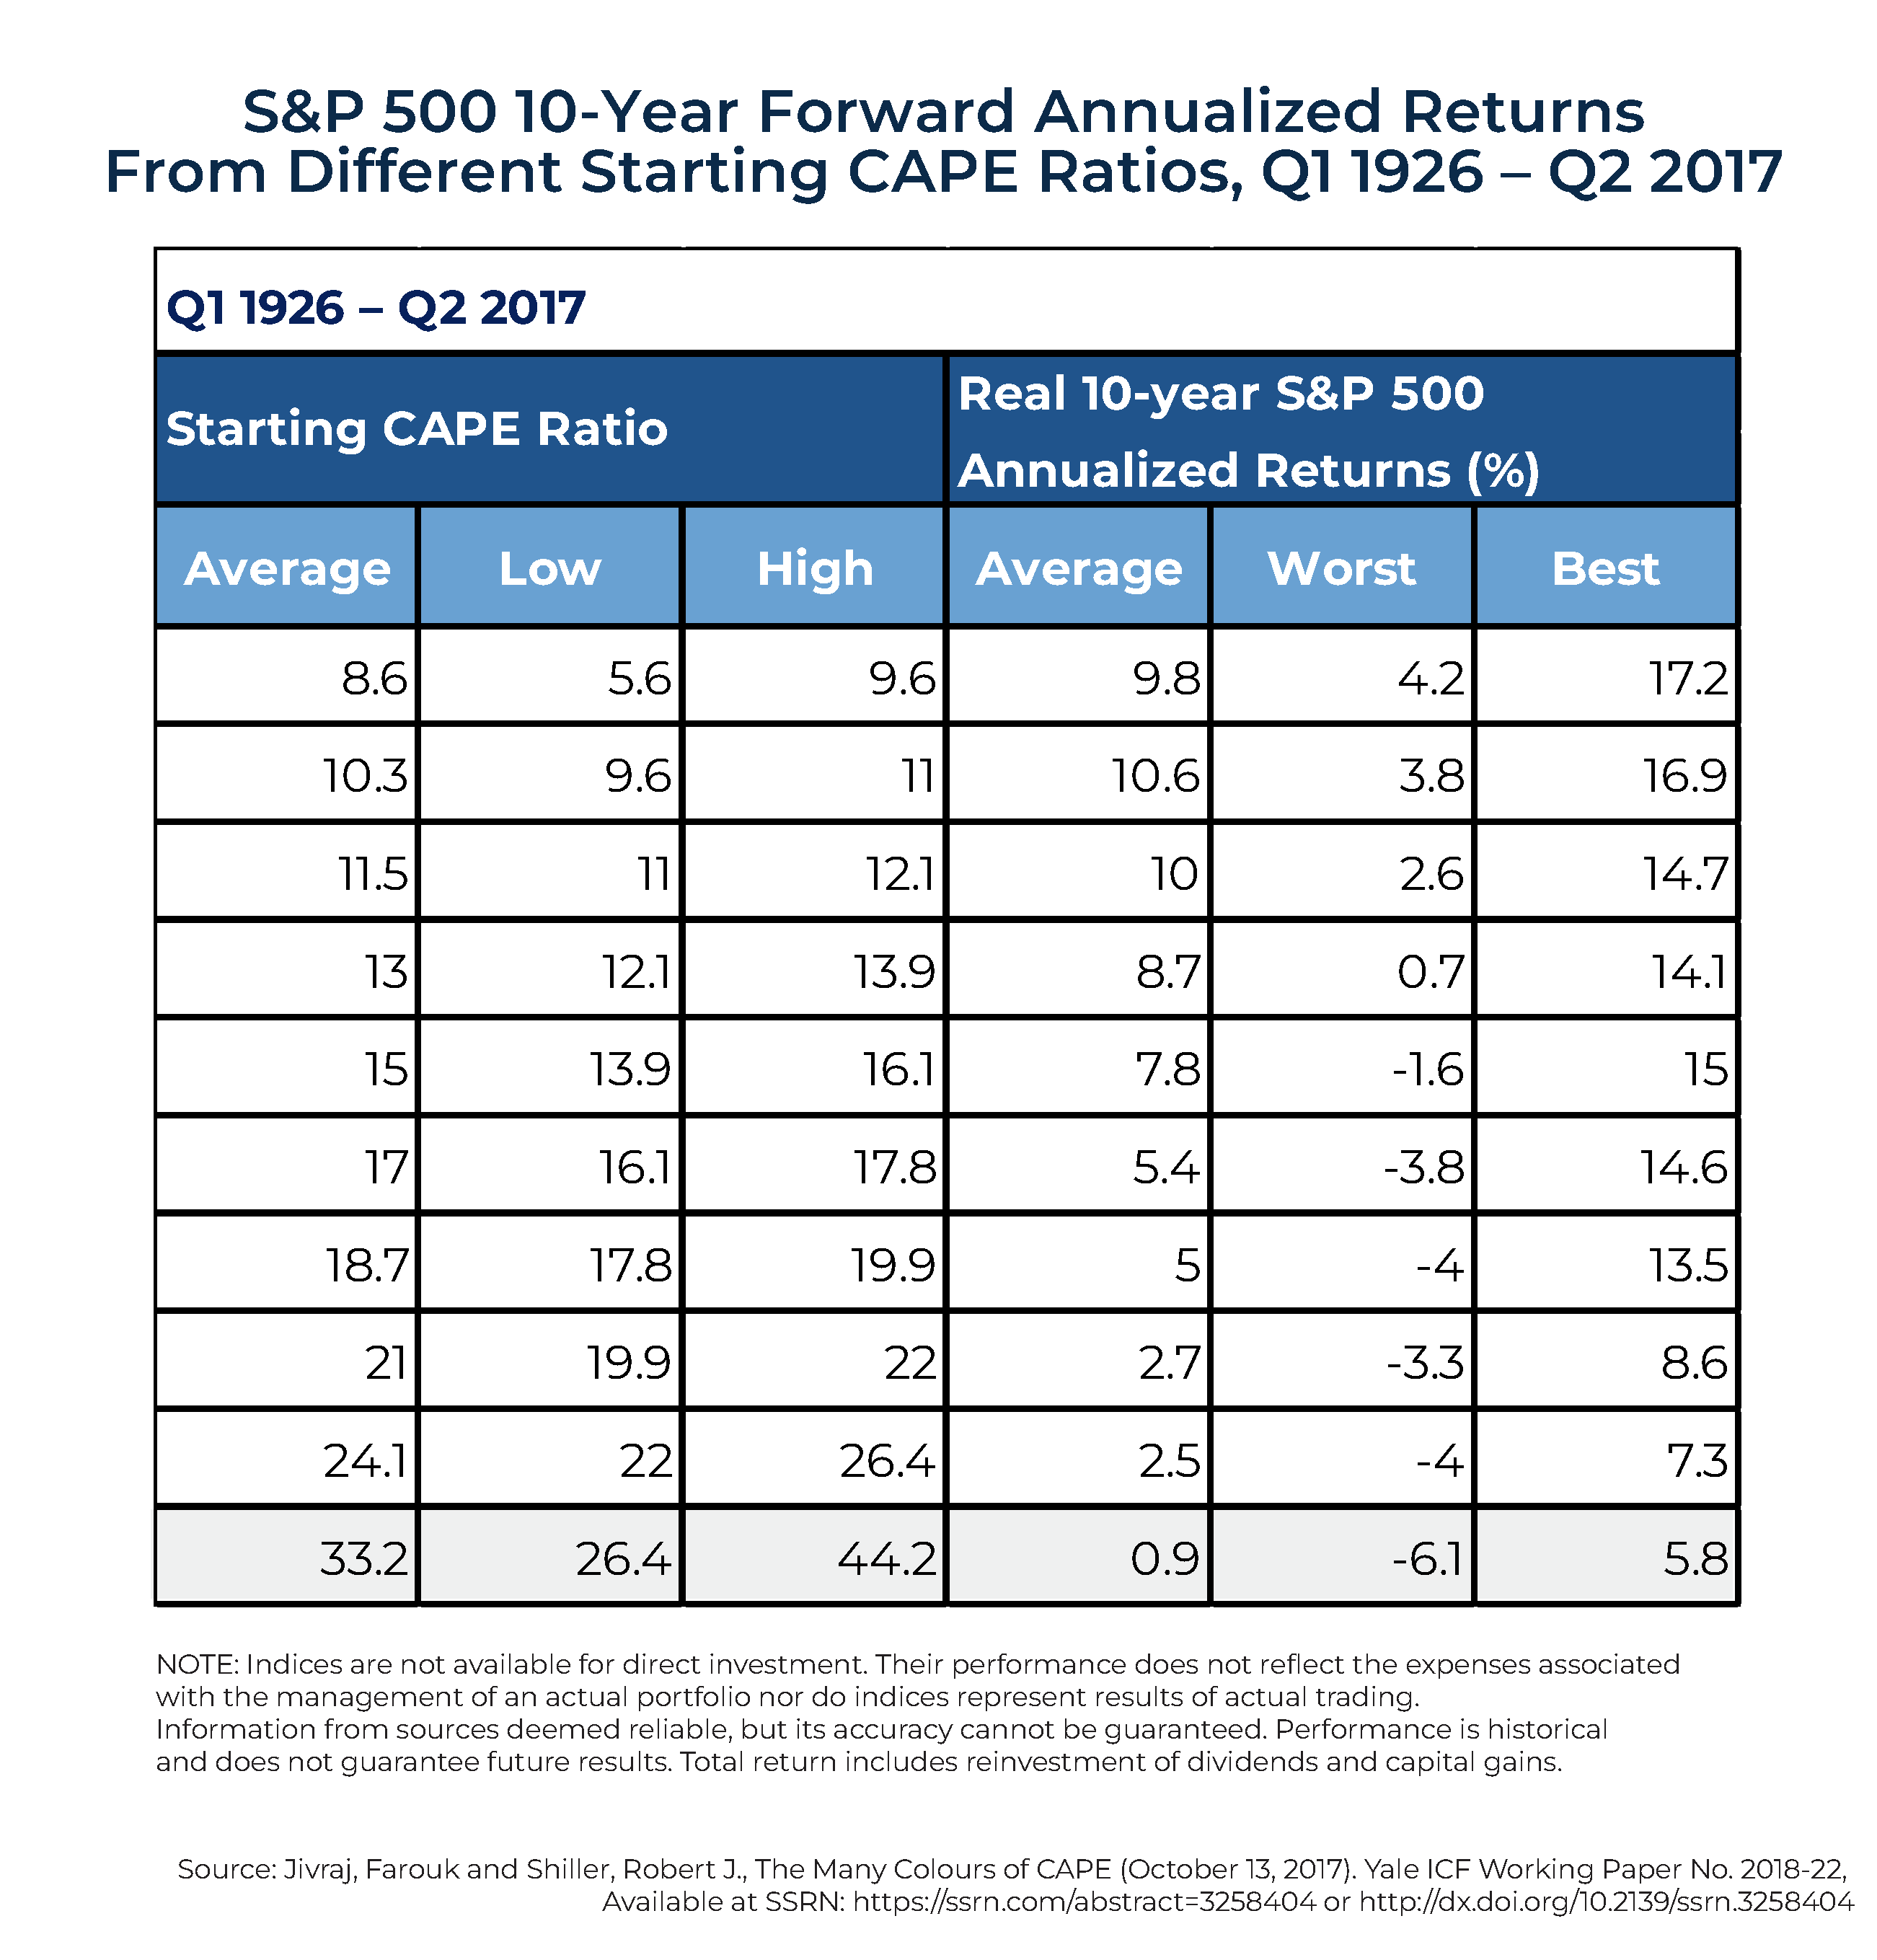
In their 2017 paper "The Many Colours of CAPE," Robert Shiller and Farouk Jivraj found that the CAPE 10 was a better predictor than any of the alternatives considered and provided valuable information. They found that 10-year-forward average real returns of the S&P 500 dropped nearly monotonically as starting CAPE ratios increased, as seen in their table below (which shows a "compilation of the 10-year forward real returns of the S&P 500 over every possible rolling decade since 1926 for different starting CAPE ratios and is then separated by deciles"). They also found that as the starting Shiller CAPE 10 ratio increased, worst cases became worse and best cases became weaker. Additionally, they found that while the metric provided valuable insights, there were still very wide dispersions of returns.
For example:
- When the CAPE 10 was below 9.6, 10-year-forward real returns averaged 9.8%, well above the historical average of 7.4%. The best 10-year-forward real return was 17.2%. The worst 10-year-forward real return was still a pretty good 4.2%. The range between the best and worst outcomes was a 13.0-percentage-point difference in real returns.
- When the CAPE 10 was between 16.1 and 17.8 (about its long-term average of 16.9), the 10-year-forward real return averaged 5.4%. The best and worst 10-year-forward real returns were 14.6% and -3.8%, respectively. The range between the best and worst outcomes was an 18.4 percentage point difference in real returns.
- When the CAPE 10 was above 26.4, the real return over the following 10 years averaged just 0.9% – only half a percentage point above the long-term real return on the risk-free benchmark, 1-month Treasury bills. The best 10-year-forward real return was 5.8%, and the worst 10-year-forward real return was -6.1%. The range between the best and worst outcomes was a difference of 11.9 percentage points in real returns.
As tests of robustness, Shiller and Jivraj also found that the CAPE 10 had explanatory power for both sector and individual stock returns.
What can we learn from the preceding data? First, starting valuations clearly matter, and they matter a lot. Higher starting values mean that not only are future expected returns lower, but the best outcomes are lower and the worst outcomes are worse. The reverse is true as well – lower starting values mean that not only are future expected returns higher, but the best outcomes are higher and the worst outcomes are less poor.
However, it's also extremely important to understand that a wide dispersion of potential outcomes, for which we must prepare when developing an investment plan, still exists – high (low) starting valuations don't necessarily result in poor (good) outcomes. In other words, investors should not think of a forecast as a single-point estimate, but only as the mean of a wide potential dispersion of returns. The main reason for the wide dispersion is that risk premiums vary over time (if they were not, there would be no risk in investing!). It is the time-varying risk premium, what John Bogle called the "speculative return" that leads to the wide dispersion in outcomes.
The fact that a wide dispersion of returns occurs around the mean forecast is why a Monte Carlo simulation is a valuable planning tool. While the input includes an estimated return, it also recognizes the risks of that mean forecast not being achieved – which is why volatility is another input. Because most simulators allow you to examine thousands of alternative universes, they enable you to test the durability of your plan – you can see the odds of success (such as not running out of money or leaving an estate of a certain size) across various asset allocations and spending rates.
The time-varying risk premium is also why an investment plan should include a plan B, a contingency plan that lists the actions to take if financial assets were to drop below a predetermined level. Actions might include remaining in (or returning to) the workforce, reducing current spending, reducing the financial goal, selling a home, and/or moving to a location with a lower cost of living.
The bottom line is that even though the predictive power of CAPE 10 used to estimate real returns of the S&P 500 has a good deal of variability, it is a valuable tool to build plans. However, advisors must not make the mistake of overestimating the forecasting power of the CAPE 10 metric and treating that forecast as what will happen. Instead, it should be used to help determine the need to take risks and then, with the understanding that risk premiums are time-varying and a wide dispersion of potential outcomes is likely, to help build a plan B.
Another mistake investors make when criticizing the use of the CAPE 10 is that it doesn't work as a timing tool. You would think Jeremy Grantham, the chief investment strategist of GMO, would have learned that, as he has been predicting a severe bear market as far back as 2013.
Driving With A Rear-View Mirror
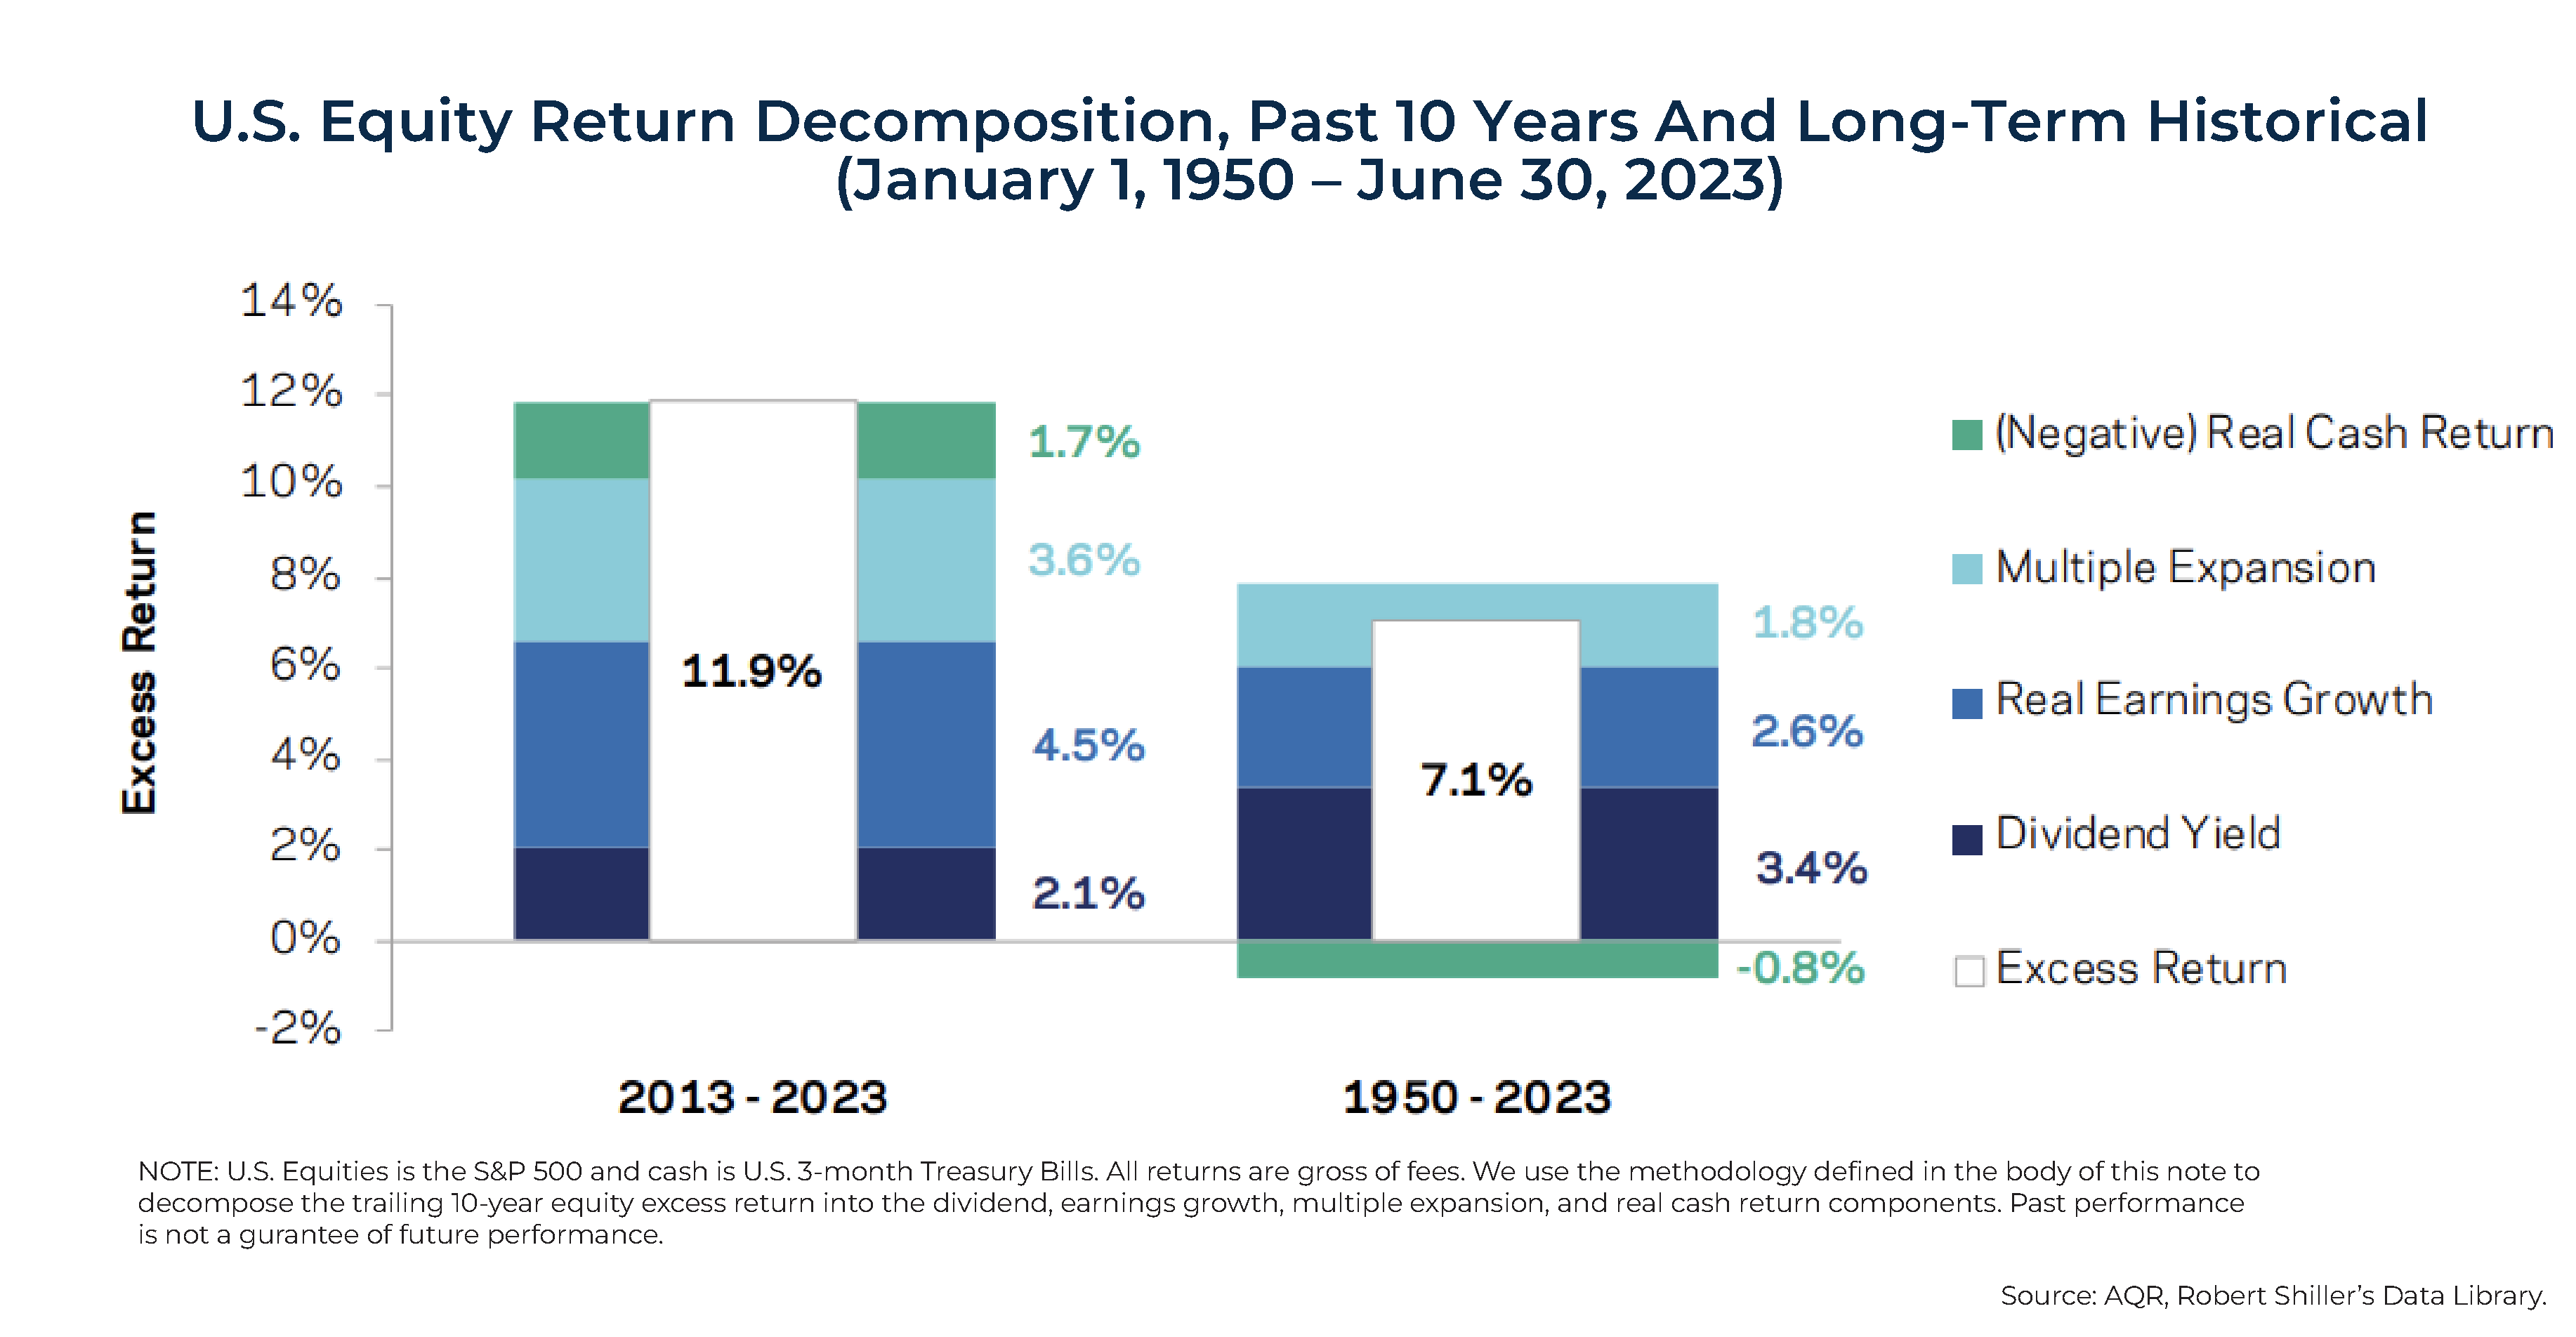
In his December 2023 paper "Driving with the Rear-View Mirror" AQR's Jordan Brooks examined the likelihood of U.S. returns repeating the strong returns of the last decade. To do so, he decomposed U.S. equity market excess-of-cash returns into 4 components: dividend yield, real earnings growth, multiple expansion, and the real return on cash. This allowed him to analyze assumptions about the next 10 years in order for investors to expect a repeat of the past decade or even just historically average performance.
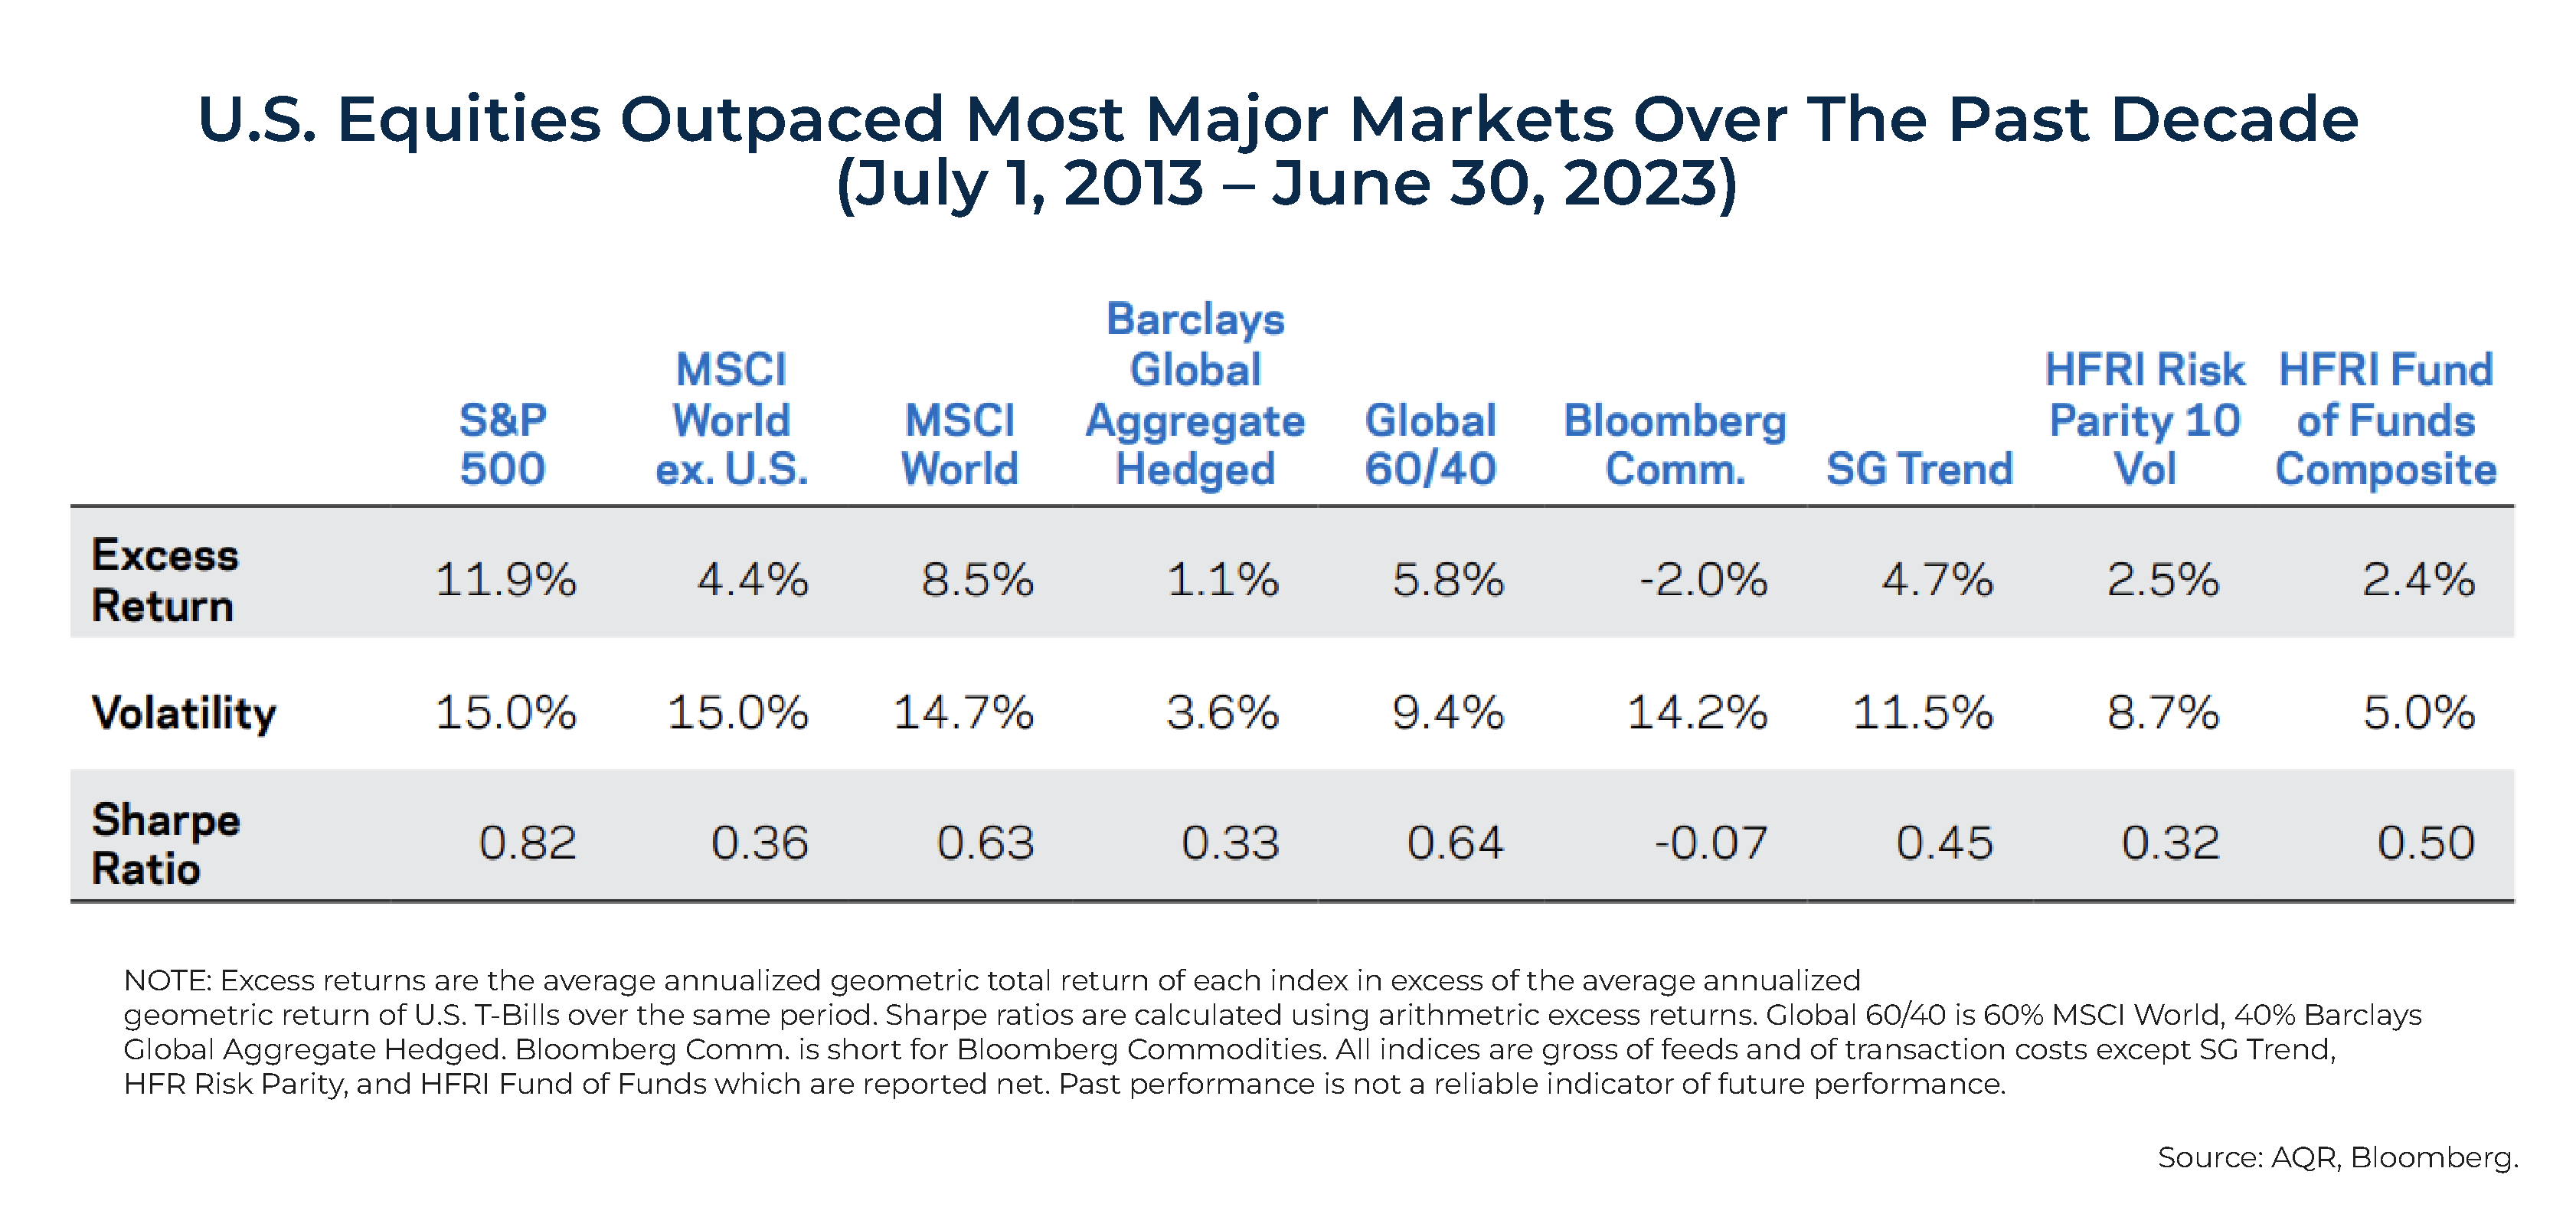
Brooks began by noting that U.S. equities, as represented by the S&P 500, had outperformed cash by 11.9% per year between July 1, 2013, and June 30, 2023. He observed that this was well above the 90th percentile of rolling 10-year performance across global developed equity markets since 1950. And the Sharpe ratio (excess return per unit of volatility) was 0.82, nearly double the postwar average for global developed equity markets. That performance was well above that of most major markets and investment strategies.
Decomposing the 11.9% return above cash, Brooks found the following:
- Dividend yields accounted for around 2.1%;
- Real earnings growth was extremely strong relative to history, contributing an incremental 4.5%;
- Multiple expansion contributed an additional 3.6%, as the CAPE rose from 24 to 30 – the rising valuation was in the top third of any 10-year period in the U.S. in over a century; and
- Cash provided a 1.7% negative excess return.
Performing the same analysis over the period 1950 to June 2023, Brooks found a 7.1% excess annualized return above cash.
What we observe is that the exceptional performance of U.S. equities over the past decade was due to a serendipitous combination of negative returns to cash, multiple expansion, and historically high real earnings growth (as over the long term, real earnings have grown in line with the real growth of the economy).
Note that from 1950 through 2023, the U.S. economy grew at a real rate of about 3%, and real earnings grew at 2.6%. However, from July 2013 through June 2023, real earnings grew much faster than the economy. In fact, the only year the real GDP grew by more than 2.9% was 2021 (real GDP growth was 5.9%). And 2021's growth was a bounce back from 2020 when the GDP fell by 2.8%. In other words, investors should not expect a repeat performance of real earnings growing faster than the economy.
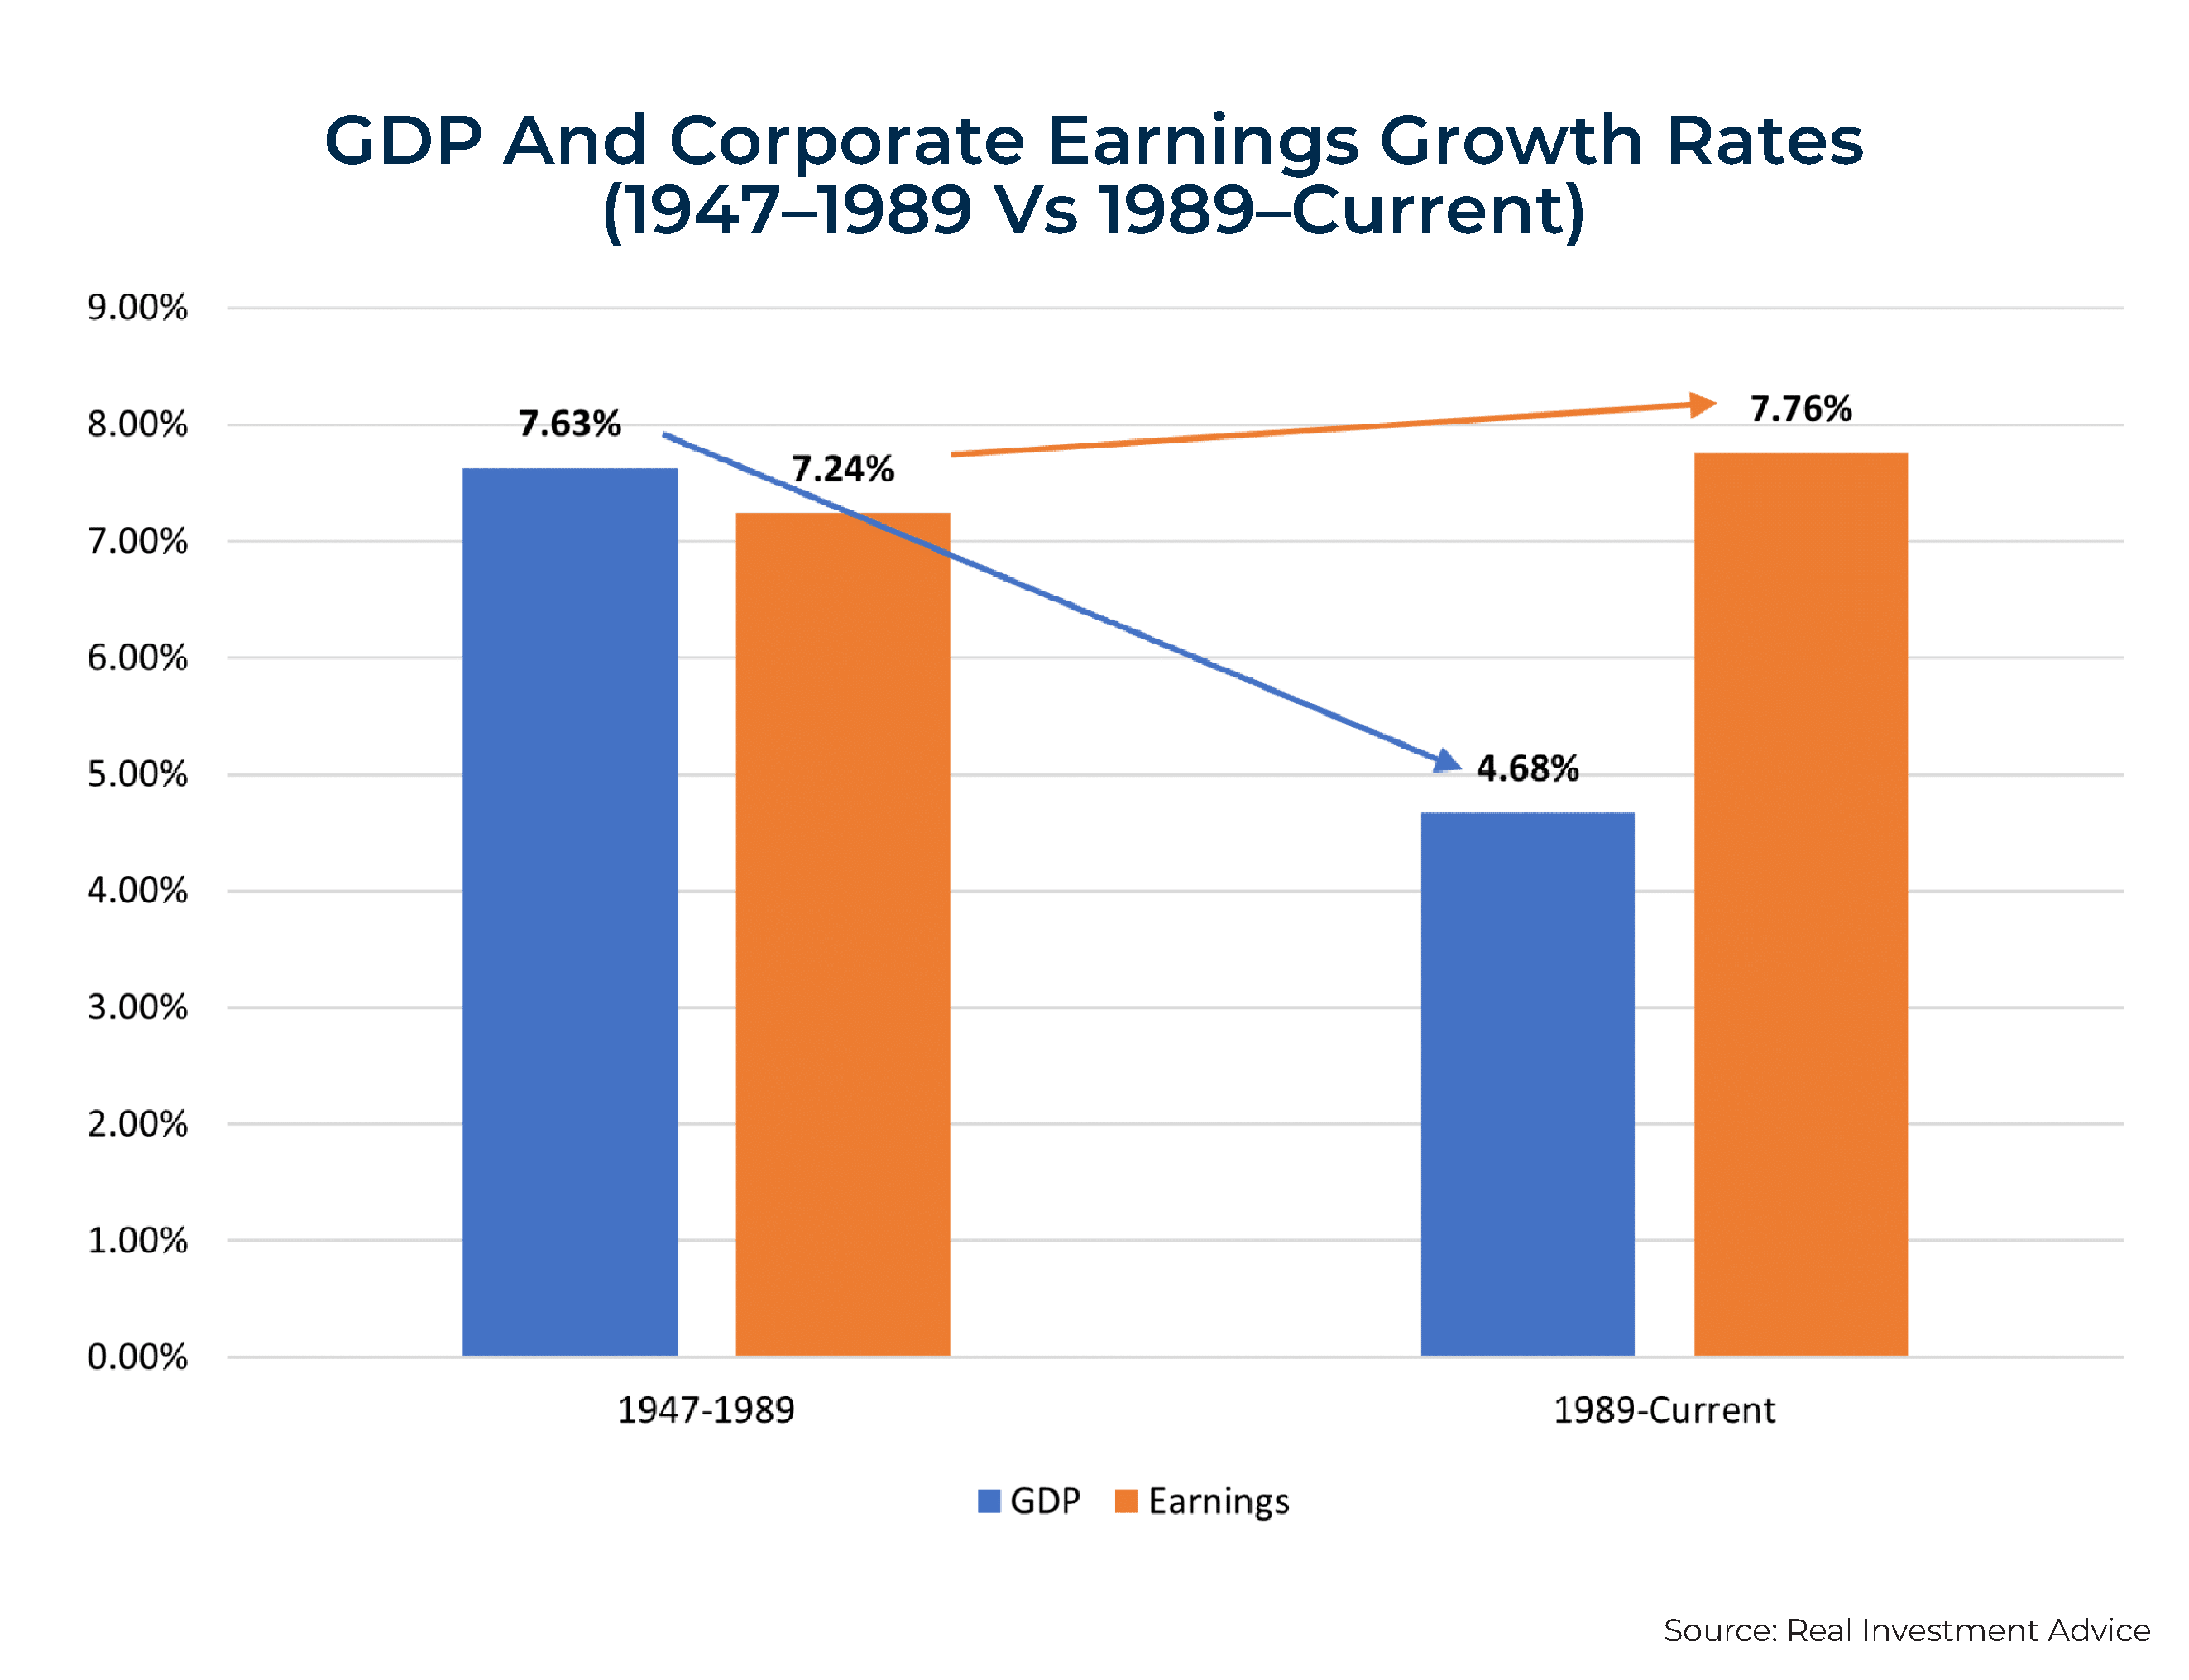
Jordan's findings take on increasing importance in light of the findings of a recent white paper by the Federal Reserve, "End of an Era: The Coming Long-Run Slowdown In Corporate Profit Growth And Stock Returns." The author, Michael Smolyansky, warned of "significantly lower profit growth and stock returns in the future." He explained how the interest rate and corporate tax-rate trends for the last 30 years were strong tailwinds for corporate profits. As a result, stocks performed better than otherwise would have been the case. The graph below shows that despite economic growth shrinking markedly, corporate earnings have grown faster over the last 30 years than in the 40 years before:
Effective Corporate Tax Rate
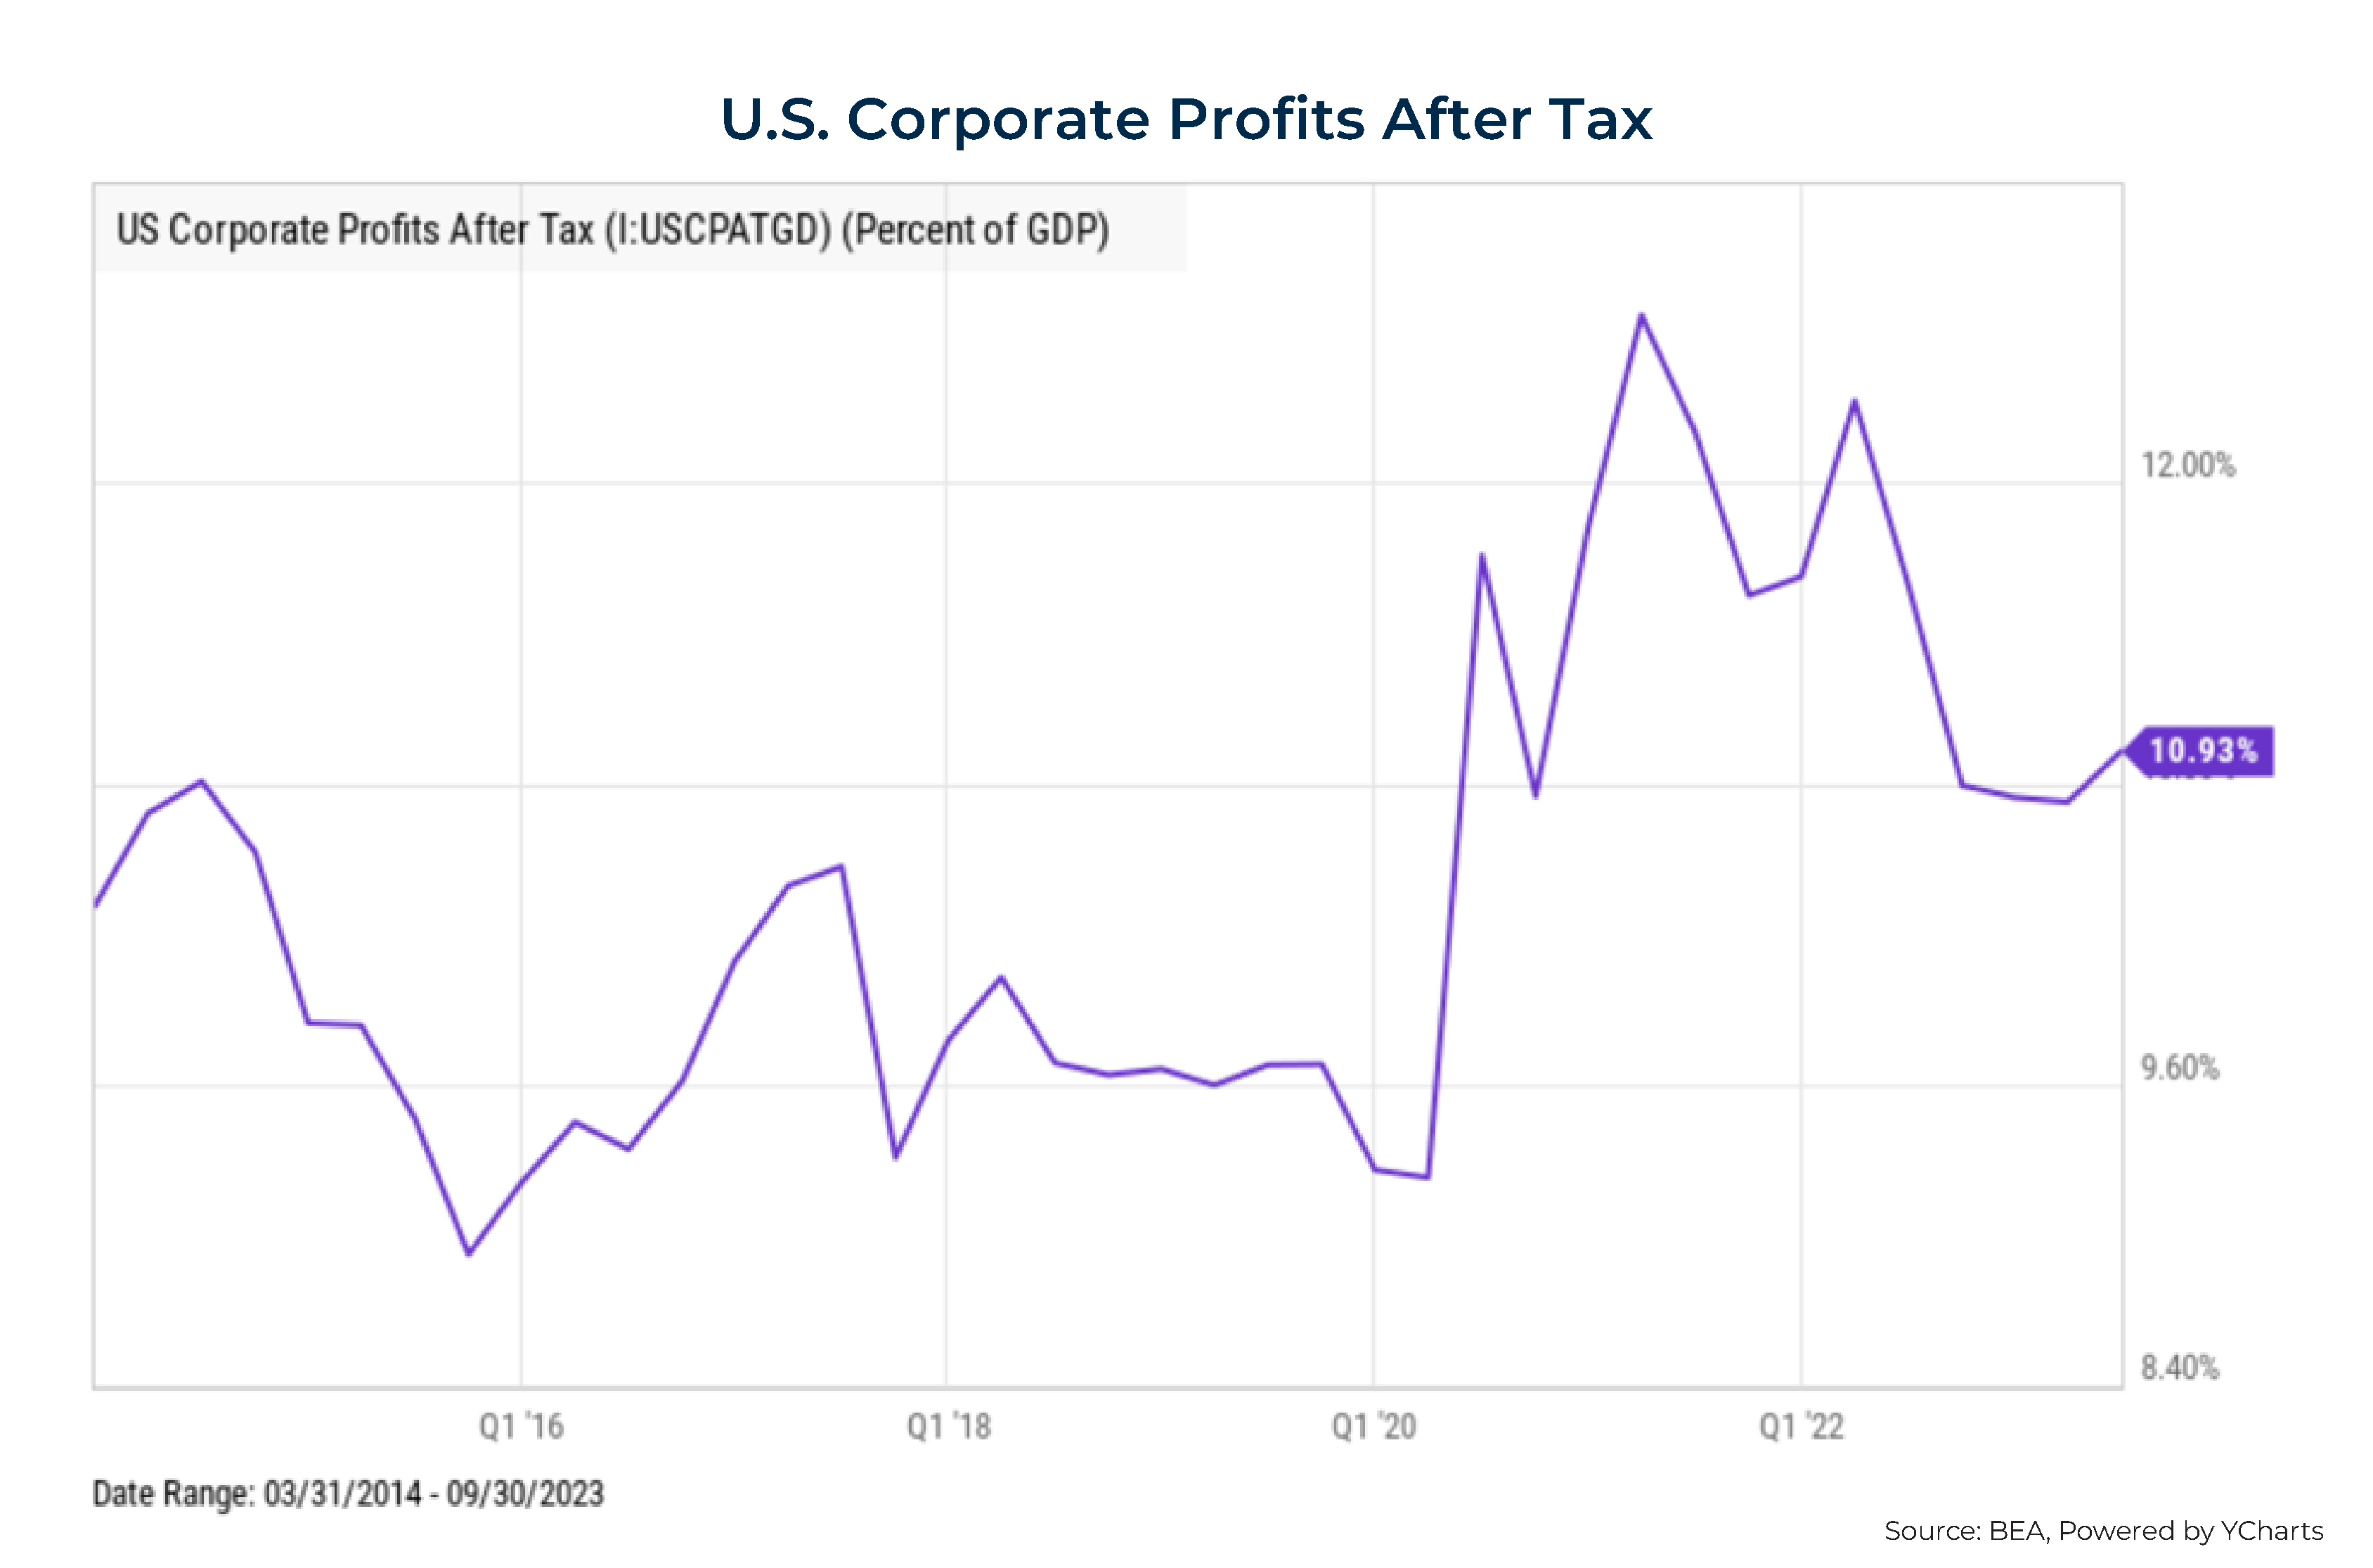
As Michael Lebowitz of RIA Advisors points out, "Corporate profits would have grown by 4.50%, not 7.76% annually, without the boost from [lower] interest rates and taxes". And more leverage (at lower rates). The result is that corporate profits as a percen. tage of GDP have risen from their historical average of about 7%. In fact, they peaked at 12.33% in June 2022 and fell to just under 11% by September 2023 as tight labor markets enabled labor to take an increasing share of the GDP, which, along with higher interest rates, negatively impacted profit rates.
However, while lower interest and tax rates boosted earnings growth significantly, the ability for that to continue is negligible. Lebowitz further notes the following:
Given that government deficits will continue to grow faster than the economy, it becomes increasingly unlikely that the government can afford to reduce corporate taxes. In fact, the odds favor raising taxes. Interest rates may fall back to the low levels of the last 10 years. Still, unless rates go negative, there is little room on the margin for corporations to reduce their effective interest rate meaningfully.
Consequently, corporate profit growth in aggregate likely will be closer to GDP growth rates in the future.
Furthermore, if tax rates rise, they may even fall below GDP growth. Lebowitz concludes that " investors will not be willing to pay an above-average valuation for what will seem like below-average profit growth." This has negative implications for valuations, as it seems unlikely investors will pay such high multiples for below-average profit growth.
What Does The Future Hold For U.S. Equities?
Having reviewed the decomposition of returns, Jordan Brooks turned to answering the question, "What would it take for a repeat performance?" He began by estimating the real return to cash. Jordan decided to use the Federal Reserve's estimate (0.5%) for r-star, the neutral (neither expansionary nor contractionary) fed funds rate at full employment and stable inflation. That is close to the historical real return to 1-month Treasury bills since 1926 of 0.3%.
Turning to the dividend yield, at the time, it was about 1.5%, which was the same as it was at year's end. With an expected return to cash of an average 0.5% per year, achieving an 11.9% excess-of-cash return requires a real equity market total return of 12.4%. With the dividend yield at 1.5%, that leaves 10.9% to be explained by a combination of real earnings growth and multiple expansion.
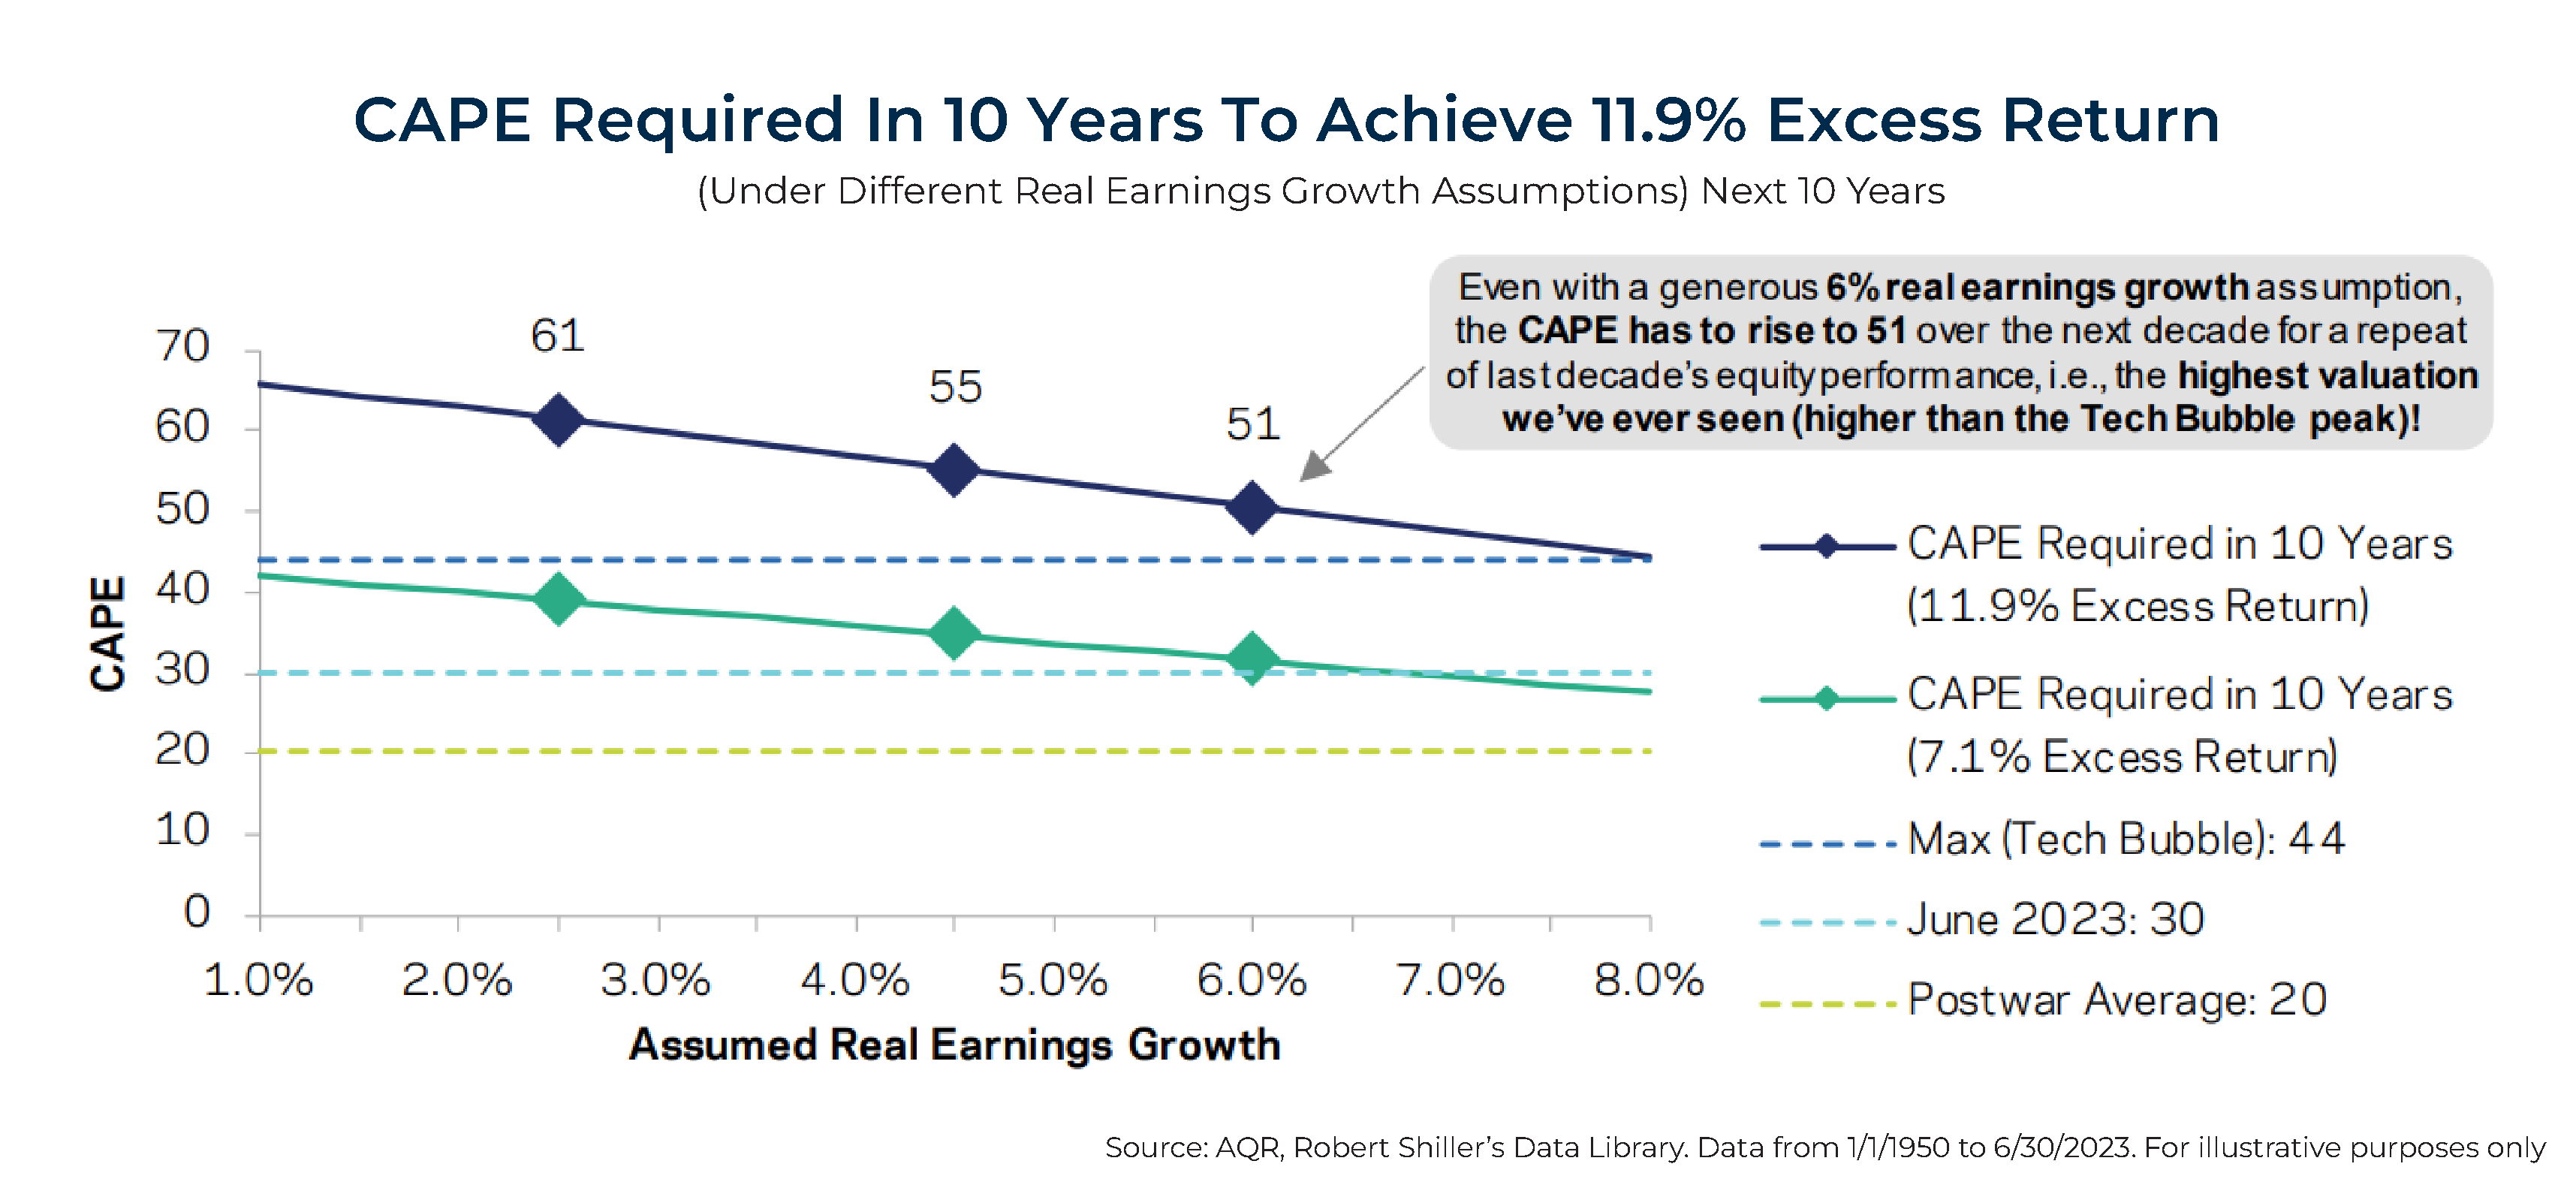
Brooks then showed the combination of real earnings growth and terminal (i.e., June 30, 2033) CAPE 10 ratios required to match the last decade's return. As the chart below shows, in even the most extreme real earnings scenarios, stock market valuations would need to rise to all-time highs, levels meaningfully higher than the tech bubble peak.
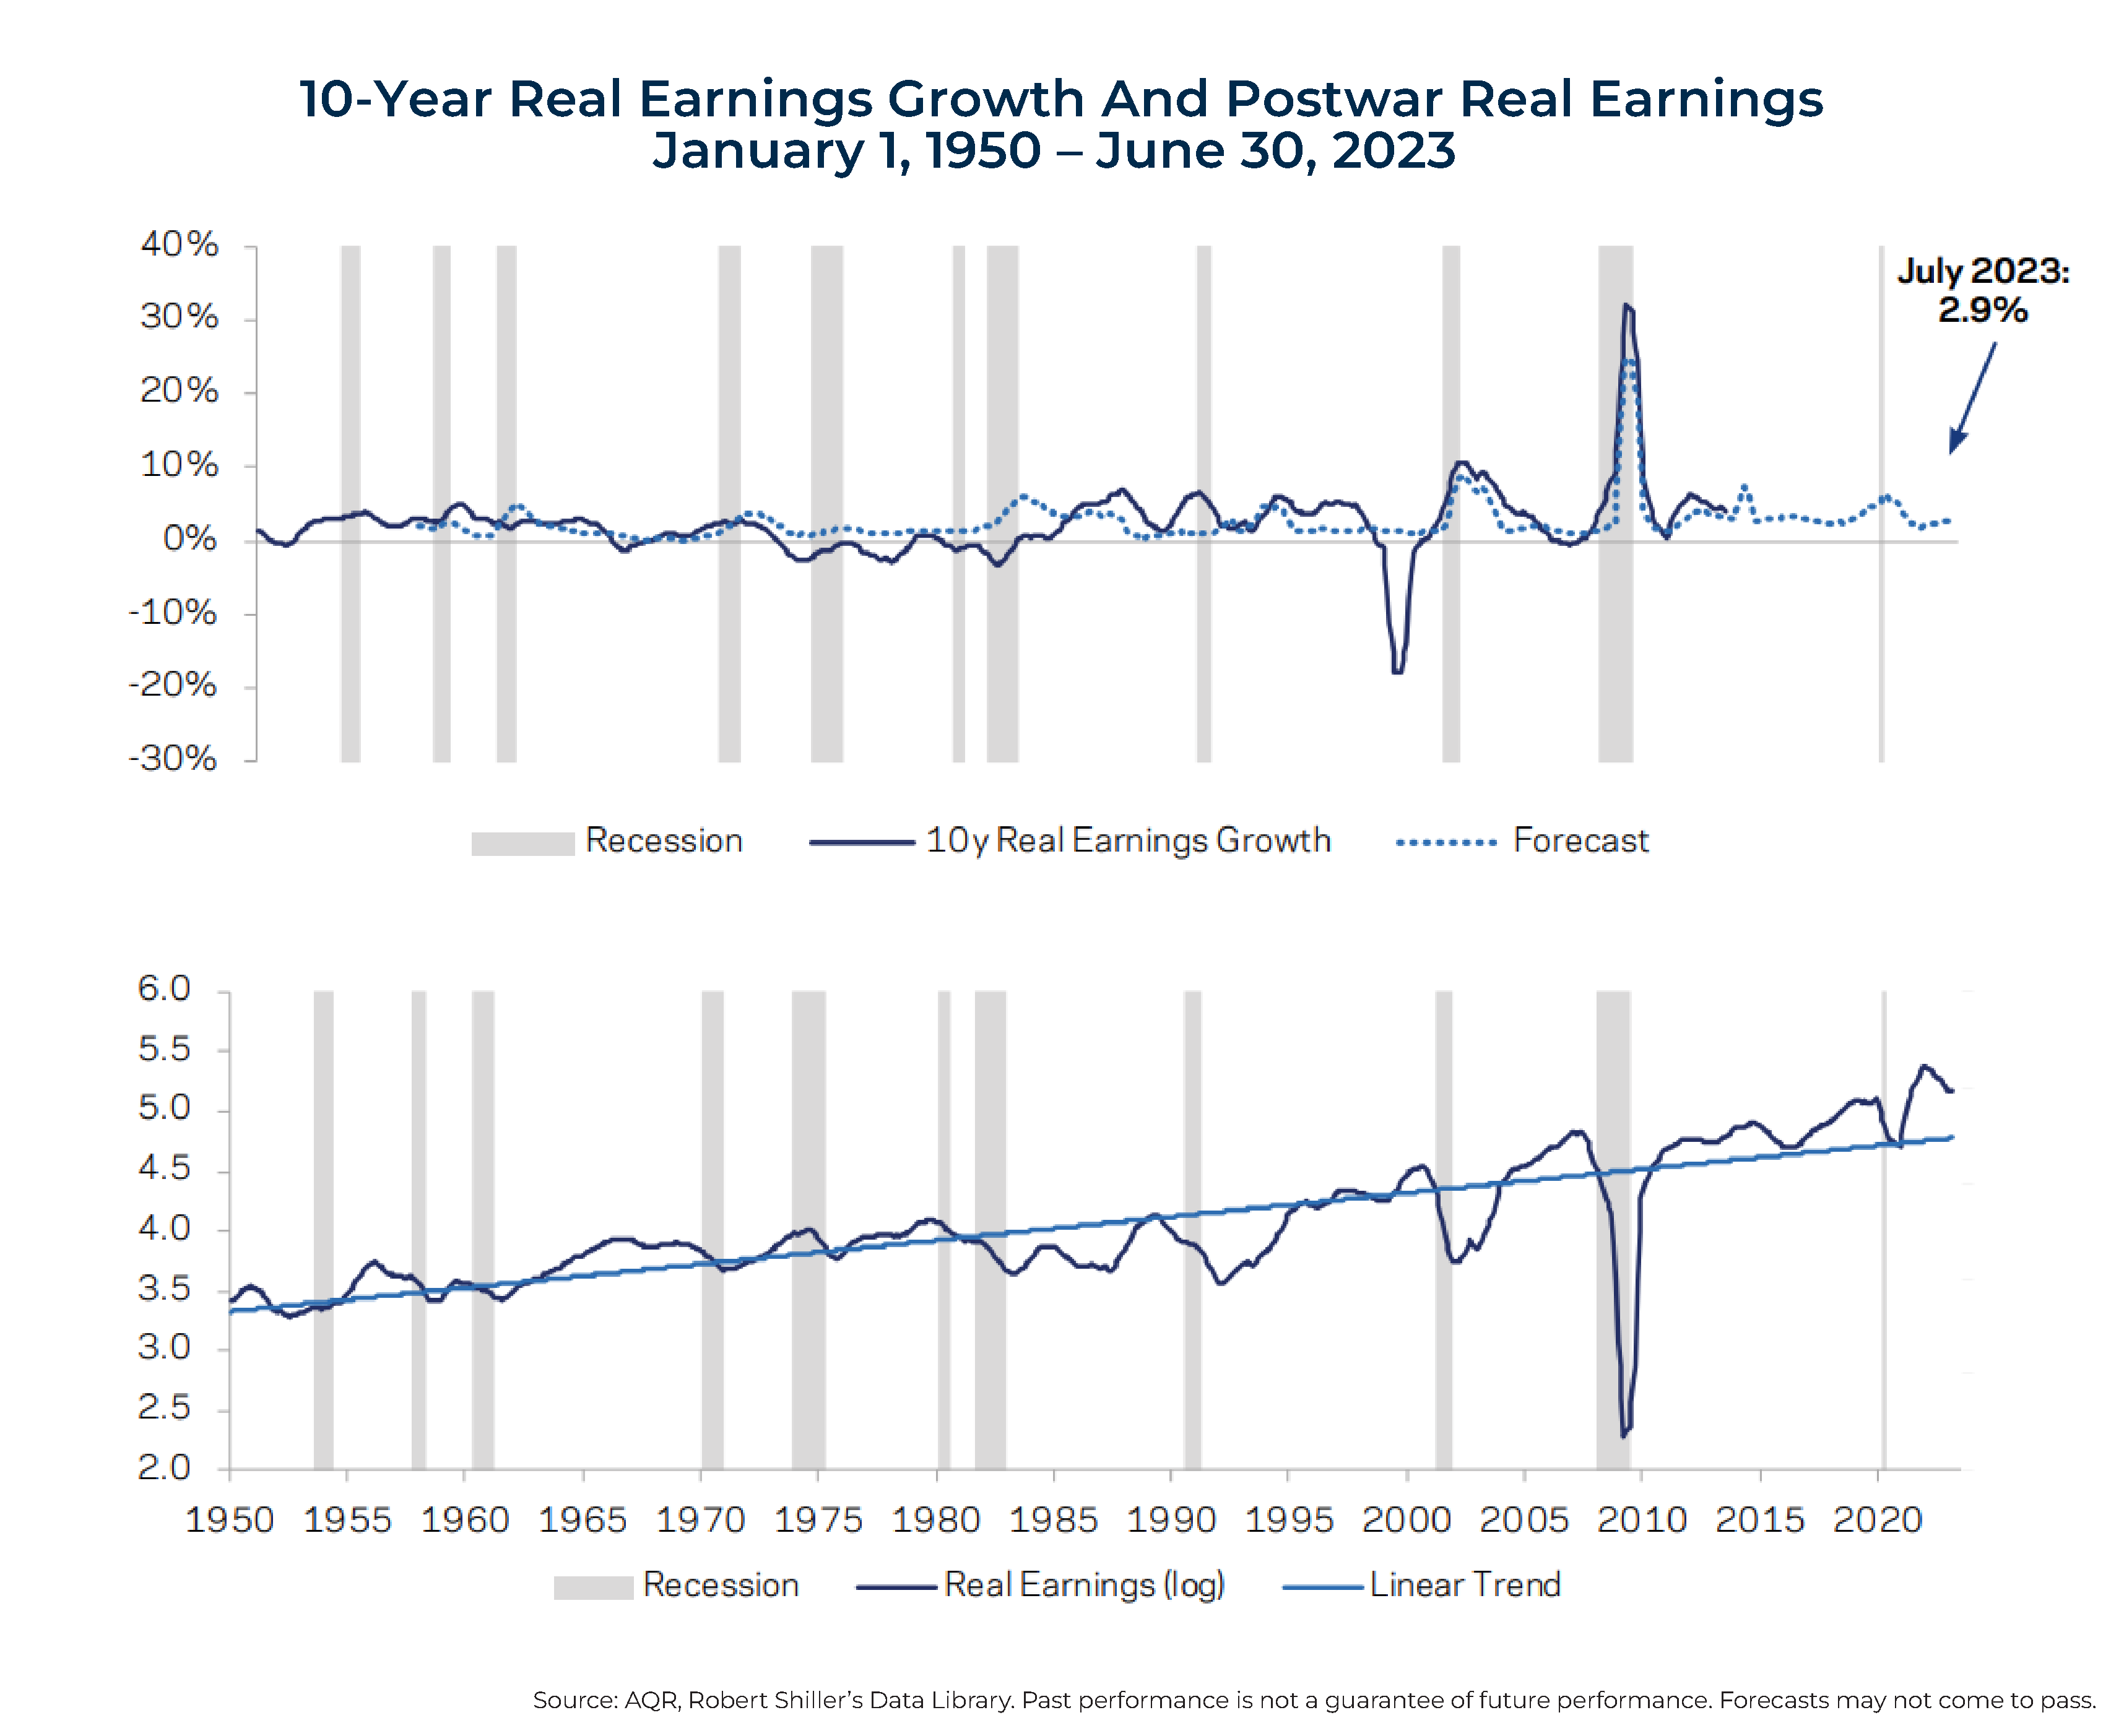
Having found that a repeat of the last decade's 11.9% return above cash for the S&P 500 was highly unlikely to result from returns relative to cash, from dividends, or from multiples expanding from already historically very high levels, Brooks looked at historical real earnings growth rates. As mentioned, real U.S. earnings growth had averaged 2.6%, slightly below the 3% historical growth of the real GDP.
Brooks found that even the 75th percentile of earnings growth was only 4.1%, and even the 90th percentile was 6.0%. He did find that there were 2 10-year periods over which real earnings growth exceeded 10%. However, both took place starting from the trough of recessions when the level of earnings was severely depressed – post-tech bubble and post-Global Financial Crisis (GFC). These are very different economic and market environments than today's.
Brooks did find that the real growth in earnings was mean reverting (with strong past real earnings growth forecasting lower future real earnings growth) and countercyclical (where future real earnings growth tends to be higher when the economy is weaker and lower when it is stronger). Using that information, Brooks built a simple model, reflected by the dotted line in the graphic below, which predicted real earnings growth of 2.9%, close to the historical average.
In light of the findings reviewed from the study "End of an Era: The Coming Long-Run Slowdown In Corporate Profit Growth And Stock Returns" by Michael Smolyansky, a forecast of 2.9% in real earnings growth might be an optimistic forecast, as Smolyansky warned about the risk that we could see "significantly lower profit growth and stock returns in the future." Keeping that in mind, we can see what multiple expansion would be required if earnings grew at 2.5% (roughly the postwar average). Should that occur, Brooks found that the CAPE 10 would need to more than double from its then-current value in late 2023 of 30 (it ended the year at about 32) to 61 for the stock market to post a repeat performance. That is nearly 40% higher than the tech bubble peak of 44.14.
On the other hand, Brooks did note that there are at least some reasons to be optimistic, as follows:
Advances in artificial intelligence may boost corporate profitability, as the internet did. Between 1985 (subsequent to the economic pain of the Volcker disinflation) and 2007 (prior to the onset of the GFC) – very generously chosen endpoints – average annualized 10-year real earnings growth was roughly 4.2% as productivity boomed and the internet fueled strong corporate earnings.
Assuming real earnings grow by 4.5% per year over the next decade, the CAPE would still need to increase by over 80% from its current level of 30 to 55, 25% above its Tech Bubble peak of 44.
If we are even more optimistic and assume 6% real earnings growth, which is roughly the best ever outcome over a 10-year period during normal, non-recessionary times, the market would still need to trade at all-time high valuations (CAPE of 51) to match the last decade's excess-of-cash performance.
What Would It Take To Get Historically Average Returns?
Since the last decade's performance was of historic proportions, Brooks looked at what it would take to have the S&P 500 produce the same returns as the historical average. The green line in the graphic shown earlier (CAPE Required In 10 Years") illustrates the combinations of real earnings growth and terminal CAPE 10 multiples consistent with 7.1% average excess returns. As Brooks explains:
For all reasonable real earnings growth outcomes, multiples must continue to expand from already rich current levels. For example, if real earnings grow by 4.5% over the next decade, the CAPE will need to richen from 30 to 35 for the market to realize average excess-of-cash performance. And if real earnings growth comes in at its historical average, the terminal CAPE would need to be close to 40. For the market to deliver even average performance over the next 10 years requires both strong earnings growth and richening valuations.
Based on his findings, Brooks makes the following conclusion:
…a repeat of the past decade's equity market performance would require a heroic set of assumptions: both extraordinary real earnings growth and all-time-high valuations. While this outcome is not impossible, it is an implausible baseline assumption…
…given low current dividend yields and positive real cash rates, even historically average equity market performance would likely require price-earnings multiples to expand from already rich valuation levels.
Addressing The Issue Of High U.S. Valuations
The good news is that there are several ways advisors and their clients can address the issue of high U.S. equity valuations.
International Markets
Fortunately for investors, forecasts for international returns provide greater comfort and reason for optimism. The poor performance of international equities over the past decade (the MSCI EAFE Index returned about 4.4% per annum, and the MSCI Emerging Markets Index returned about 2.1% per annum) has resulted in their CAPE 10 ratios being dramatically lower than the U.S.'s 32.
The Shiller CAPE 10 earnings yield for the U.S., non-U.S. developed markets, and emerging markets at year-end 2023 were 3.5%, 5.5%, and 7.1%, respectively. Thus, if advisors rely on an allocation to international markets, their forecast for returns should be somewhat higher than for a U.S.-only portfolio, and they can increase their allocation to international equities (especially) if it is below a global market-cap weighting of about U.S. 61%, developed non-U.S. 28%, and emerging markets 11%).
Value Stocks
While the S&P 500 Index is trading at historically high levels, this is not the case for U.S. value stocks. For example, while the Vanguard Growth ETF (VUG) had a trailing 12-month P/E of about 38, Dimensional's US Large Cap Value ETF (DFLV) and its US Small Value ETF (DFSV) had trailing 12-month P/Es of about 12 and 9, respectively.
The ratio of the growth P/E to the value P/Es is at a historically high level, forecasting a larger-than-historical value premium. Value stocks are also trading at relatively low levels around the globe, as evidenced by the trailing 12-month P/Es of Dimensional's International Value ETF (DFIV), its International Small Cap Value ETF (DISV), and its Emerging Markets Value ETF (DFEV), at about 9, 8, and 7, respectively.
Alternative Investments
Several alternative investments provide exposure to unique (diversifying) risks that are trading with expected returns at historically high levels due to large illiquidity premiums and, in some cases, relatively poor recent performance, which has resulted in higher yields, larger risk premiums, and tighter underwriting standards.
- Reinsurance. When losses occurred due to unprecedented fires in California, not only did premiums rise dramatically, but underwriting standards tightened (such that you could not buy insurance if you had trees within 30 feet of your home, and then all brush had to be cleared for another 30 feet) and deductibles increased significantly (reducing the risk of losses). And when losses occurred due to hurricanes in Florida, the same combination of events happened (rising premiums and deductibles and tougher underwriting standards). Funds that should be considered include Pioneer ILS Interval Fund (XILSX) and Stone Ridge's High Yield Reinsurance Risk Premium Fund (SHRIX) and Reinsurance Risk Premium Interval Fund (SRRIX).
- Long-short, market-neutral, factor-based funds. These funds provide exposure to factors such as value, momentum, carry, and quality. Funds to consider are AQR's Style Premia Alternative Fund (QSPRX) for tax-advantaged accounts and its Alternative Risk Premia Fund (QRPIX) for taxable accounts.
- Private credit. With the ability of U.S. banks to lend constrained by rising capital requirements, private lenders have stepped in to fill some of the gap. The increased demand has allowed credit spreads to widen and underwriting standards to tighten. And yields have benefited from the sharp rise in short-term interest rates. A fund to consider is Cliffwater's Corporate Lending Fund (CCLFX), which has a current estimated yield to maturity of about 12%. Another fund to consider is Cliffwater's Enhanced Lending Fund (CELFX), which provides credit to other sectors (such as legal finance, royalties, real estate, venture capital debt, equipment leasing, and others). The fund has an estimated yield to maturity of about 13%.
If U.S. equity performance over the next decade is more in line with what should be expected from current valuations (or, even worse, if valuations revert to historical means), diversifying across other unique sources of risk is likely to be meaningfully more valuable to investors over the next decade.
The 5 Horsemen Of The Retirement Apocalypse
 The problem of high U.S. equity valuations forecasting lower future returns takes on increasing significance in light of other critical issues facing investors. In my 2020 book Your Complete Guide to a Successful & Secure Retirement, co-authored with Kevin Grogan, we discussed 5 major issues investors planning for retirement had to address. We called them the "5 horsemen of the retirement apocalypse".
The 1st horseman was the high valuations of U.S. equities.
The 2nd horseman was the extremely low level of bond yields, with real yields being negative.
The 3rd horseman was that longevity had increased significantly, the result being that expected returns were well below historical averages. Thus, portfolios would have to last longer, resulting in a significantly lower safe withdrawal rate.
The 4th horseman was that, with longevity increasing, the risk of the need for expensive long-term care also was increasing. For example, the likelihood of developing Alzheimer's doubles about every 5 years after 65. After age 85, it increases even faster, with 1 in 3 people diagnosed with the disease.
The 5th horseman was the failure of Congress to address the problem of the underfunding of Social Security, Medicare, and Medicaid. The recently released 2023 OASDI Trustees Report estimates that "the dollar level of the hypothetical combined trust fund reserves declines until reserves become depleted in 2034". At that time, the program will only be able to pay 80% of scheduled benefits.
While interest rates (importantly, real interest rates) have risen substantially, resolving the issue of the 2nd horseman, the other 4 horsemen remain as issues investors must address when planning for retirement. Thus, it's not only high U.S. valuations that are of concern; it's that high valuations make the other 4 issues even more of a concern, as the returns to the overall U.S. equity market are projected to be much lower than the historical average.
Before summarizing, it is important to emphasize 2 key points. First, while the total U.S. market has a high historical valuation, that is not the case for either international or value stocks, which are trading below their historical averages. For investors willing to accept the risks of negative tracking variance to broad market indices, one way to address the "horsemen" is to increase allocations to international and value stocks. And they can increase allocations to the alternatives mentioned above.
Second, the high valuation of the overall stock market does not mean that investors should necessarily lower their equity allocation. Even with the high valuation of the large-cap U.S. growth stocks that dominate market-cap weighted indices, there is still an expectation of an equity risk premium over riskless Treasury bills (note that the inversion of the current yield curve is predicting that today's 5.5% yield on short-term Treasury bills is likely headed lower).
Recency bias, the tendency to overweight recent events/trends and projecting them into the future, can lead to major investment mistakes, especially in financial markets, where strong performance is typically related to high valuations. Financial advisors and investors who extrapolate the last decade's return to the S&P 500 are ignoring the long-term empirical evidence showing that current valuations are the best predictor we have of future returns (and valuations are at historically high levels, predicting lower future returns), and abnormal growth in real earnings tends to mean revert (and earnings growth has been abnormally high). Jordan Brooks showed that it would take another decade of serendipitous events to see an encore of the last decade's equity market performance—"exceptional real earnings growth and all-time high valuations, with investors likely paying at least 80% more per dollar of earnings than at present."
Given the empirical evidence, it is critical that financial plans do not make the mistake of assuming future returns to U.S. stocks will look like past returns, especially those of the most recent decade. Plans that rely on such assumptions are likely to fail due to withdrawal rates based on forecasted returns that were too high. Advisors and investors should make sure that their return assumptions are based on current valuations, not historical averages.
Advisors and investors can also benefit from avoiding the mistake of home-country bias, especially if the mistake is compounded by recency bias. Despite international equities making up about half of the global equity market, the average allocation to international stocks for individual investors is only about 10%. Vanguard, for example, recommends that at least 20% of your overall portfolio should be invested in international stocks and bonds. However, they also recommend about a 40% stock allocation to get the full diversification benefits.
Given the dramatically lower current valuations of international equities, the argument for having at least a global market cap allocation to international stocks should be considered. And given the historically wide spread between growth and value P/E ratios, investors might consider increasing their exposure to the value factor. Finally, with the introduction of interval funds, investors now have access to other unique sources of risk to consider that currently have relatively high expected returns.
Larry Swedroe is head of financial and economic research for Buckingham Wealth Partners, collectively Buckingham Strategic Wealth, LLC and Buckingham Strategic Partners, LLC.
For informational and educational purposes only and should not be construed as specific investment, accounting, legal, or tax advice. Certain information is based on third-party data and may become outdated or otherwise superseded without notice. Mentions of specific securities are for informational purposes and individuals should speak with a qualified financial professional to determine if they are available investment options. Individuals should read fund prospectuses and fund information prior to implementation. Indices are not available for direct investment. Their performance does not reflect the expenses associated with the management of an actual portfolio nor do indices represent results of actual trading. Information from sources deemed reliable, but its accuracy cannot be guaranteed. Performance is historical and does not guarantee future results. Total return includes reinvestment of dividends and capital gains. Neither the Securities and Exchange Commission (SEC) have approved, determined the accuracy, or confirmed the adequacy of this article. The opinions expressed here are their own and may not accurately reflect those of Buckingham Strategic Wealth, LLC or Buckingham Strategic Partners, LLC (collectively Buckingham Wealth Partners). LSR-23-615




Leave a Reply